| Param | Original file | Final file |
|---|---|---|
| Filename | modeM0/AS1A10_103T03_9000005296_37269cztM0_level2.evt | modeM0/AS1A10_103T03_9000005296_37269cztM0_level2_quad_clean.evt |
| Size (bytes) | 421,695,360 | 83,638,080 |
| Size | 402.2 MB | 79.8 MB |
| Events in quadrant A | 3,045,959 | 551,856 |
| Events in quadrant B | 3,279,039 | 527,694 |
| Events in quadrant C | 2,968,757 | 532,993 |
| Events in quadrant D | 3,089,371 | 521,163 |
| Mode M0 | |||
|---|---|---|---|
| Quadrant | BADHDUFLAG | Total packets | Discarded packets |
| A | 0 | 13054 | 3 |
| B | 0 | 13584 | 2 |
| C | 0 | 12393 | 2 |
| D | 0 | 13474 | 2 |
| Mode SS | |||
|---|---|---|---|
| Quadrant | BADHDUFLAG | Total packets | Discarded packets |
| A | 0 | 116 | 0 |
| B | 0 | 116 | 0 |
| C | 0 | 116 | 0 |
| D | 0 | 116 | 0 |
| Mode M9 | |||
|---|---|---|---|
| Quadrant | BADHDUFLAG | Total packets | Discarded packets |
| A | 0 | 26 | 0 |
| B | 0 | 26 | 0 |
| C | 0 | 26 | 0 |
| D | 0 | 26 | 0 |
| Quadrant | Total seconds | Saturated seconds | Saturation percentage |
|---|---|---|---|
| A | 5708 | 62 | 1.086195% |
| B | 5708 | 102 | 1.786966% |
| C | 5708 | 60 | 1.051156% |
| D | 5708 | 109 | 1.909601% |
Noise dominated data is calculated using 1-second bins in cleaned event files. If a bin has >2000 counts, and if more than 50% of those come from <1% of pixels, then it is considered to be noise-dominated and hence unusable.
| Quadrant | # 1 sec bins | Bins with >0 counts | Bins with >2000 counts | High rate bins dominated by noise | Noise dominated (total time) | Noise dominated (detector-on time) | Marked lightcurve |
|---|---|---|---|---|---|---|---|
| A | 7290 | 5709 | 52 | 52 | 0.71% | 0.91% | 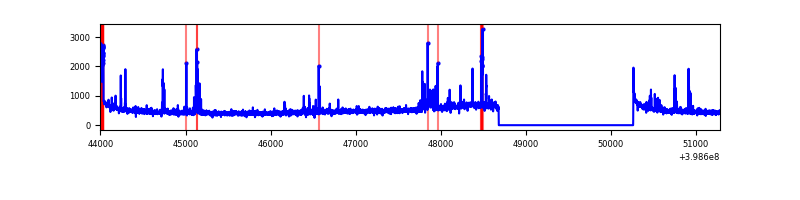 |
| B | 7290 | 5709 | 61 | 61 | 0.84% | 1.07% | 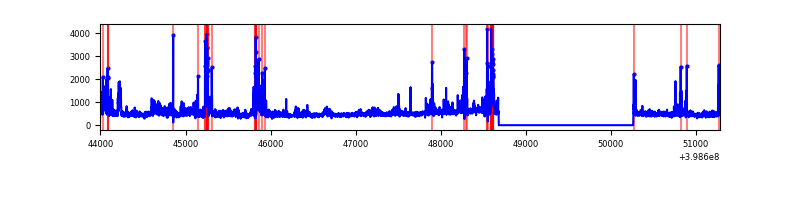 |
| C | 7290 | 5709 | 53 | 53 | 0.73% | 0.93% | 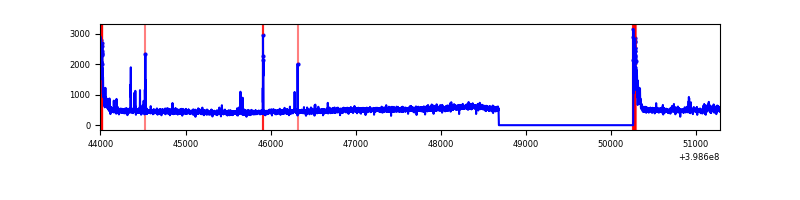 |
| D | 7290 | 5709 | 106 | 106 | 1.45% | 1.86% | 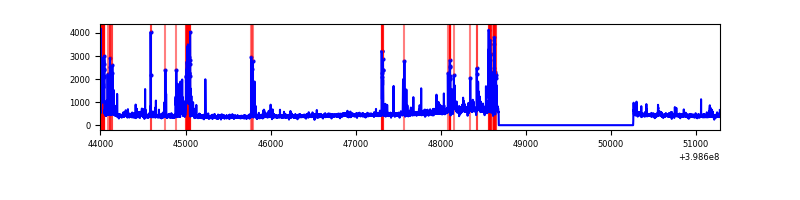 |
Top three noisy pixels from each quadrant. If the there are fewer than three noisy pixels in the level2.evt file, extra rows are filled as -1
| Pixel properties | Quadrant properties | ||||||
|---|---|---|---|---|---|---|---|
| Quadrant | DetID | PixID | Counts | Sigma | Mean | Median | Sigma |
| A | 10 | 83 | 269602 | 2039.58 | 649 | 637 | 131.9 |
| A | 15 | 237 | 129062 | 973.86 | 649 | 637 | 131.9 |
| A | 13 | 248 | 90969 | 685.0 | 649 | 637 | 131.9 |
| B | 5 | 172 | 298645 | 2439.17 | 636 | 620 | 122.2 |
| B | 0 | 213 | 298093 | 2434.65 | 636 | 620 | 122.2 |
| B | 0 | 190 | 64979 | 526.74 | 636 | 620 | 122.2 |
| C | 15 | 214 | 242220 | 1645.68 | 630 | 635 | 146.8 |
| C | 0 | 10 | 183629 | 1246.56 | 630 | 635 | 146.8 |
| C | 14 | 254 | 80820 | 546.22 | 630 | 635 | 146.8 |
| D | 2 | 153 | 208330 | 1321.47 | 630 | 614 | 157.2 |
| D | 12 | 218 | 132586 | 839.59 | 630 | 614 | 157.2 |
| D | 13 | 249 | 82184 | 518.94 | 630 | 614 | 157.2 |
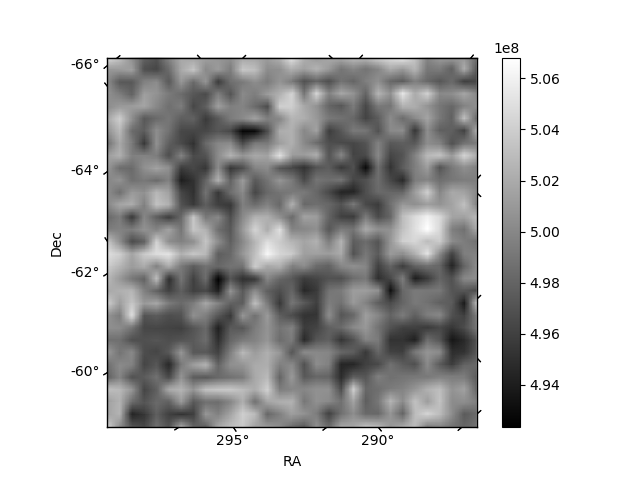
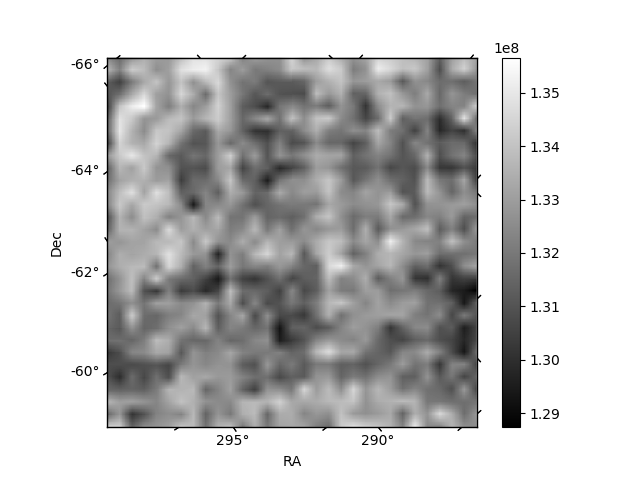
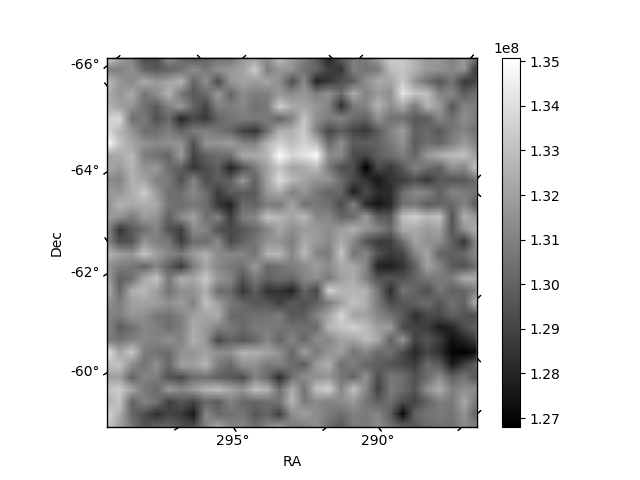
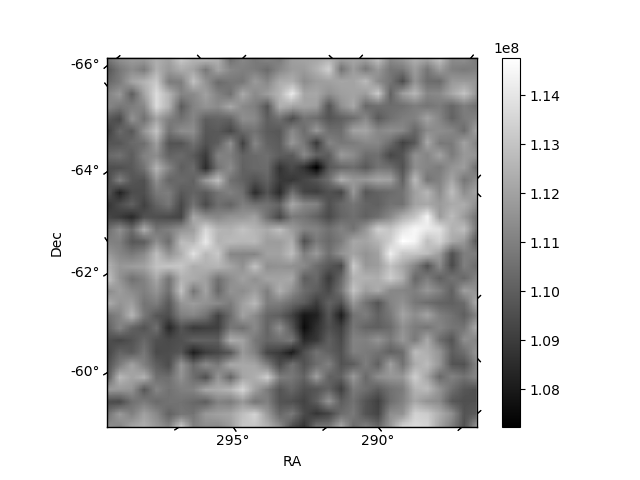
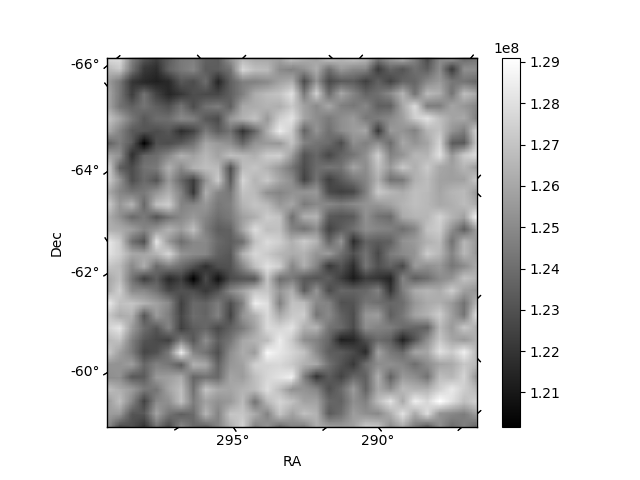
Histogram calculated using DETX and DETY for each event in the final _common_clean file
| Quadrant A | 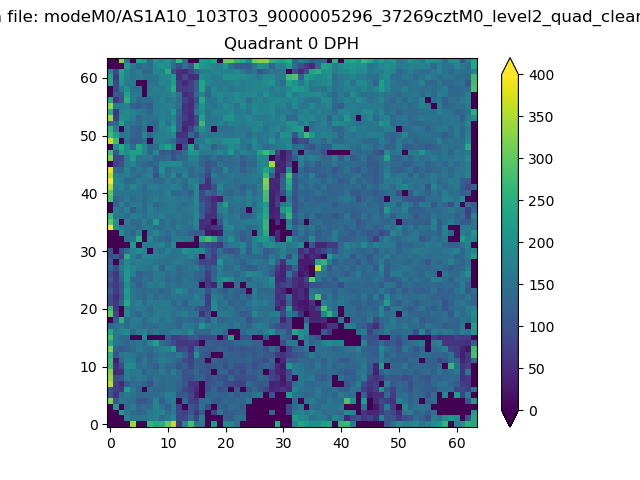 |
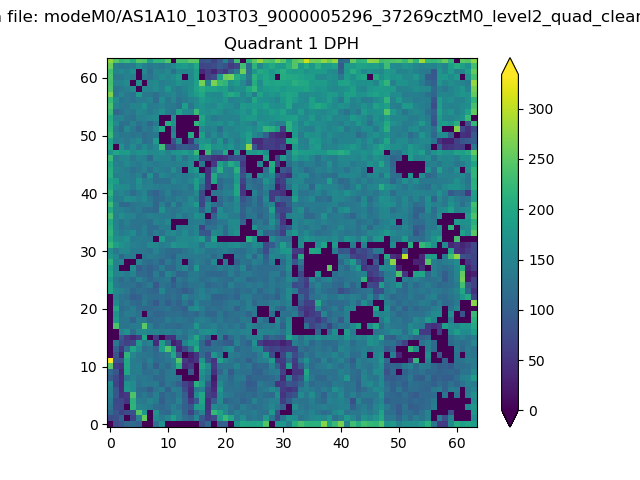 |
Quadrant B |
|---|---|---|---|
| Quadrant D | 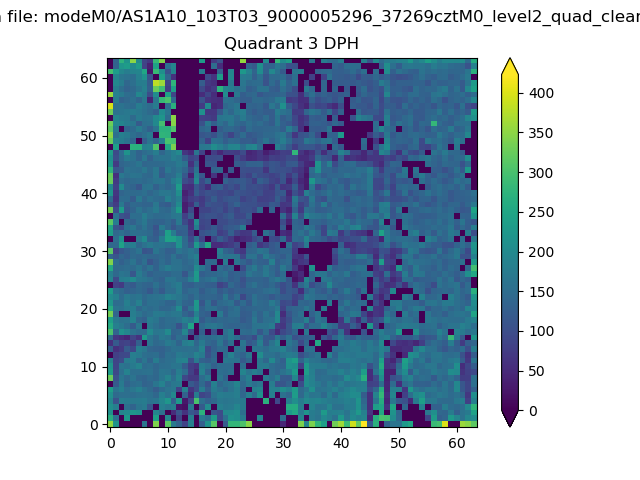 |
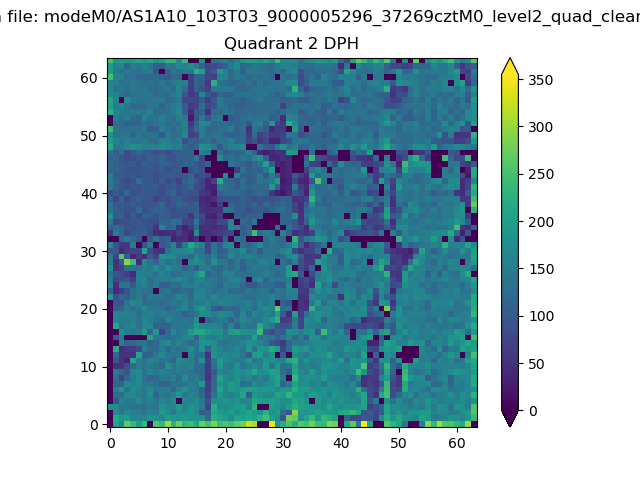 |
Quadrant C |
| Plot type | Count rate plots | Images |
|---|---|---|
| Comparison with Poisson distribution Blue bars denote a histogram of data divided into 1 sec bins. Red curve is a Poisson curve with rate = median count rate of data. |
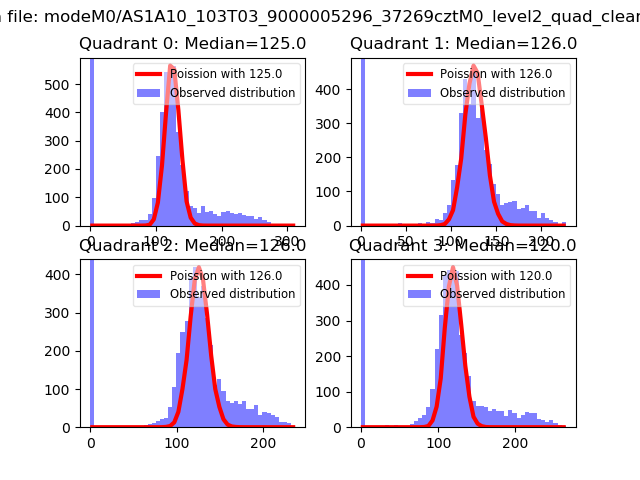 |
 |
| Quadrant-wise count rates Data is divided into 100 sec bins |
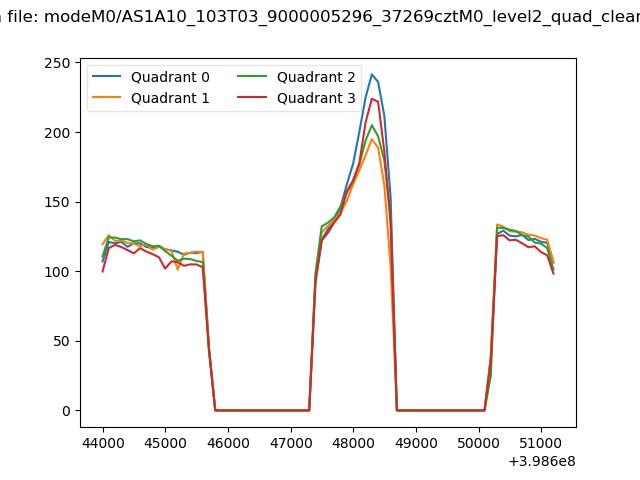 |
|
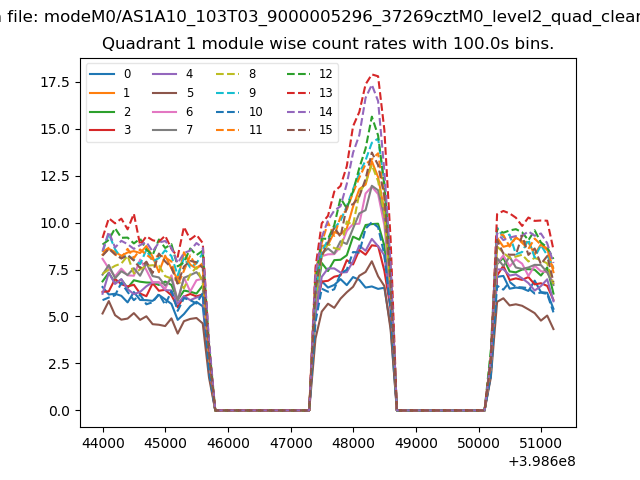
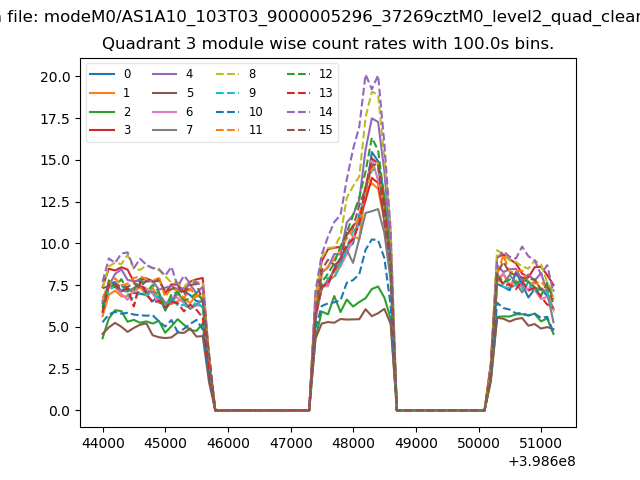
| Module-wise count rates for Quadrant A Data is divided into 100 sec bins |
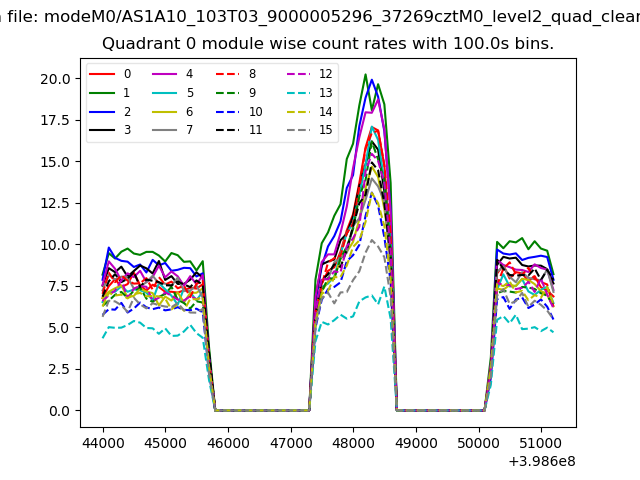 |
 |
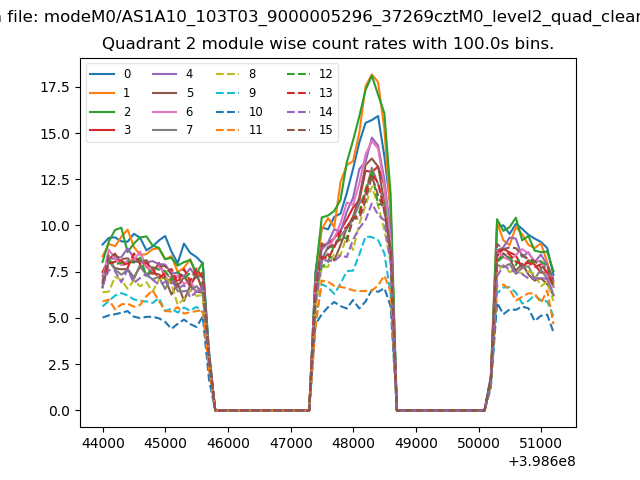
| Module-wise count rates for Quadrant B Data is divided into 100 sec bins |
 |
 |
| Module-wise count rates for Quadrant C Data is divided into 100 sec bins |
 |
 |
| Module-wise count rates for Quadrant D Data is divided into 100 sec bins |
 |
 |
| Parameter | Plot |
|---|---|
| CZT HV Monitor | 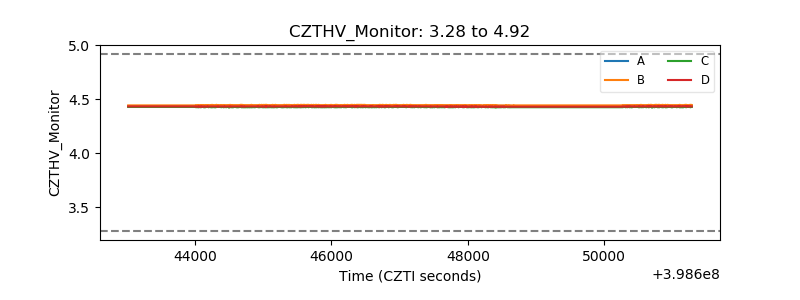 |
| D_VDD | 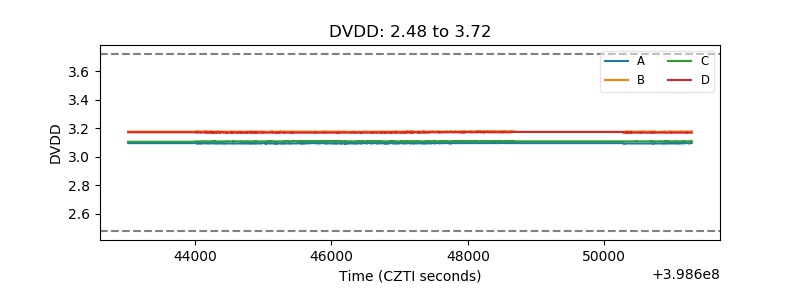 |
| Temperature 1 | 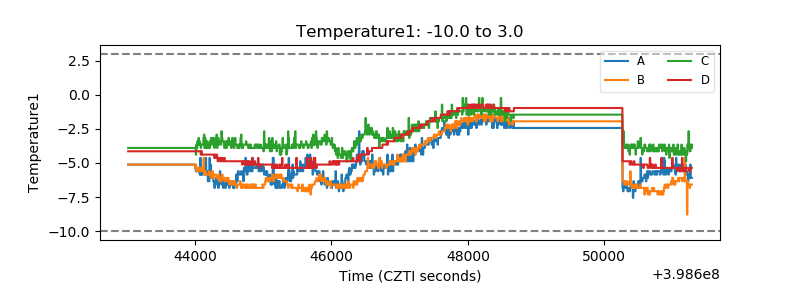 |
| Veto HV Monitor | 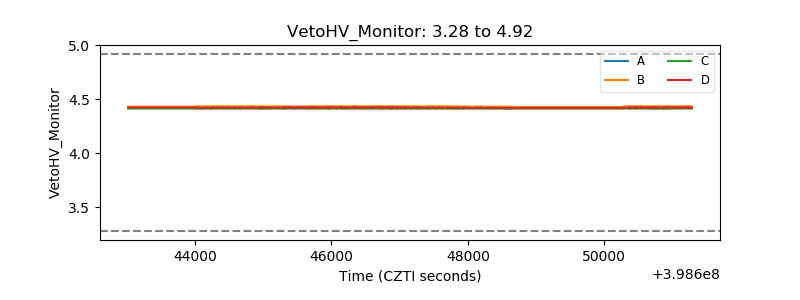 |
| Veto LLD | 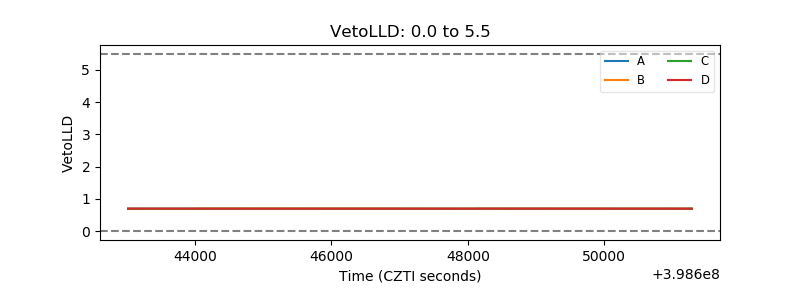 |
| Alpha Counter | 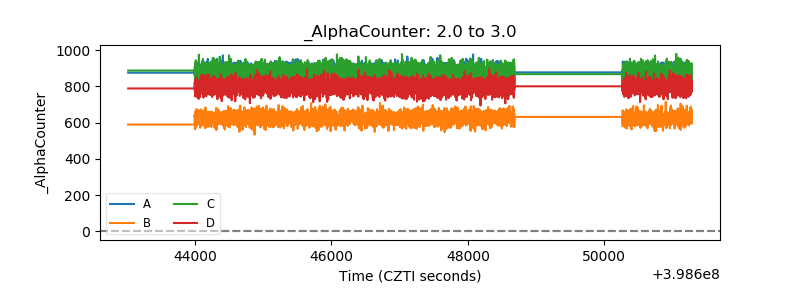 |
| _CPM_Rate | 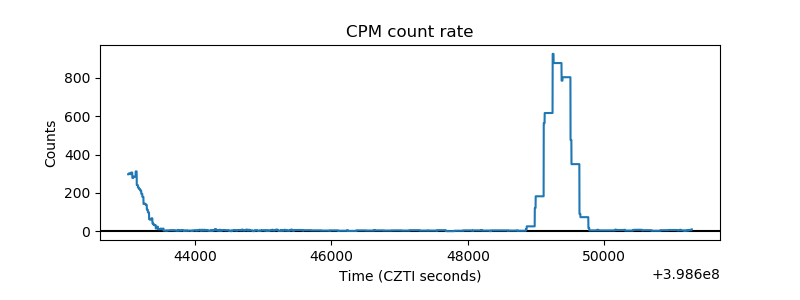 |
| CZT Counter |  |
| +2.5 Volts monitor | 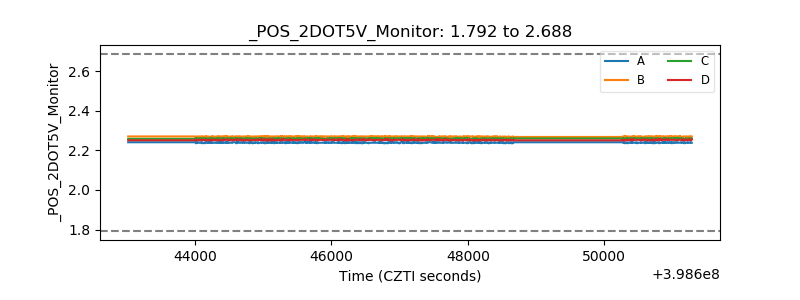 |
| +5 Volts monitor | 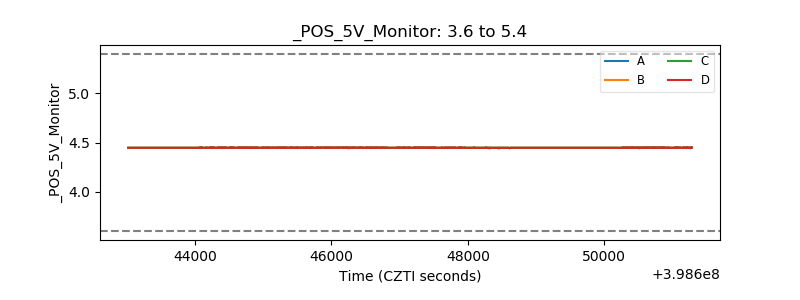 |
| _ROLL_ROT | 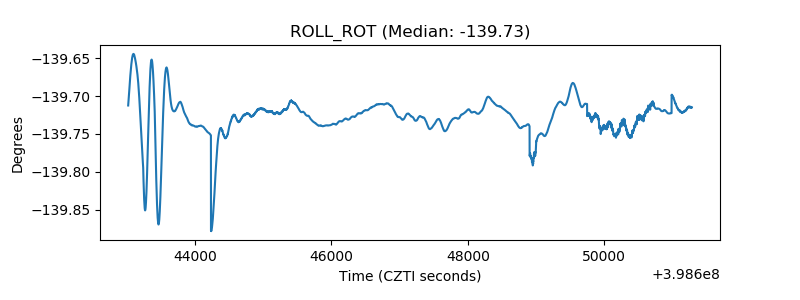 |
| _Roll_DEC | 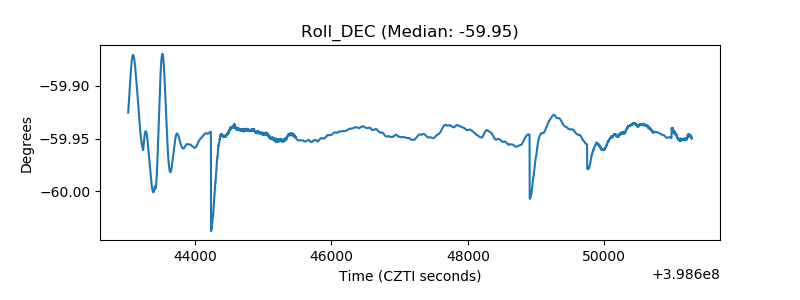 |
| _Roll_RA | 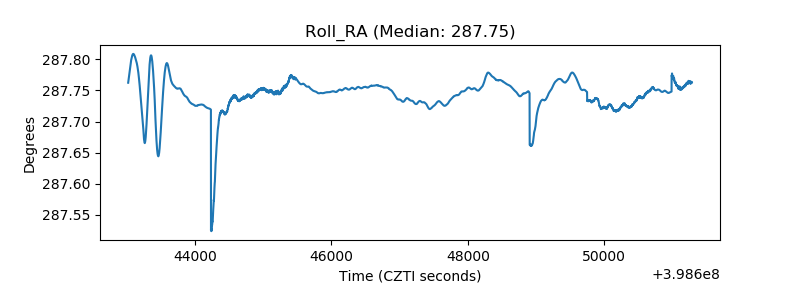 |
| Veto Counter | 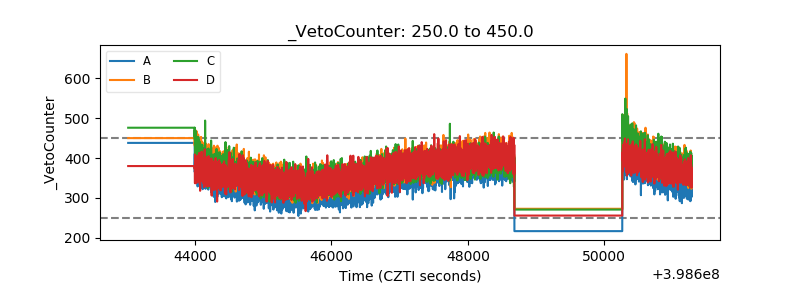 |