| Param | Original file | Final file |
|---|---|---|
| Filename | modeM0/AS1A10_103T03_9000005296_37270cztM0_level2.evt | modeM0/AS1A10_103T03_9000005296_37270cztM0_level2_quad_clean.evt |
| Size (bytes) | 471,525,120 | 79,951,680 |
| Size | 449.7 MB | 76.2 MB |
| Events in quadrant A | 3,025,688 | 516,645 |
| Events in quadrant B | 3,798,142 | 505,088 |
| Events in quadrant C | 3,683,909 | 511,857 |
| Events in quadrant D | 3,379,242 | 482,547 |
| Mode M0 | |||
|---|---|---|---|
| Quadrant | BADHDUFLAG | Total packets | Discarded packets |
| A | 0 | 12749 | 3 |
| B | 0 | 15105 | 2 |
| C | 0 | 14413 | 2 |
| D | 0 | 14234 | 2 |
| Mode SS | |||
|---|---|---|---|
| Quadrant | BADHDUFLAG | Total packets | Discarded packets |
| A | 0 | 120 | 0 |
| B | 0 | 120 | 0 |
| C | 0 | 120 | 0 |
| D | 0 | 120 | 0 |
| Mode M9 | |||
|---|---|---|---|
| Quadrant | BADHDUFLAG | Total packets | Discarded packets |
| A | 0 | 33 | 0 |
| B | 0 | 33 | 0 |
| C | 0 | 33 | 0 |
| D | 0 | 33 | 0 |
| Quadrant | Total seconds | Saturated seconds | Saturation percentage |
|---|---|---|---|
| A | 5789 | 38 | 0.656417% |
| B | 5789 | 281 | 4.854034% |
| C | 5789 | 174 | 3.005700% |
| D | 5789 | 222 | 3.834859% |
Noise dominated data is calculated using 1-second bins in cleaned event files. If a bin has >2000 counts, and if more than 50% of those come from <1% of pixels, then it is considered to be noise-dominated and hence unusable.
| Quadrant | # 1 sec bins | Bins with >0 counts | Bins with >2000 counts | High rate bins dominated by noise | Noise dominated (total time) | Noise dominated (detector-on time) | Marked lightcurve |
|---|---|---|---|---|---|---|---|
| A | 9073 | 5791 | 23 | 23 | 0.25% | 0.40% | 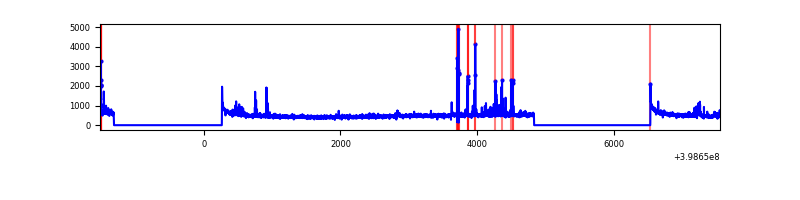 |
| B | 9073 | 5791 | 188 | 188 | 2.07% | 3.25% | 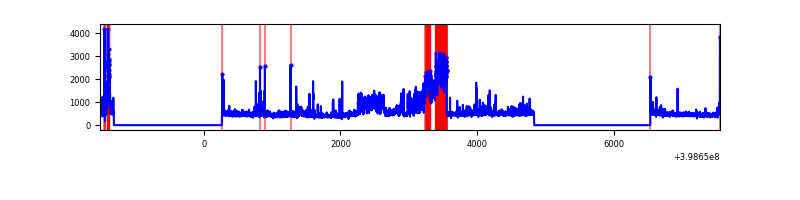 |
| C | 9073 | 5791 | 160 | 160 | 1.76% | 2.76% | 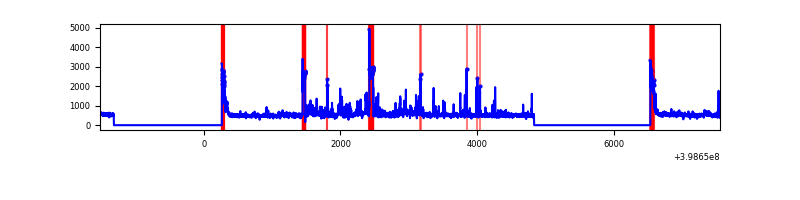 |
| D | 9073 | 5791 | 155 | 155 | 1.71% | 2.68% | 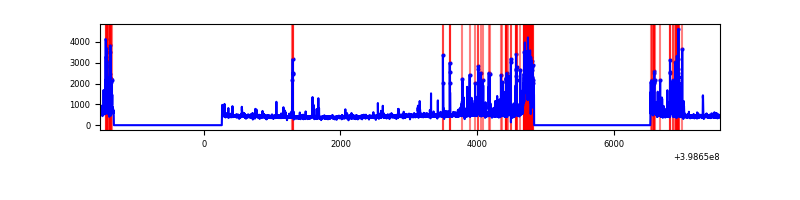 |
Top three noisy pixels from each quadrant. If the there are fewer than three noisy pixels in the level2.evt file, extra rows are filled as -1
| Pixel properties | Quadrant properties | ||||||
|---|---|---|---|---|---|---|---|
| Quadrant | DetID | PixID | Counts | Sigma | Mean | Median | Sigma |
| A | 10 | 83 | 281576 | 2138.74 | 654 | 643 | 131.4 |
| A | 15 | 237 | 79490 | 600.26 | 654 | 643 | 131.4 |
| A | 13 | 248 | 61763 | 465.31 | 654 | 643 | 131.4 |
| B | 5 | 184 | 890855 | 7362.1 | 642 | 626 | 120.9 |
| B | 5 | 172 | 150165 | 1236.67 | 642 | 626 | 120.9 |
| B | 0 | 213 | 98318 | 807.9 | 642 | 626 | 120.9 |
| C | 14 | 254 | 392932 | 2672.83 | 634 | 638 | 146.8 |
| C | 1 | 23 | 331344 | 2253.21 | 634 | 638 | 146.8 |
| C | 15 | 214 | 241273 | 1639.53 | 634 | 638 | 146.8 |
| D | 13 | 249 | 303192 | 1981.85 | 632 | 615 | 152.7 |
| D | 2 | 249 | 256765 | 1677.75 | 632 | 615 | 152.7 |
| D | 12 | 218 | 111654 | 727.29 | 632 | 615 | 152.7 |
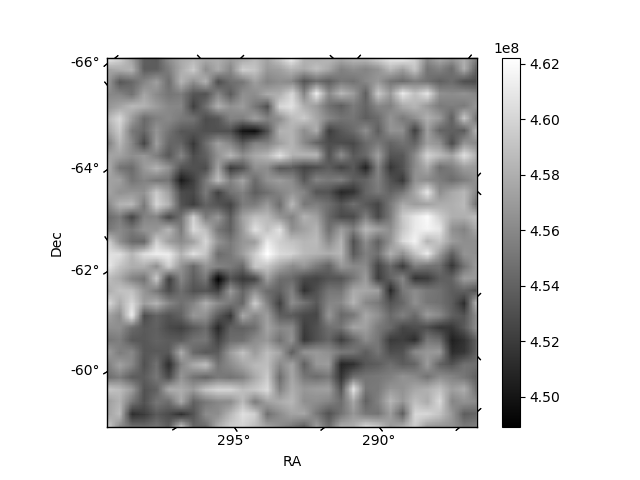
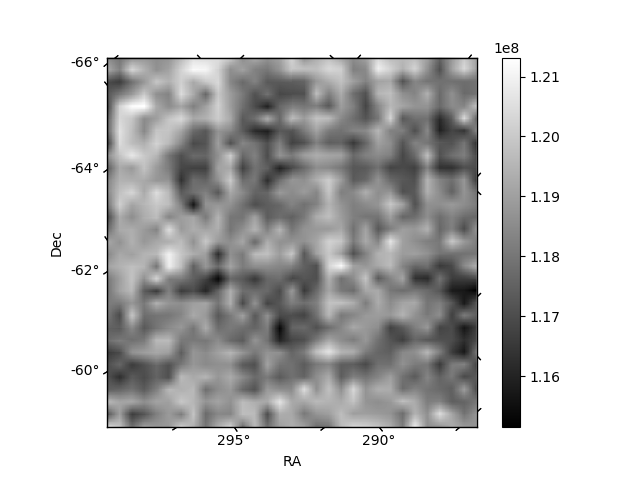
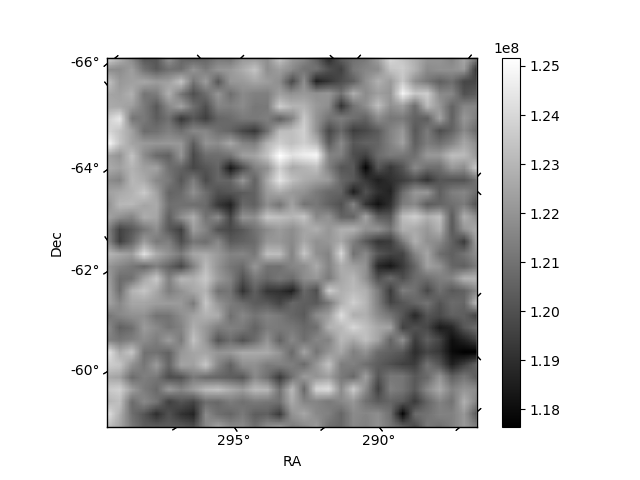
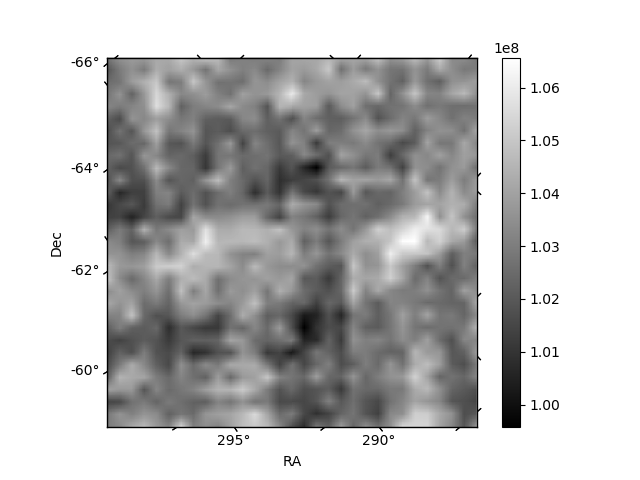
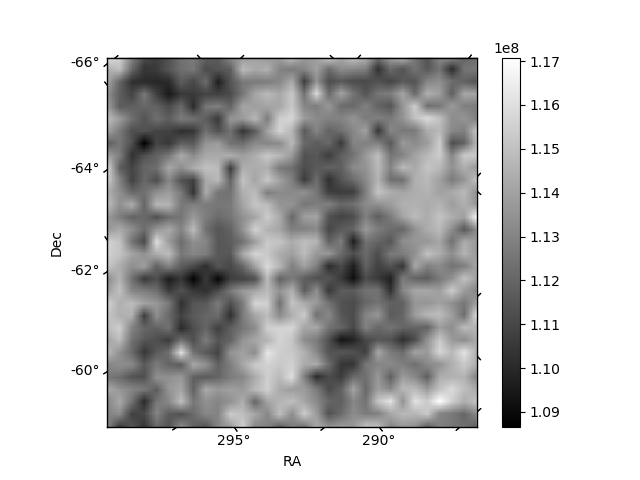
Histogram calculated using DETX and DETY for each event in the final _common_clean file
| Quadrant A | 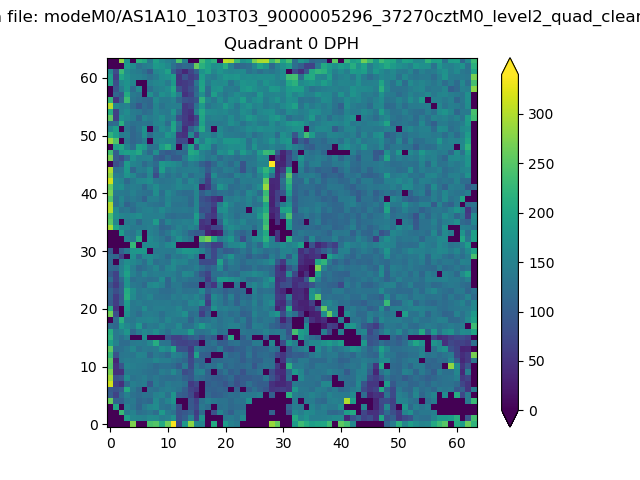 |
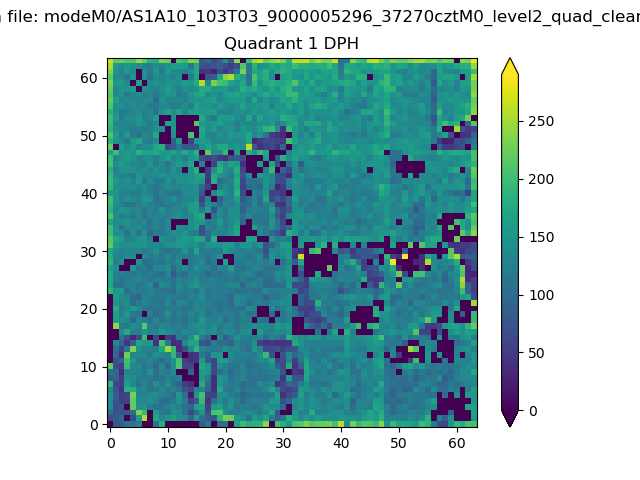 |
Quadrant B |
|---|---|---|---|
| Quadrant D | 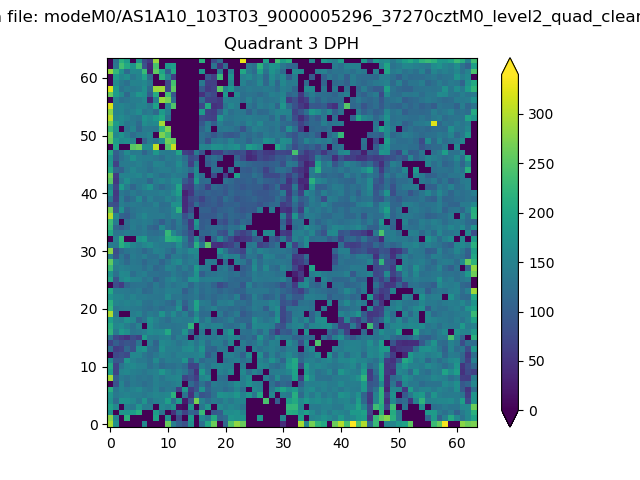 |
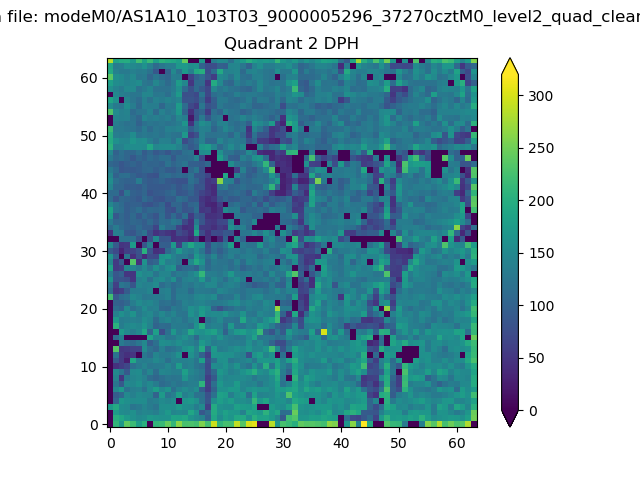 |
Quadrant C |
| Plot type | Count rate plots | Images |
|---|---|---|
| Comparison with Poisson distribution Blue bars denote a histogram of data divided into 1 sec bins. Red curve is a Poisson curve with rate = median count rate of data. |
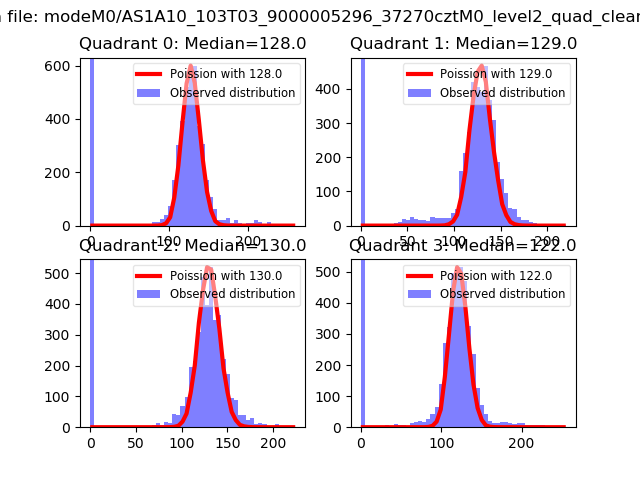 |
 |
| Quadrant-wise count rates Data is divided into 100 sec bins |
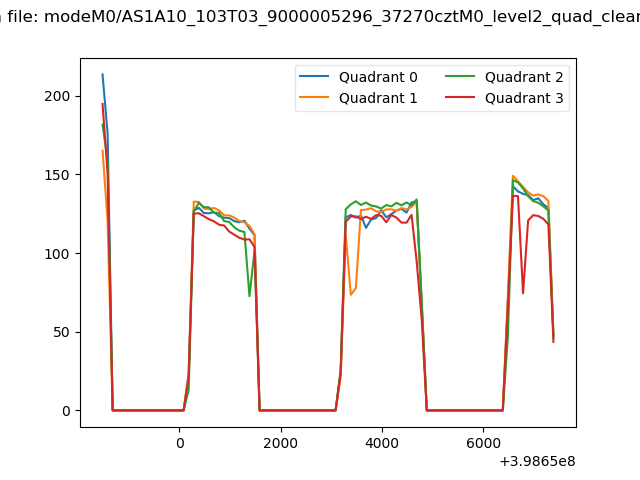 |
|
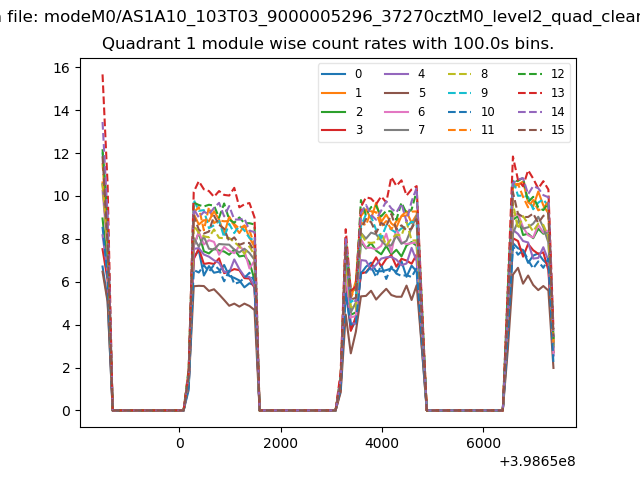
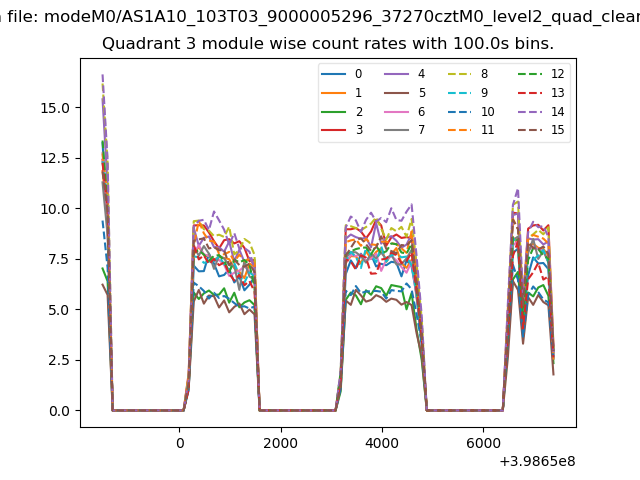
| Module-wise count rates for Quadrant A Data is divided into 100 sec bins |
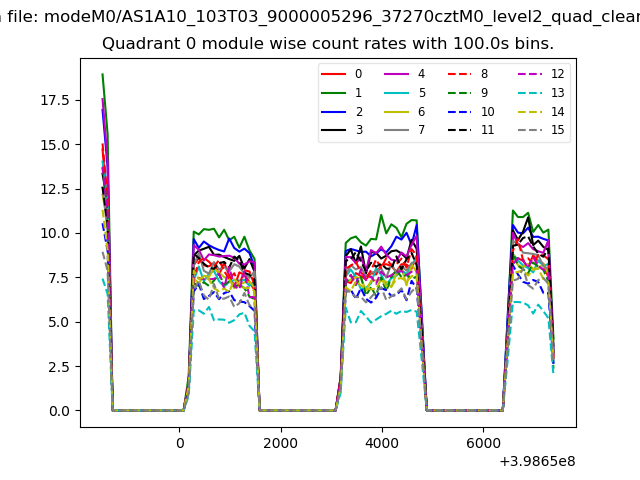 |
 |
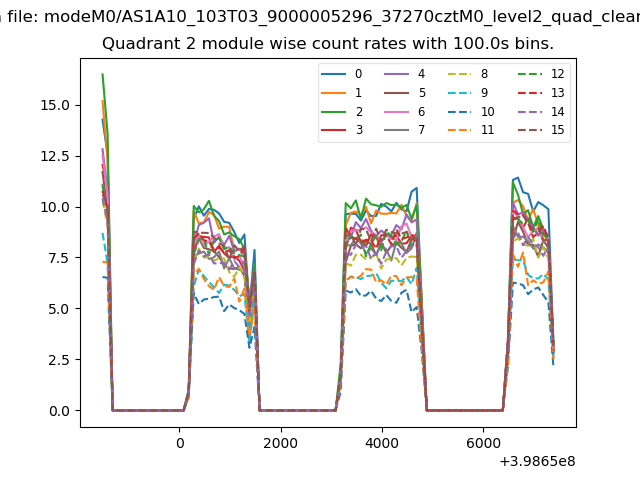
| Module-wise count rates for Quadrant B Data is divided into 100 sec bins |
 |
 |
| Module-wise count rates for Quadrant C Data is divided into 100 sec bins |
 |
 |
| Module-wise count rates for Quadrant D Data is divided into 100 sec bins |
 |
 |
| Parameter | Plot |
|---|---|
| CZT HV Monitor | 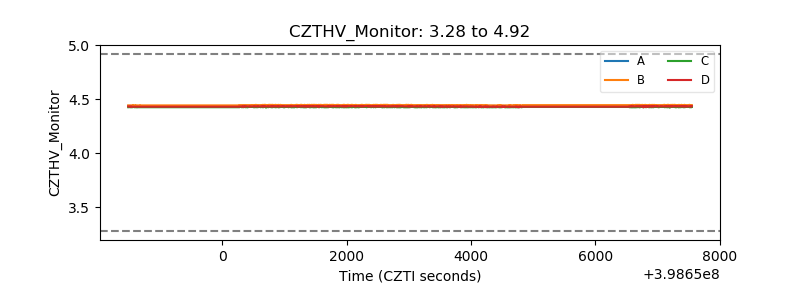 |
| D_VDD | 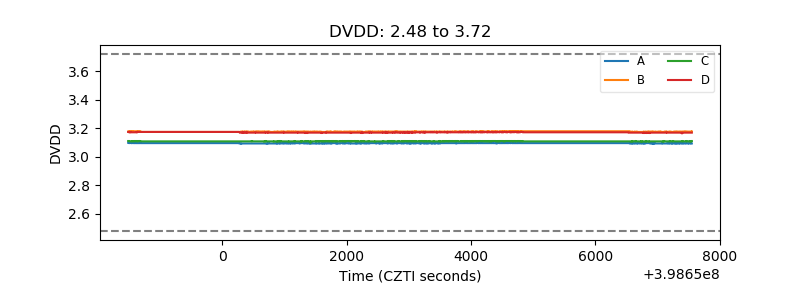 |
| Temperature 1 | 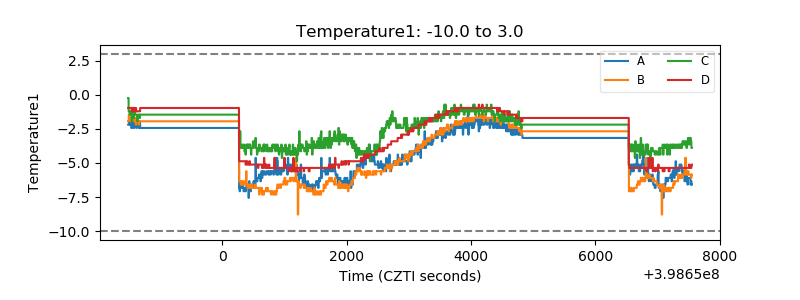 |
| Veto HV Monitor | 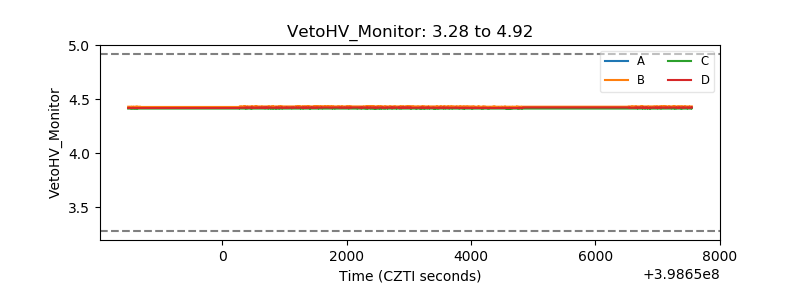 |
| Veto LLD | 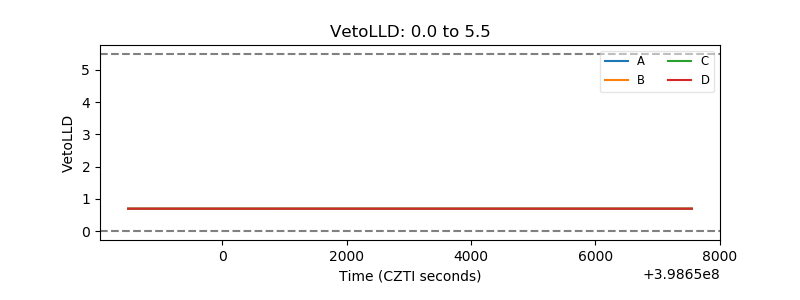 |
| Alpha Counter | 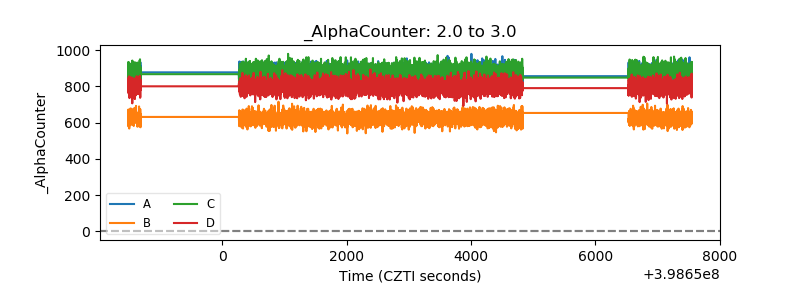 |
| _CPM_Rate | 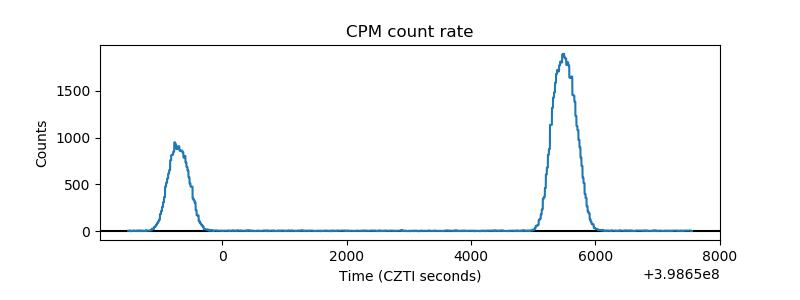 |
| CZT Counter | 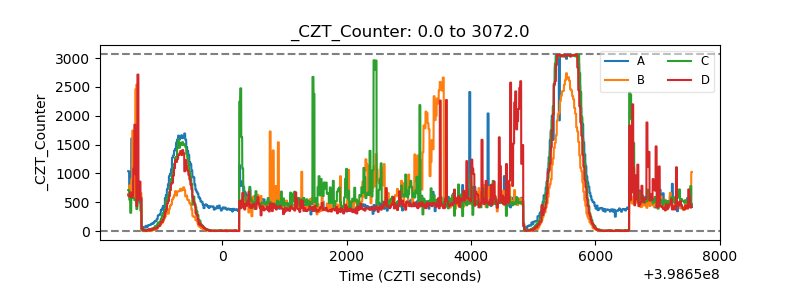 |
| +2.5 Volts monitor | 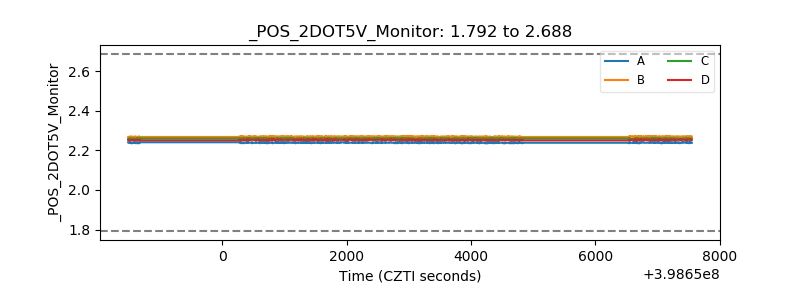 |
| +5 Volts monitor | 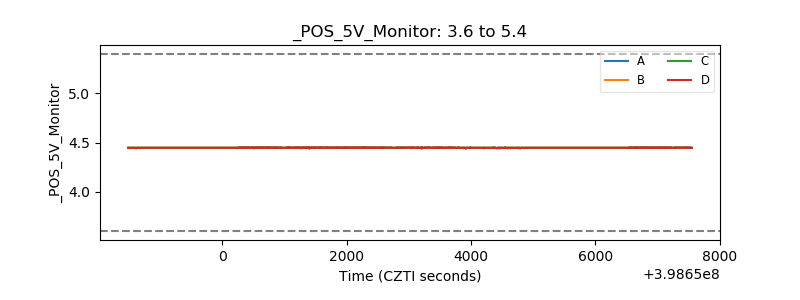 |
| _ROLL_ROT | 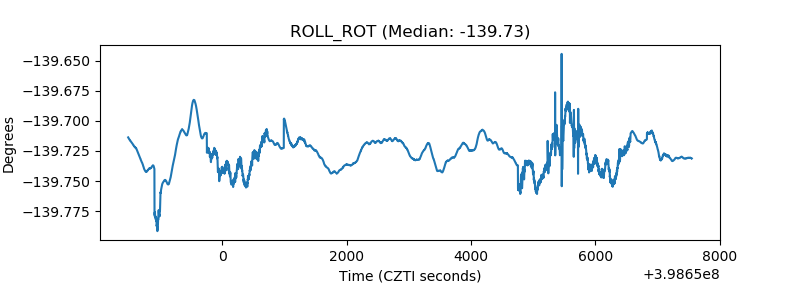 |
| _Roll_DEC | 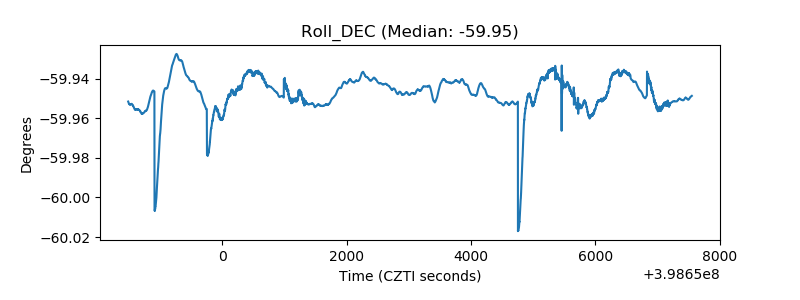 |
| _Roll_RA | 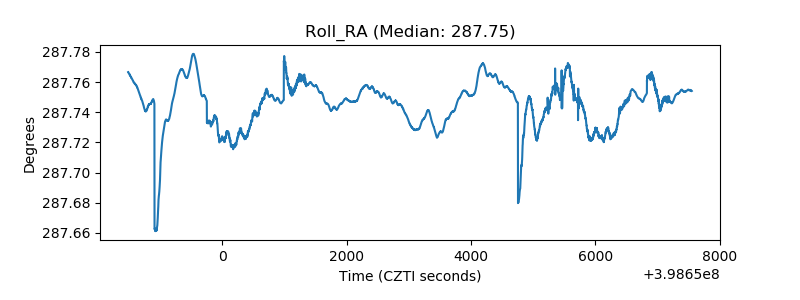 |
| Veto Counter | 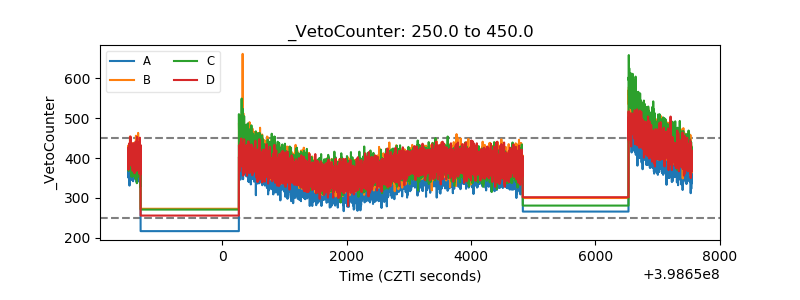 |