| Param | Original file | Final file |
|---|---|---|
| Filename | modeM0/AS1A10_103T03_9000005296_37272cztM0_level2.evt | modeM0/AS1A10_103T03_9000005296_37272cztM0_level2_quad_clean.evt |
| Size (bytes) | 429,143,040 | 67,155,840 |
| Size | 409.3 MB | 64.0 MB |
| Events in quadrant A | 3,236,048 | 410,632 |
| Events in quadrant B | 2,738,729 | 433,241 |
| Events in quadrant C | 2,878,869 | 434,019 |
| Events in quadrant D | 3,788,390 | 389,697 |
| Mode M0 | |||
|---|---|---|---|
| Quadrant | BADHDUFLAG | Total packets | Discarded packets |
| A | 0 | 12901 | 3 |
| B | 0 | 11430 | 2 |
| C | 0 | 11594 | 2 |
| D | 0 | 14796 | 2 |
| Mode SS | |||
|---|---|---|---|
| Quadrant | BADHDUFLAG | Total packets | Discarded packets |
| A | 0 | 106 | 0 |
| B | 0 | 106 | 0 |
| C | 0 | 106 | 0 |
| D | 0 | 106 | 0 |
| Mode M9 | |||
|---|---|---|---|
| Quadrant | BADHDUFLAG | Total packets | Discarded packets |
| A | 0 | 23 | 0 |
| B | 0 | 23 | 0 |
| C | 0 | 23 | 0 |
| D | 0 | 24 | 0 |
| Quadrant | Total seconds | Saturated seconds | Saturation percentage |
|---|---|---|---|
| A | 5218 | 223 | 4.273668% |
| B | 5218 | 52 | 0.996550% |
| C | 5218 | 61 | 1.169030% |
| D | 5218 | 398 | 7.627443% |
Noise dominated data is calculated using 1-second bins in cleaned event files. If a bin has >2000 counts, and if more than 50% of those come from <1% of pixels, then it is considered to be noise-dominated and hence unusable.
| Quadrant | # 1 sec bins | Bins with >0 counts | Bins with >2000 counts | High rate bins dominated by noise | Noise dominated (total time) | Noise dominated (detector-on time) | Marked lightcurve |
|---|---|---|---|---|---|---|---|
| A | 7070 | 5219 | 157 | 157 | 2.22% | 3.01% | 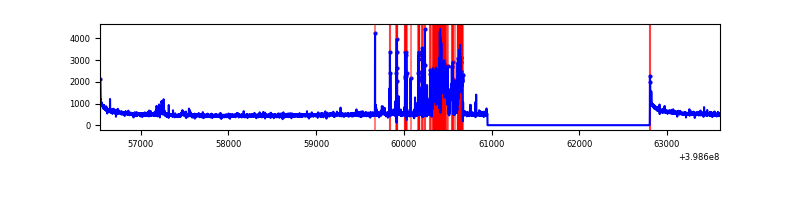 |
| B | 7070 | 5219 | 25 | 25 | 0.35% | 0.48% | 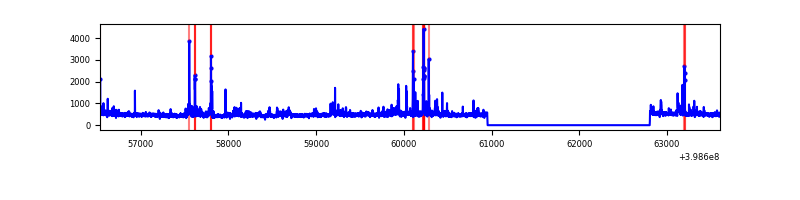 |
| C | 7070 | 5219 | 51 | 51 | 0.72% | 0.98% | 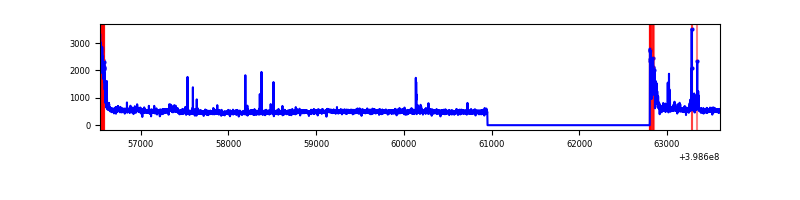 |
| D | 7070 | 5219 | 334 | 334 | 4.72% | 6.40% | 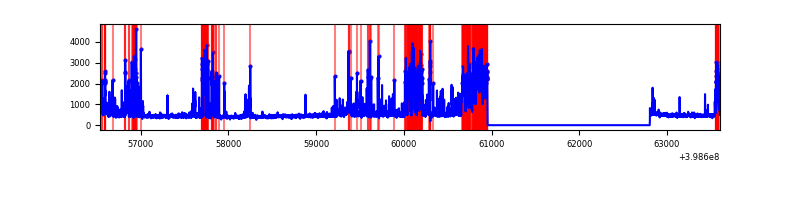 |
Top three noisy pixels from each quadrant. If the there are fewer than three noisy pixels in the level2.evt file, extra rows are filled as -1
| Pixel properties | Quadrant properties | ||||||
|---|---|---|---|---|---|---|---|
| Quadrant | DetID | PixID | Counts | Sigma | Mean | Median | Sigma |
| A | 15 | 237 | 591825 | 4954.05 | 593 | 582 | 119.3 |
| A | 10 | 83 | 261215 | 2183.85 | 593 | 582 | 119.3 |
| A | 9 | 143 | 35254 | 290.52 | 593 | 582 | 119.3 |
| B | 5 | 172 | 154044 | 1350.28 | 603 | 588 | 113.6 |
| B | 0 | 213 | 123551 | 1081.97 | 603 | 588 | 113.6 |
| B | 0 | 190 | 51942 | 451.87 | 603 | 588 | 113.6 |
| C | 15 | 214 | 224938 | 1630.74 | 599 | 603 | 137.6 |
| C | 0 | 10 | 207393 | 1503.2 | 599 | 603 | 137.6 |
| C | 14 | 254 | 109341 | 790.44 | 599 | 603 | 137.6 |
| D | 13 | 249 | 543293 | 3903.32 | 575 | 559 | 139.0 |
| D | 2 | 249 | 358711 | 2575.81 | 575 | 559 | 139.0 |
| D | 10 | 253 | 351986 | 2527.45 | 575 | 559 | 139.0 |
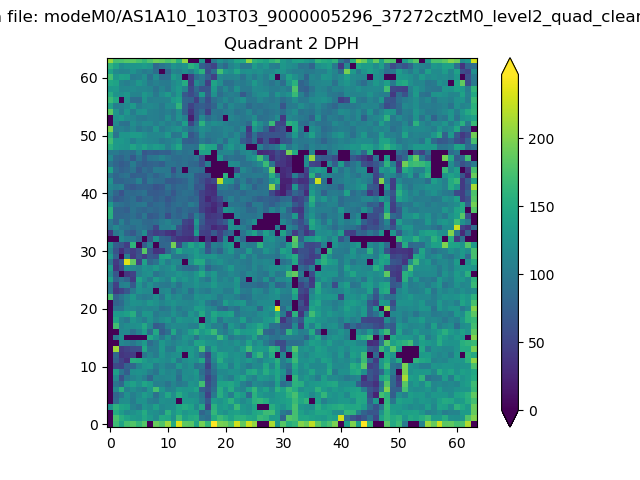
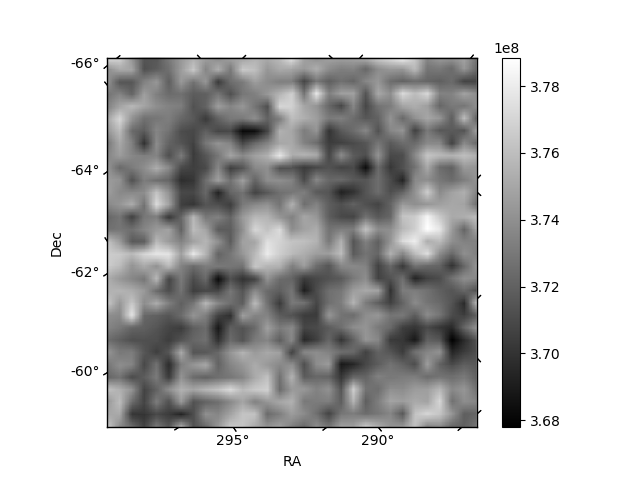
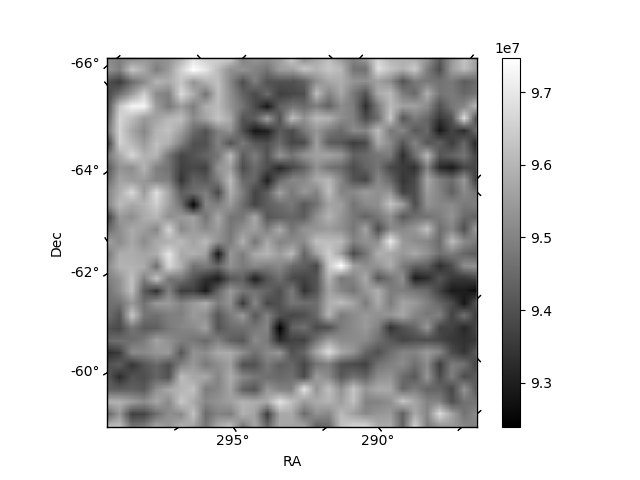
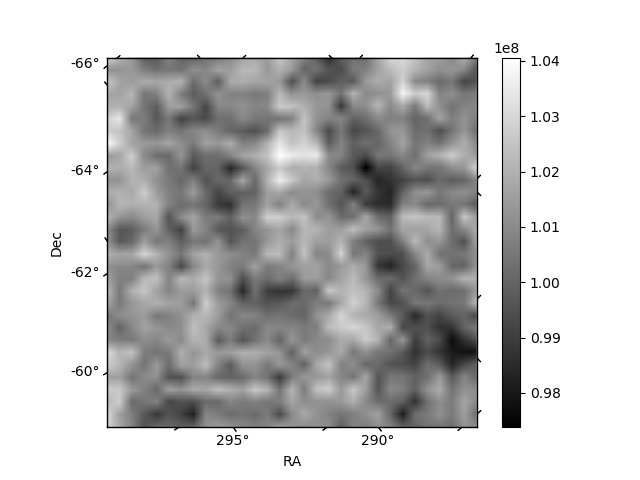
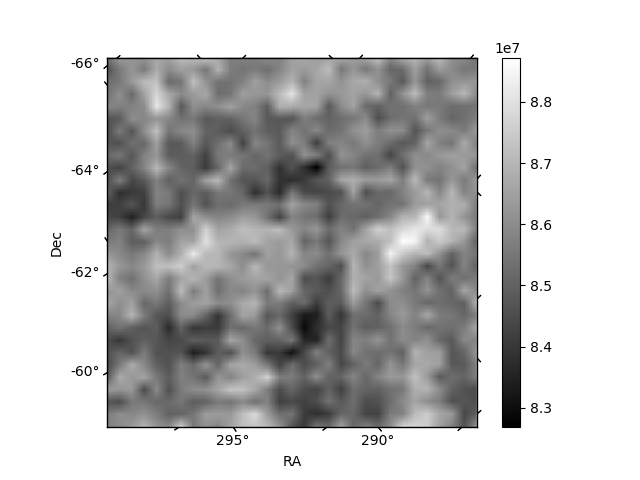
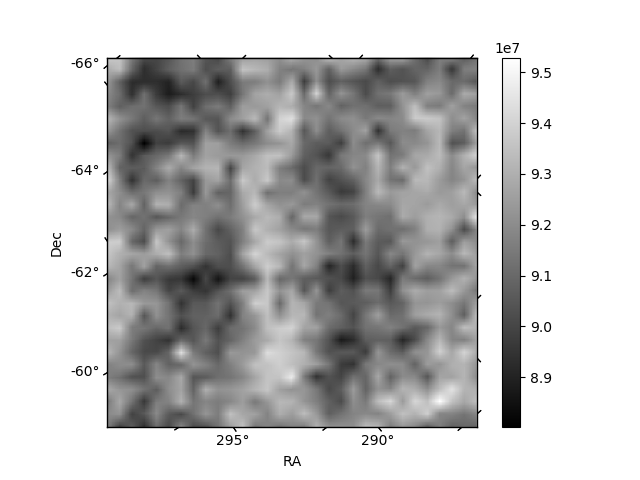
Histogram calculated using DETX and DETY for each event in the final _common_clean file
| Quadrant A | 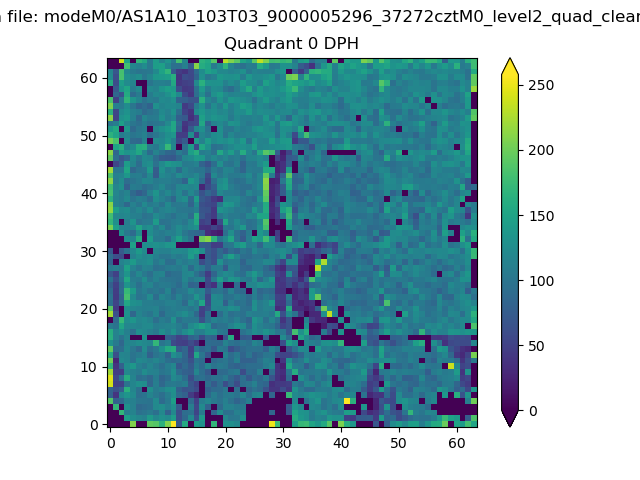 |
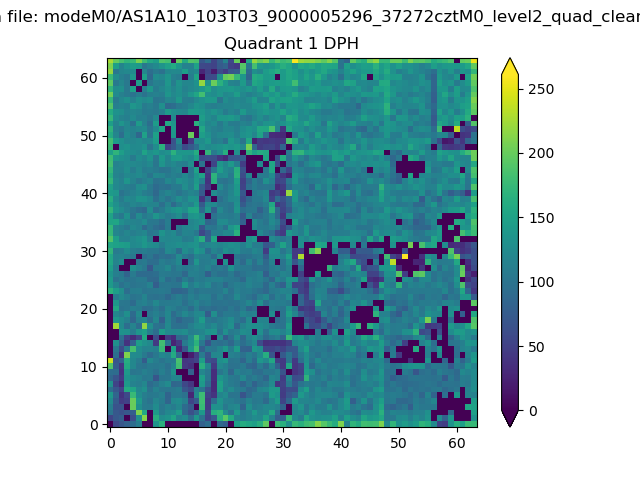 |
Quadrant B |
|---|---|---|---|
| Quadrant D | 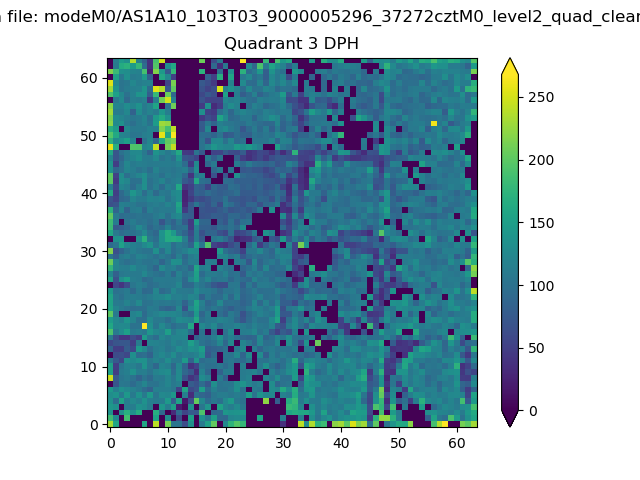 |
 |
Quadrant C |
| Plot type | Count rate plots | Images |
|---|---|---|
| Comparison with Poisson distribution Blue bars denote a histogram of data divided into 1 sec bins. Red curve is a Poisson curve with rate = median count rate of data. |
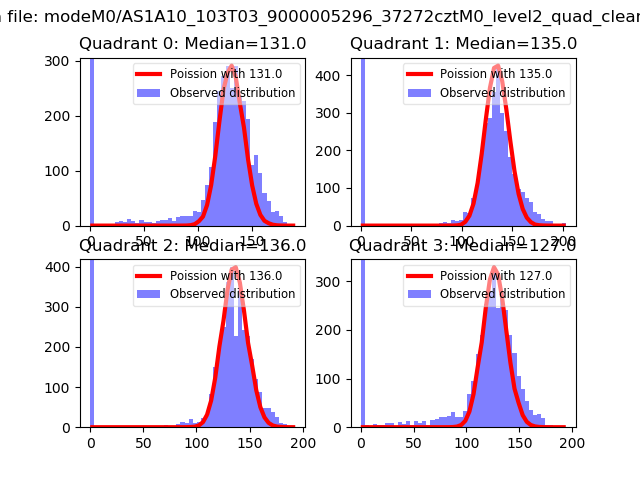 |
 |
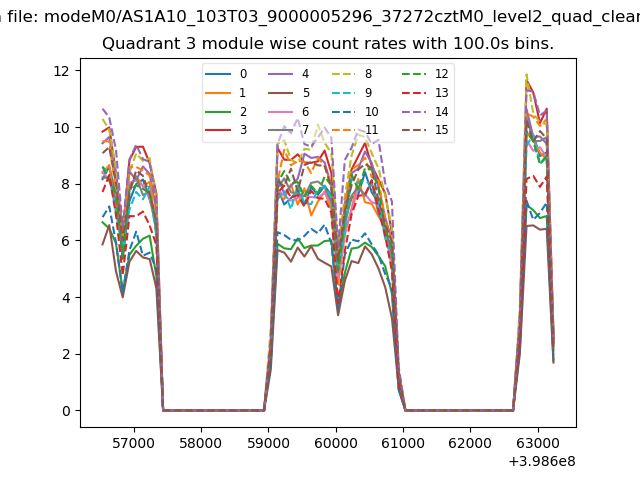
| Quadrant-wise count rates Data is divided into 100 sec bins |
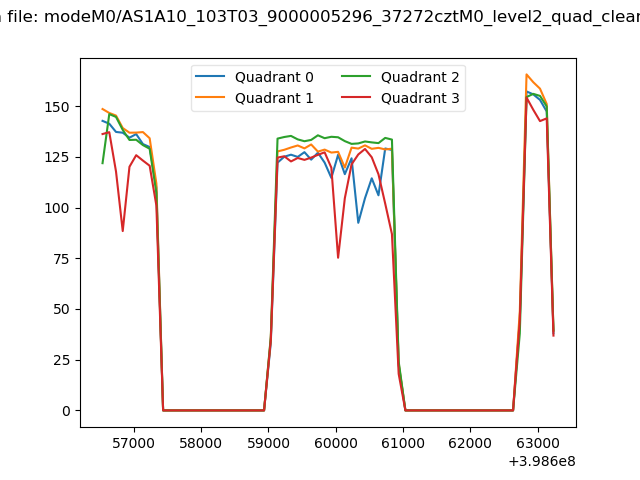 |
|
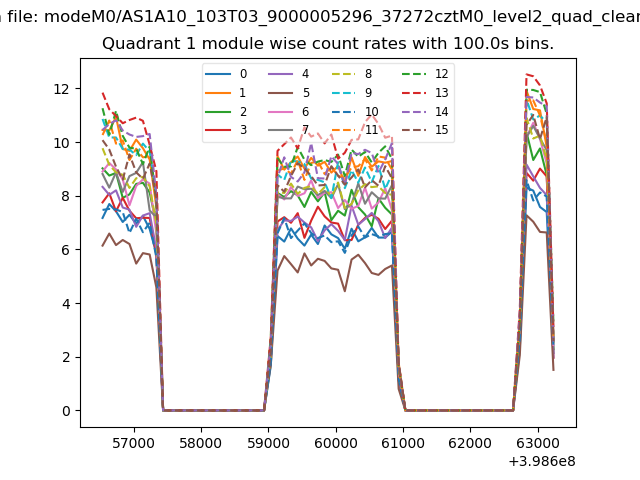
| Module-wise count rates for Quadrant A Data is divided into 100 sec bins |
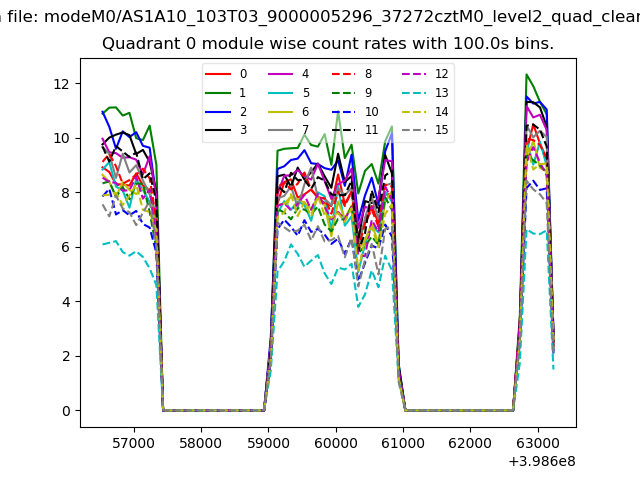 |
 |
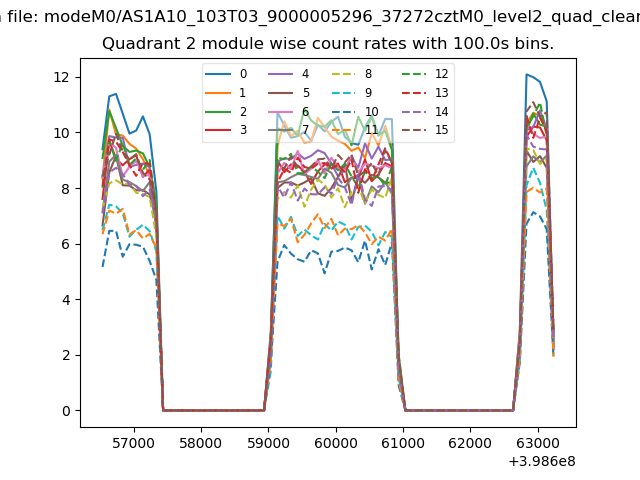
| Module-wise count rates for Quadrant B Data is divided into 100 sec bins |
 |
 |
| Module-wise count rates for Quadrant C Data is divided into 100 sec bins |
 |
 |
| Module-wise count rates for Quadrant D Data is divided into 100 sec bins |
 |
 |
| Parameter | Plot |
|---|---|
| CZT HV Monitor | 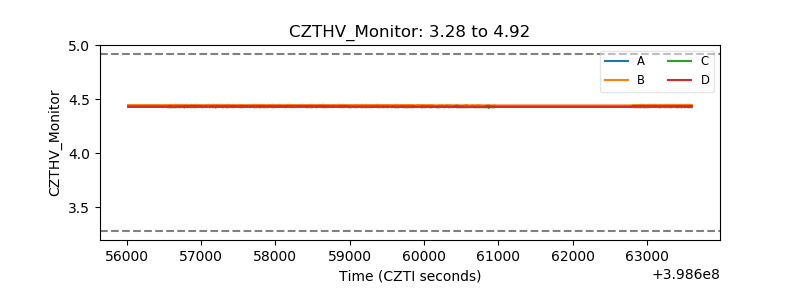 |
| D_VDD | 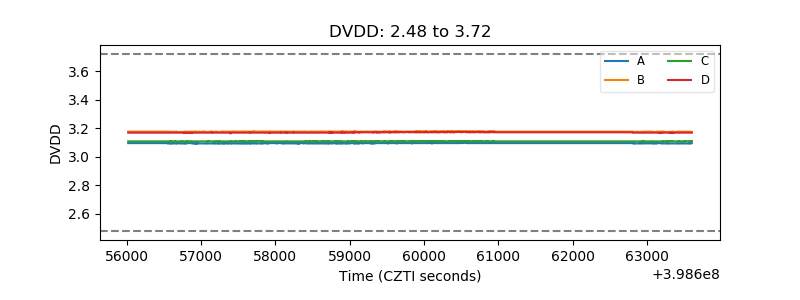 |
| Temperature 1 | 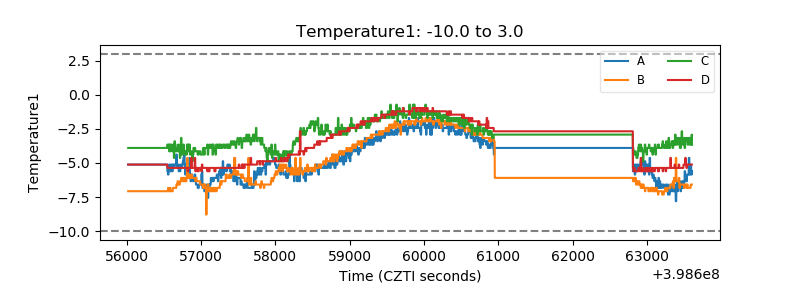 |
| Veto HV Monitor |  |
| Veto LLD | 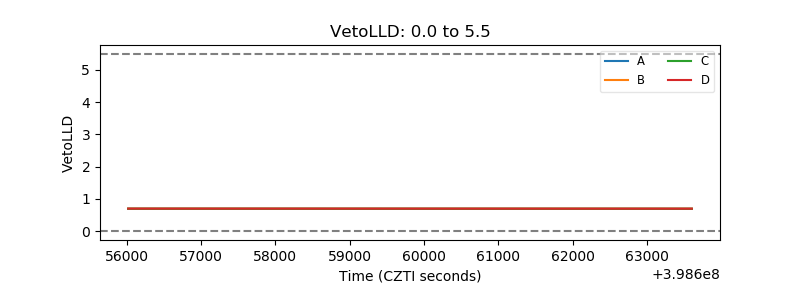 |
| Alpha Counter | 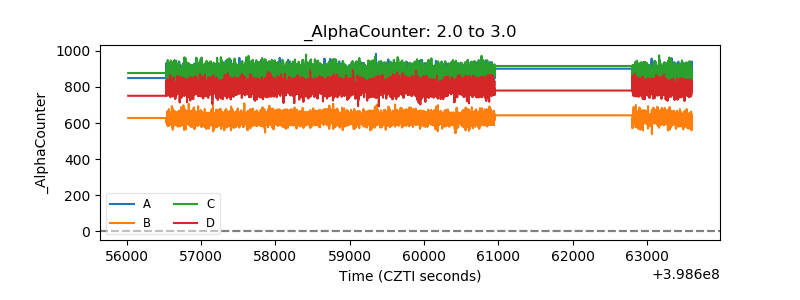 |
| _CPM_Rate | 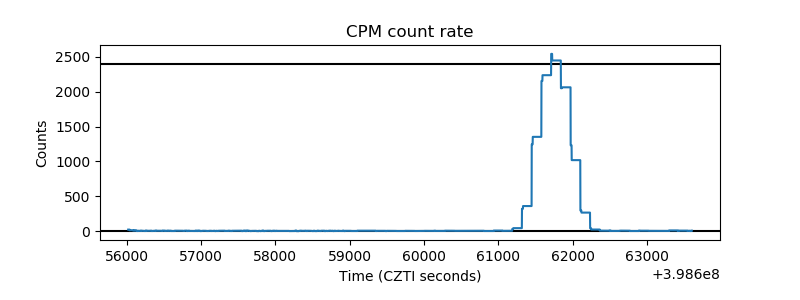 |
| CZT Counter | 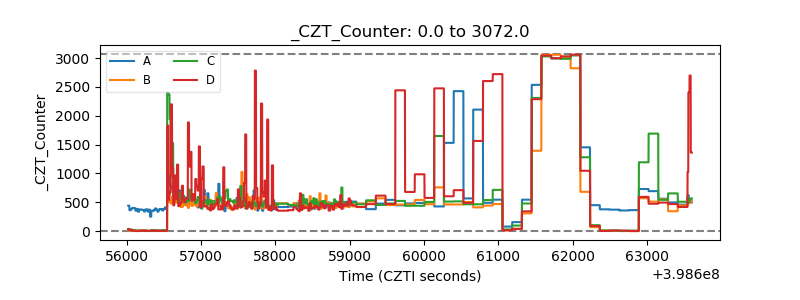 |
| +2.5 Volts monitor | 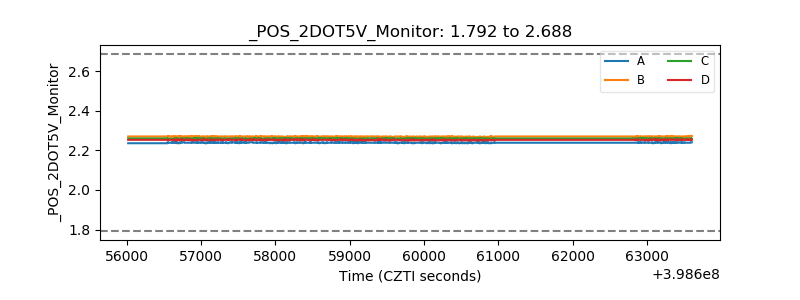 |
| +5 Volts monitor | 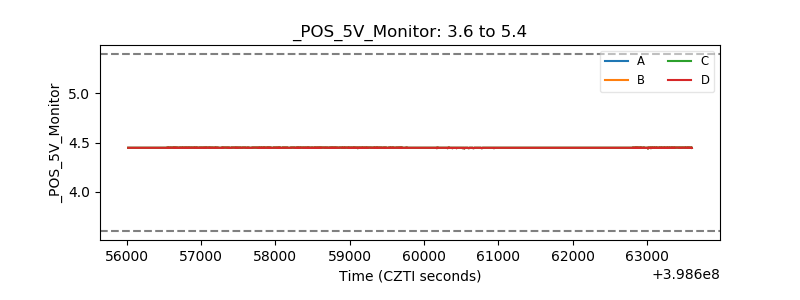 |
| _ROLL_ROT | 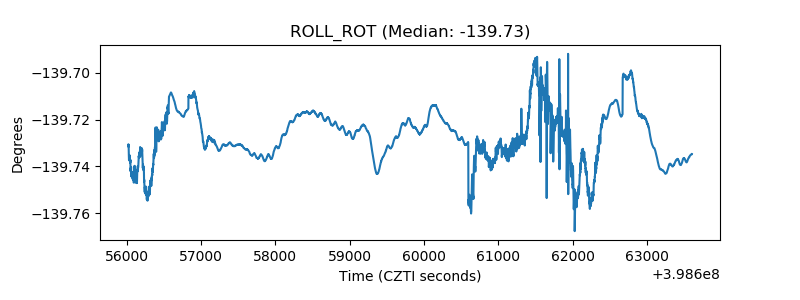 |
| _Roll_DEC | 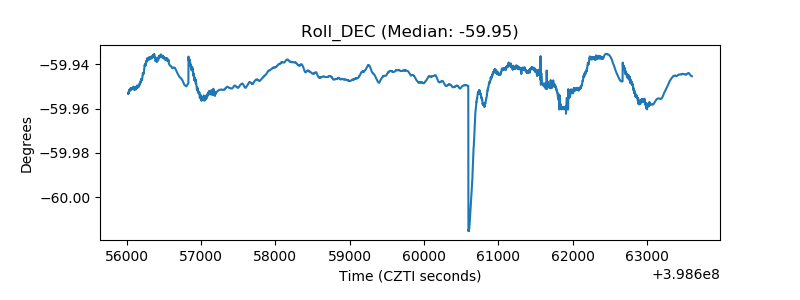 |
| _Roll_RA | 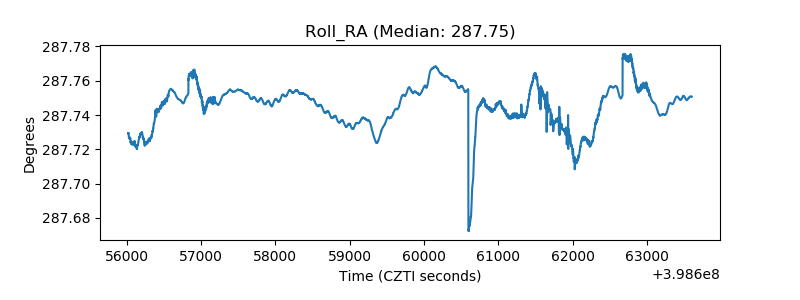 |
| Veto Counter | 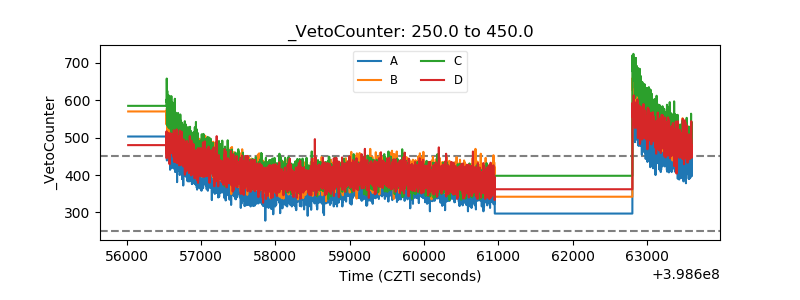 |