| Param | Original file | Final file |
|---|---|---|
| Filename | modeM0/AS1A10_103T03_9000005296_37273cztM0_level2.evt | modeM0/AS1A10_103T03_9000005296_37273cztM0_level2_quad_clean.evt |
| Size (bytes) | 419,060,160 | 59,132,160 |
| Size | 399.6 MB | 56.4 MB |
| Events in quadrant A | 2,747,843 | 357,878 |
| Events in quadrant B | 2,691,295 | 366,355 |
| Events in quadrant C | 3,352,762 | 365,417 |
| Events in quadrant D | 3,551,291 | 341,660 |
| Mode M0 | |||
|---|---|---|---|
| Quadrant | BADHDUFLAG | Total packets | Discarded packets |
| A | 0 | 11185 | 3 |
| B | 0 | 11076 | 2 |
| C | 0 | 12973 | 2 |
| D | 0 | 13828 | 2 |
| Mode SS | |||
|---|---|---|---|
| Quadrant | BADHDUFLAG | Total packets | Discarded packets |
| A | 0 | 104 | 0 |
| B | 0 | 104 | 0 |
| C | 0 | 104 | 0 |
| D | 0 | 104 | 0 |
| Mode M9 | |||
|---|---|---|---|
| Quadrant | BADHDUFLAG | Total packets | Discarded packets |
| A | 0 | 27 | 0 |
| B | 0 | 27 | 0 |
| C | 0 | 27 | 0 |
| D | 0 | 28 | 0 |
| Quadrant | Total seconds | Saturated seconds | Saturation percentage |
|---|---|---|---|
| A | 5122 | 14 | 0.273331% |
| B | 5122 | 23 | 0.449043% |
| C | 5122 | 183 | 3.572823% |
| D | 5122 | 316 | 6.169465% |
Noise dominated data is calculated using 1-second bins in cleaned event files. If a bin has >2000 counts, and if more than 50% of those come from <1% of pixels, then it is considered to be noise-dominated and hence unusable.
| Quadrant | # 1 sec bins | Bins with >0 counts | Bins with >2000 counts | High rate bins dominated by noise | Noise dominated (total time) | Noise dominated (detector-on time) | Marked lightcurve |
|---|---|---|---|---|---|---|---|
| A | 7095 | 5123 | 6 | 6 | 0.08% | 0.12% | 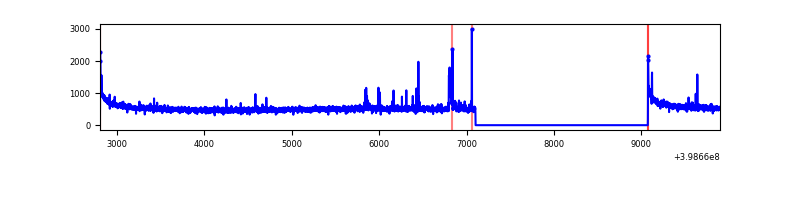 |
| B | 7095 | 5123 | 8 | 8 | 0.11% | 0.16% | 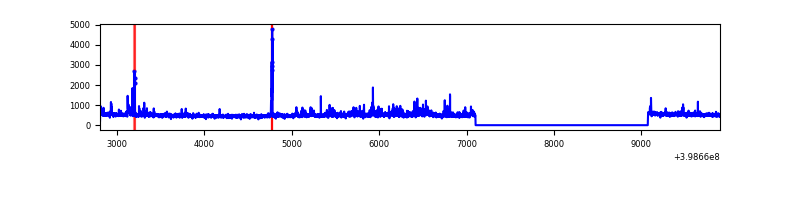 |
| C | 7095 | 5123 | 124 | 124 | 1.75% | 2.42% | 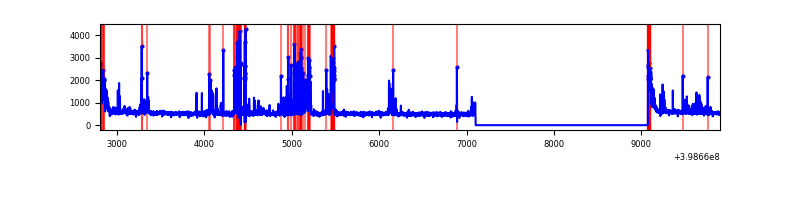 |
| D | 7095 | 5123 | 269 | 269 | 3.79% | 5.25% | 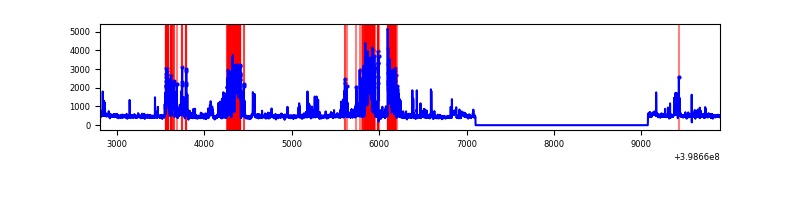 |
Top three noisy pixels from each quadrant. If the there are fewer than three noisy pixels in the level2.evt file, extra rows are filled as -1
| Pixel properties | Quadrant properties | ||||||
|---|---|---|---|---|---|---|---|
| Quadrant | DetID | PixID | Counts | Sigma | Mean | Median | Sigma |
| A | 10 | 83 | 263006 | 2117.15 | 620 | 610 | 123.9 |
| A | 13 | 248 | 65212 | 521.24 | 620 | 610 | 123.9 |
| A | 9 | 143 | 11394 | 87.01 | 620 | 610 | 123.9 |
| B | 0 | 190 | 94415 | 805.08 | 622 | 607 | 116.5 |
| B | 0 | 213 | 68783 | 585.1 | 622 | 607 | 116.5 |
| B | 5 | 172 | 55688 | 472.72 | 622 | 607 | 116.5 |
| C | 14 | 254 | 571398 | 4122.0 | 609 | 614 | 138.5 |
| C | 15 | 214 | 219307 | 1579.32 | 609 | 614 | 138.5 |
| C | 0 | 10 | 184132 | 1325.3 | 609 | 614 | 138.5 |
| D | 10 | 253 | 1018242 | 7098.33 | 600 | 584 | 143.4 |
| D | 13 | 249 | 111582 | 774.23 | 600 | 584 | 143.4 |
| D | 2 | 153 | 43235 | 297.5 | 600 | 584 | 143.4 |
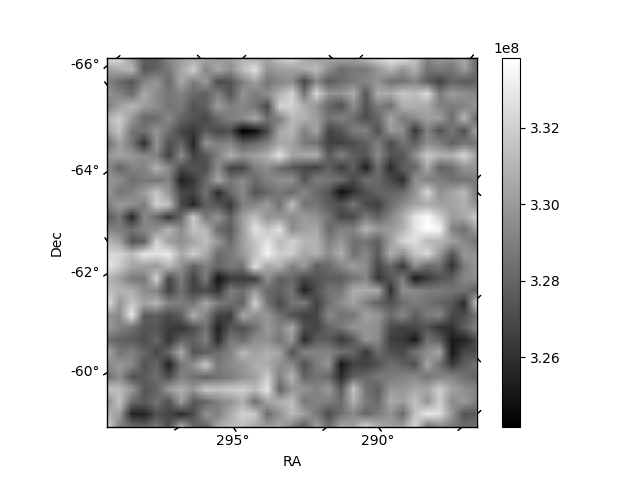
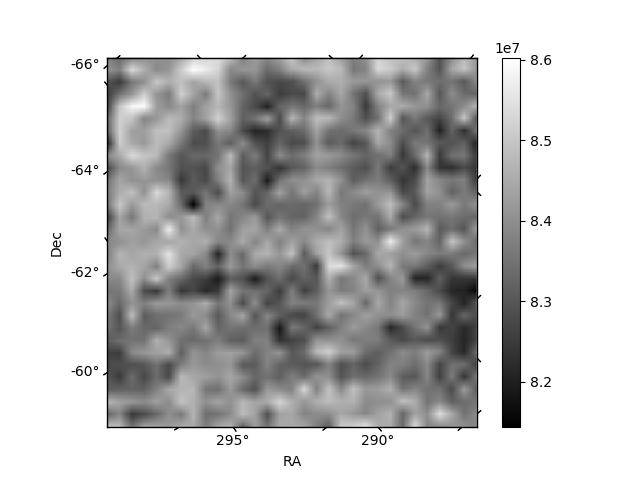
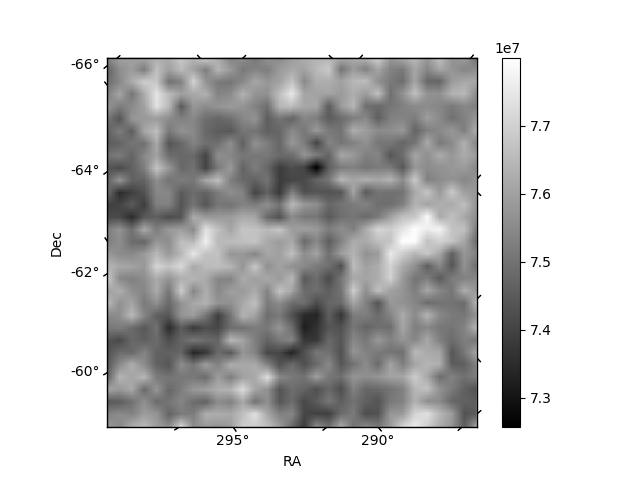
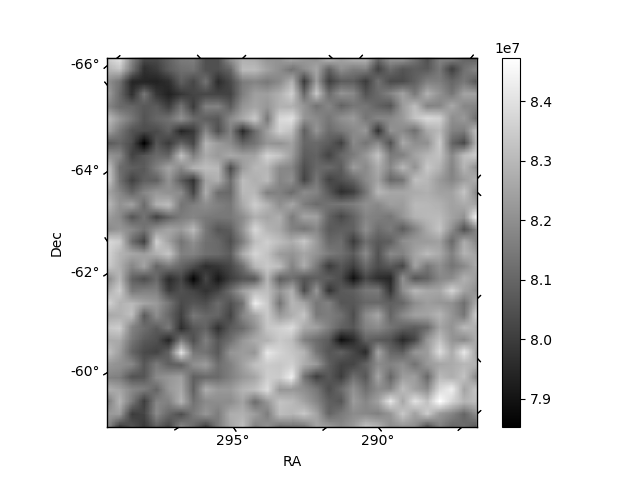
Histogram calculated using DETX and DETY for each event in the final _common_clean file
| Quadrant A | 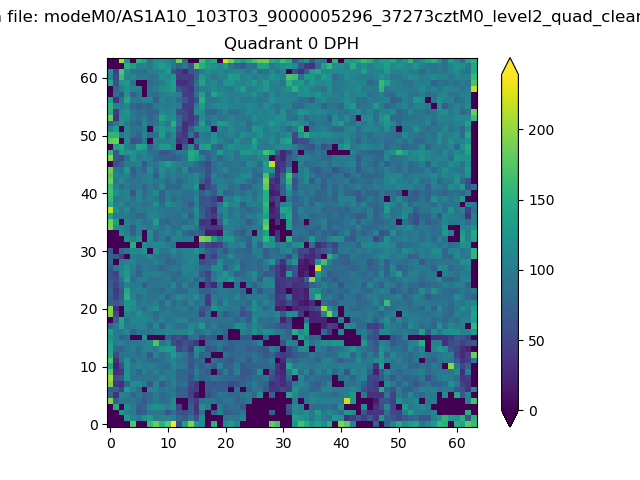 |
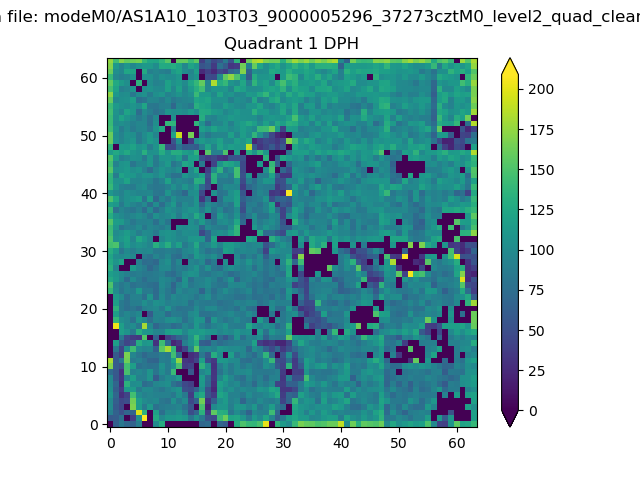 |
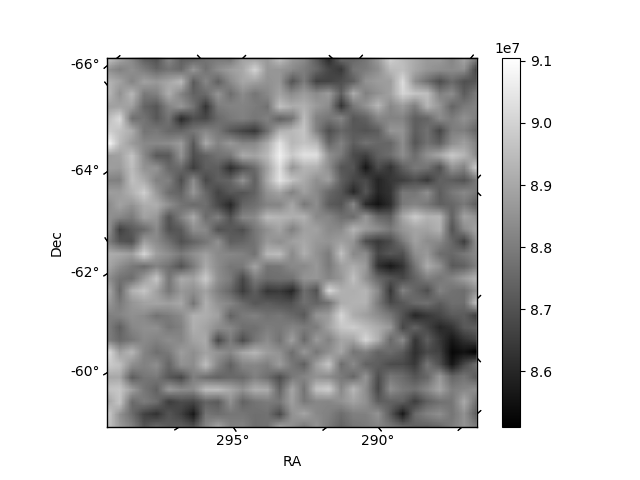
Quadrant B |
|---|---|---|---|
| Quadrant D | 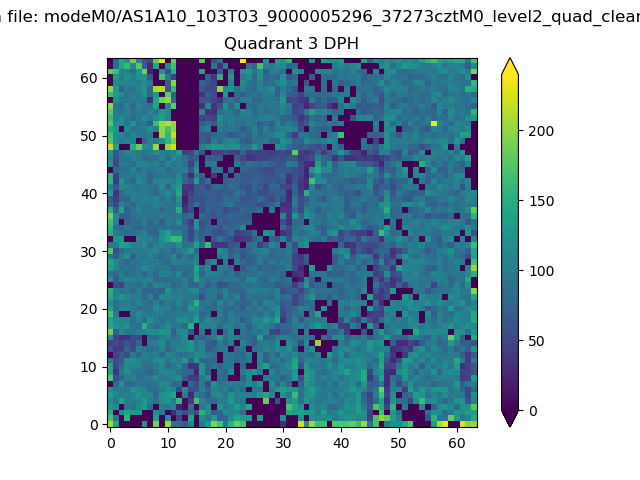 |
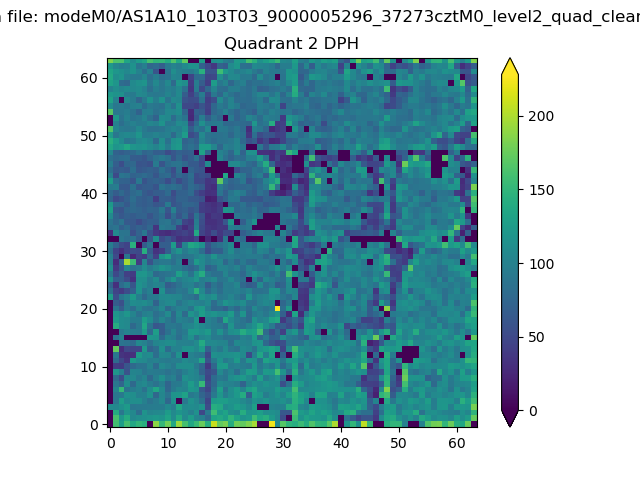 |
Quadrant C |
| Plot type | Count rate plots | Images |
|---|---|---|
| Comparison with Poisson distribution Blue bars denote a histogram of data divided into 1 sec bins. Red curve is a Poisson curve with rate = median count rate of data. |
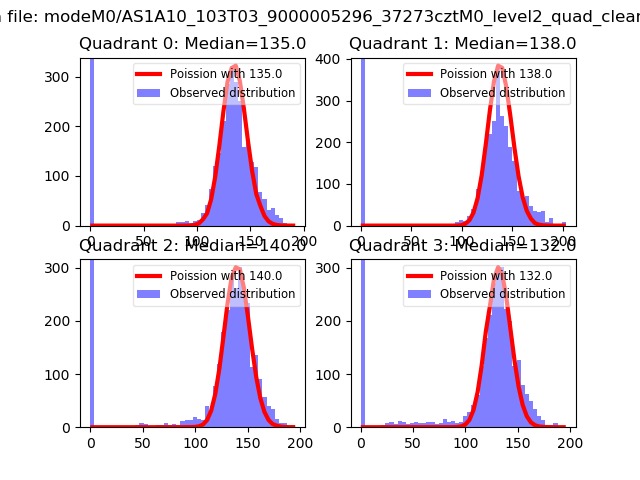 |
 |
| Quadrant-wise count rates Data is divided into 100 sec bins |
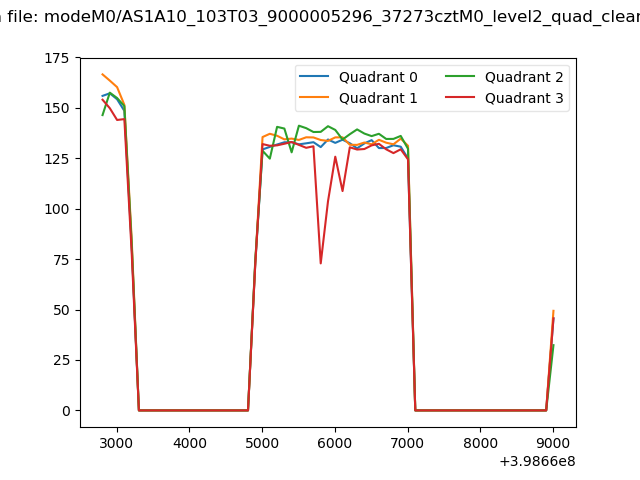 |
|
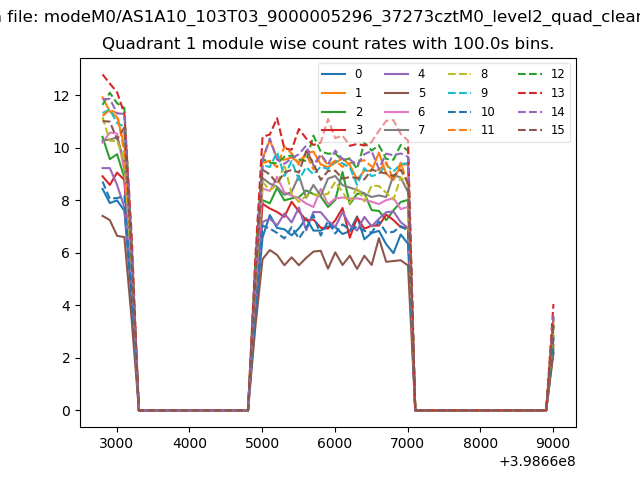
| Module-wise count rates for Quadrant A Data is divided into 100 sec bins |
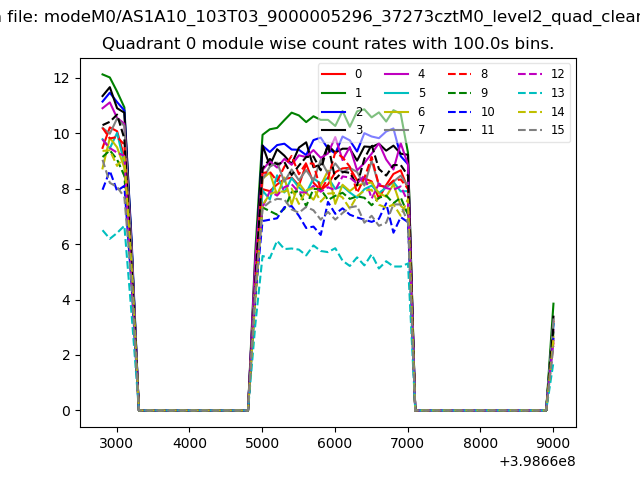 |
 |
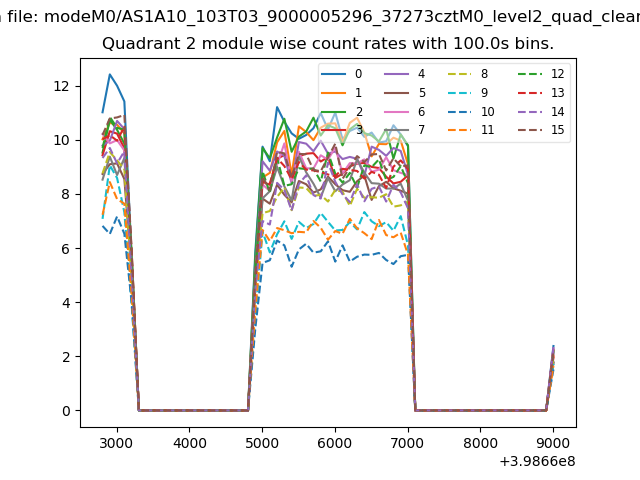
| Module-wise count rates for Quadrant B Data is divided into 100 sec bins |
 |
 |
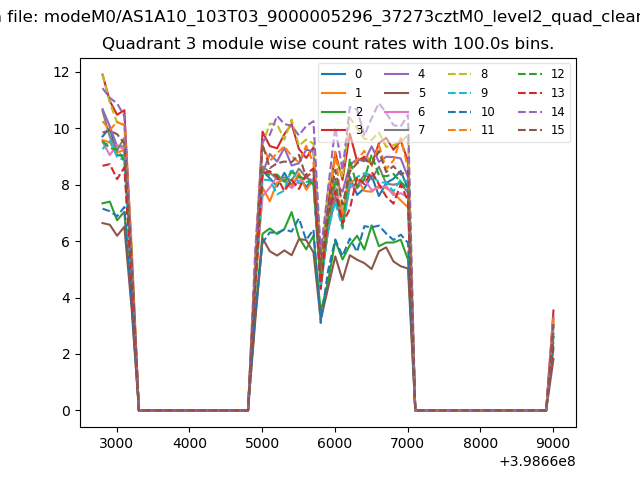
| Module-wise count rates for Quadrant C Data is divided into 100 sec bins |
 |
 |
| Module-wise count rates for Quadrant D Data is divided into 100 sec bins |
 |
 |
| Parameter | Plot |
|---|---|
| CZT HV Monitor | 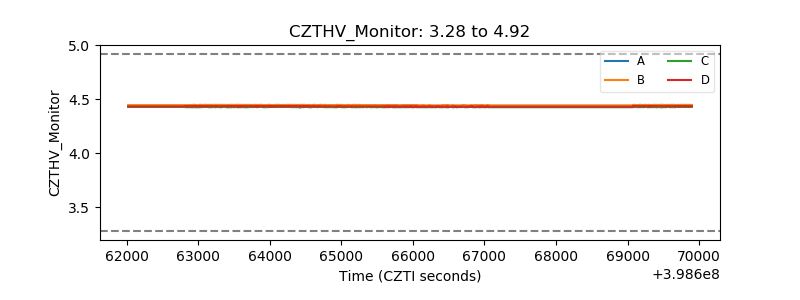 |
| D_VDD | 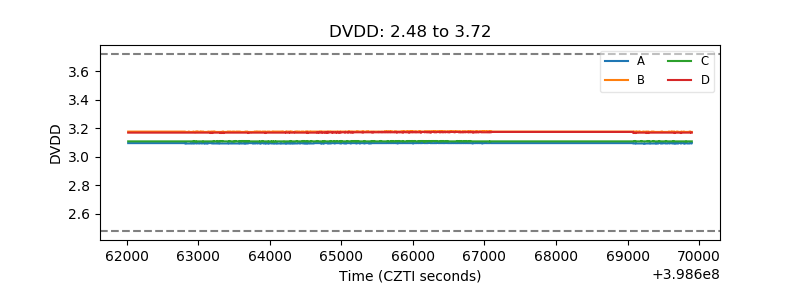 |
| Temperature 1 | 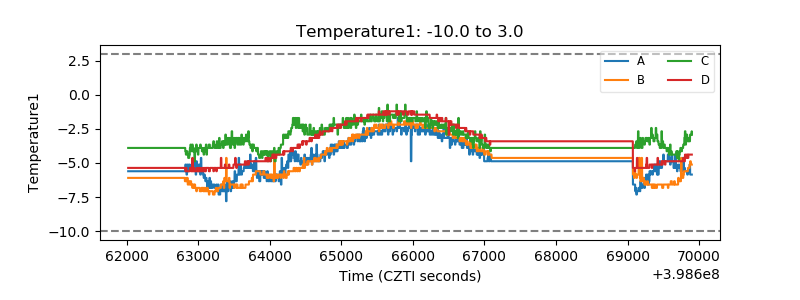 |
| Veto HV Monitor | 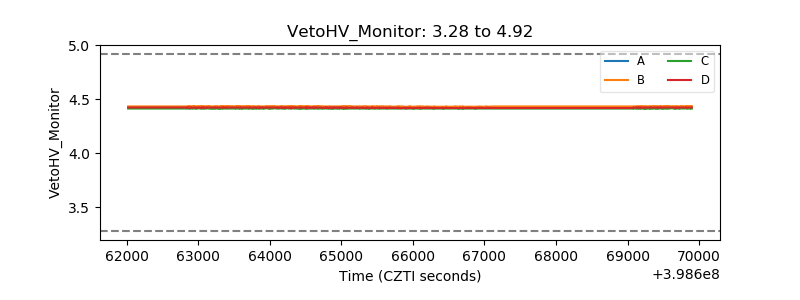 |
| Veto LLD | 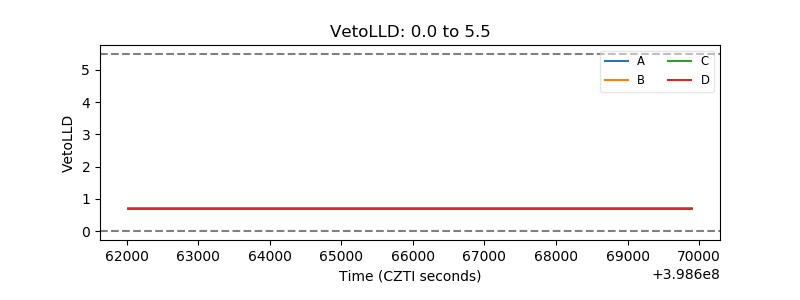 |
| Alpha Counter | 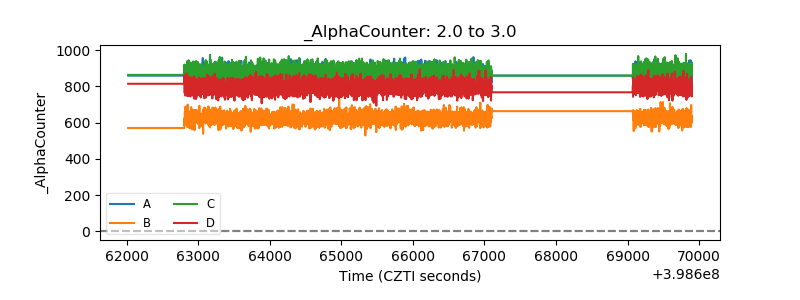 |
| _CPM_Rate | 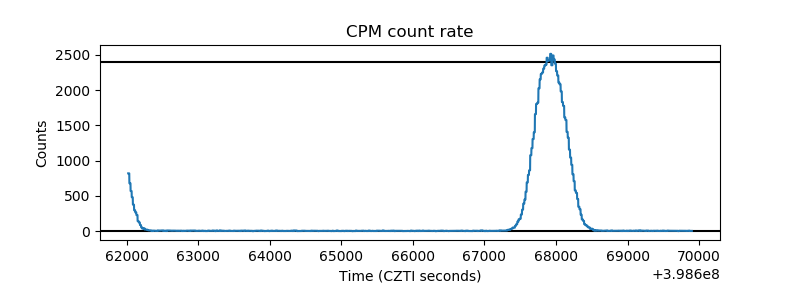 |
| CZT Counter | 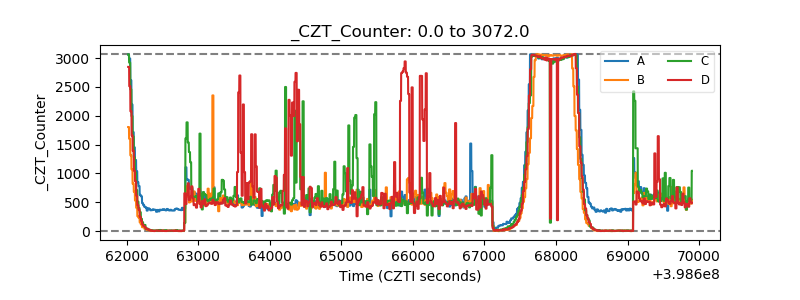 |
| +2.5 Volts monitor | 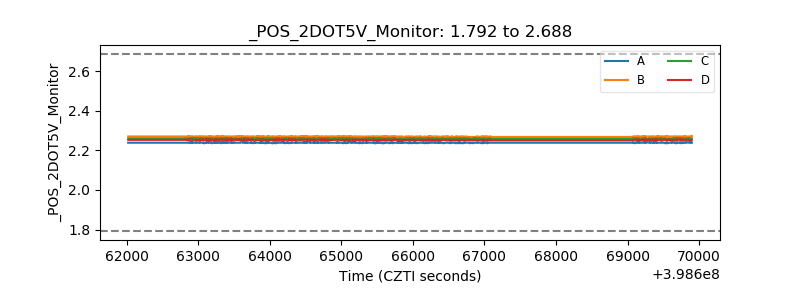 |
| +5 Volts monitor | 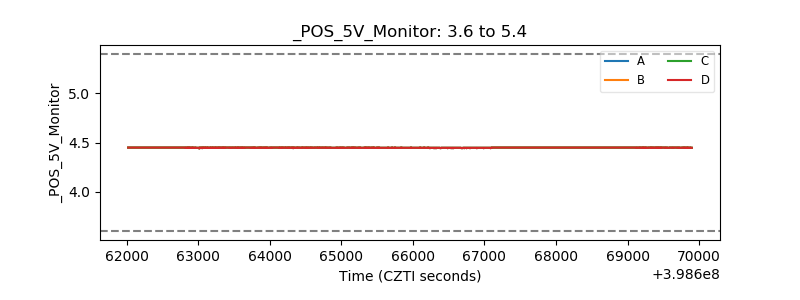 |
| _ROLL_ROT | 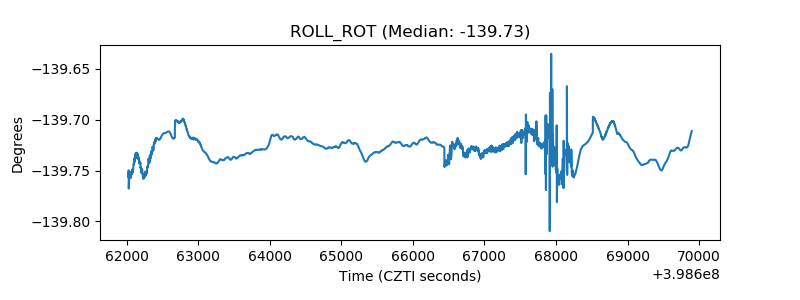 |
| _Roll_DEC |  |
| _Roll_RA | 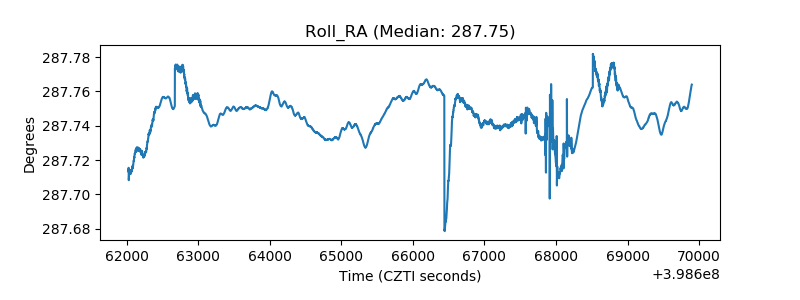 |
| Veto Counter | 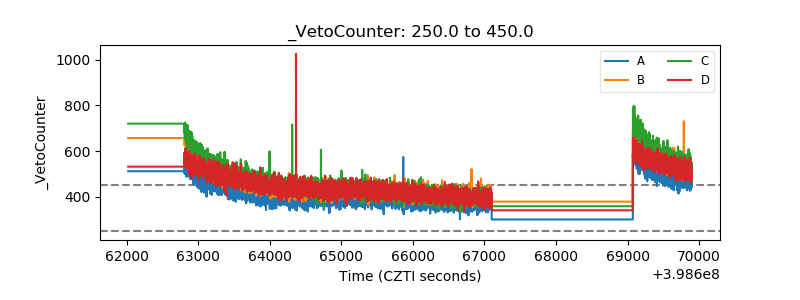 |