| Param | Original file | Final file |
|---|---|---|
| Filename | modeM0/AS1A10_103T03_9000005296_37274cztM0_level2.evt | modeM0/AS1A10_103T03_9000005296_37274cztM0_level2_quad_clean.evt |
| Size (bytes) | 398,600,640 | 57,476,160 |
| Size | 380.1 MB | 54.8 MB |
| Events in quadrant A | 2,677,156 | 347,586 |
| Events in quadrant B | 2,546,856 | 353,899 |
| Events in quadrant C | 2,998,478 | 360,202 |
| Events in quadrant D | 3,516,141 | 334,517 |
| Mode M0 | |||
|---|---|---|---|
| Quadrant | BADHDUFLAG | Total packets | Discarded packets |
| A | 0 | 10828 | 3 |
| B | 0 | 10327 | 2 |
| C | 0 | 11793 | 2 |
| D | 0 | 13539 | 2 |
| Mode SS | |||
|---|---|---|---|
| Quadrant | BADHDUFLAG | Total packets | Discarded packets |
| A | 0 | 100 | 0 |
| B | 0 | 100 | 0 |
| C | 0 | 100 | 0 |
| D | 0 | 100 | 0 |
| Mode M9 | |||
|---|---|---|---|
| Quadrant | BADHDUFLAG | Total packets | Discarded packets |
| A | 0 | 30 | 0 |
| B | 0 | 30 | 0 |
| C | 0 | 30 | 0 |
| D | 0 | 31 | 0 |
| Quadrant | Total seconds | Saturated seconds | Saturation percentage |
|---|---|---|---|
| A | 4900 | 12 | 0.244898% |
| B | 4900 | 11 | 0.224490% |
| C | 4900 | 65 | 1.326531% |
| D | 4900 | 155 | 3.163265% |
Noise dominated data is calculated using 1-second bins in cleaned event files. If a bin has >2000 counts, and if more than 50% of those come from <1% of pixels, then it is considered to be noise-dominated and hence unusable.
| Quadrant | # 1 sec bins | Bins with >0 counts | Bins with >2000 counts | High rate bins dominated by noise | Noise dominated (total time) | Noise dominated (detector-on time) | Marked lightcurve |
|---|---|---|---|---|---|---|---|
| A | 6962 | 4901 | 6 | 6 | 0.09% | 0.12% | 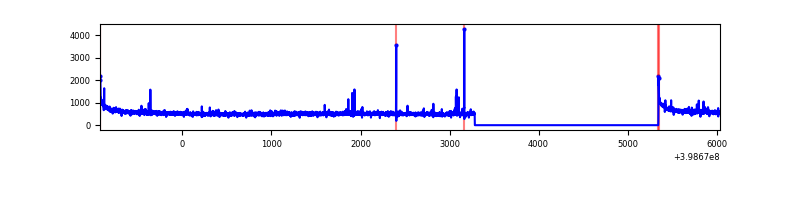 |
| B | 6962 | 4901 | 0 | 0 | 0.00% | 0.00% | 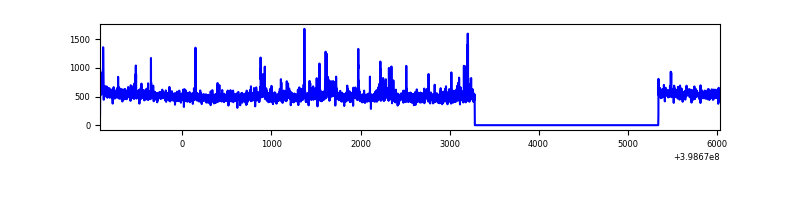 |
| C | 6962 | 4901 | 51 | 51 | 0.73% | 1.04% | 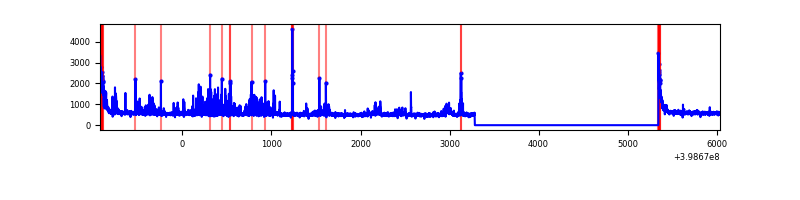 |
| D | 6962 | 4901 | 210 | 210 | 3.02% | 4.28% | 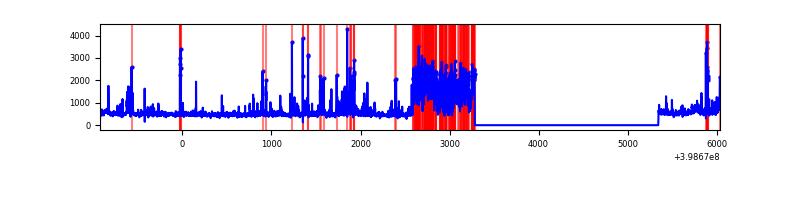 |
Top three noisy pixels from each quadrant. If the there are fewer than three noisy pixels in the level2.evt file, extra rows are filled as -1
| Pixel properties | Quadrant properties | ||||||
|---|---|---|---|---|---|---|---|
| Quadrant | DetID | PixID | Counts | Sigma | Mean | Median | Sigma |
| A | 10 | 83 | 254308 | 2100.64 | 611 | 602 | 120.8 |
| A | 13 | 248 | 23033 | 185.72 | 611 | 602 | 120.8 |
| A | 9 | 143 | 19963 | 160.31 | 611 | 602 | 120.8 |
| B | 0 | 213 | 74113 | 646.24 | 608 | 594 | 113.8 |
| B | 0 | 190 | 47074 | 408.57 | 608 | 594 | 113.8 |
| B | 12 | 111 | 13082 | 109.77 | 608 | 594 | 113.8 |
| C | 14 | 254 | 240491 | 1746.12 | 602 | 609 | 137.4 |
| C | 15 | 214 | 210639 | 1528.82 | 602 | 609 | 137.4 |
| C | 0 | 10 | 156979 | 1138.23 | 602 | 609 | 137.4 |
| D | 2 | 249 | 902233 | 6234.08 | 598 | 586 | 144.6 |
| D | 2 | 250 | 75352 | 516.94 | 598 | 586 | 144.6 |
| D | 2 | 153 | 69890 | 479.17 | 598 | 586 | 144.6 |
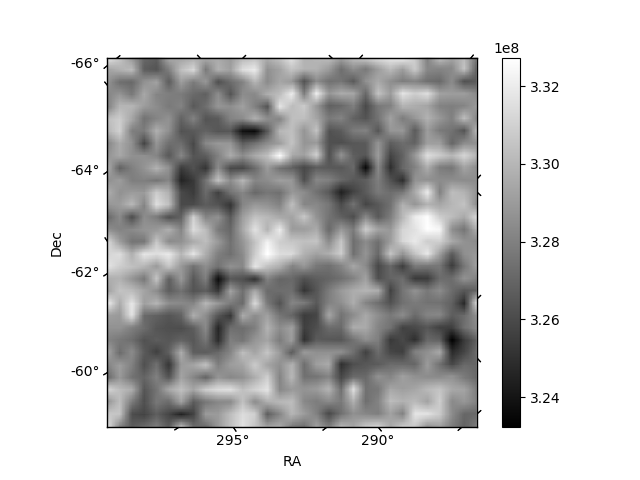
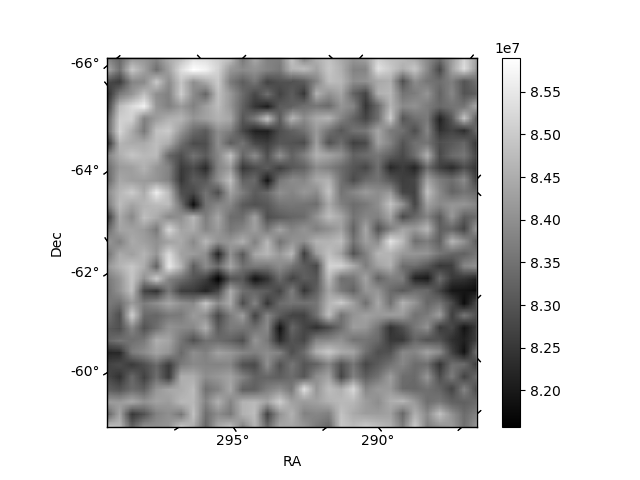
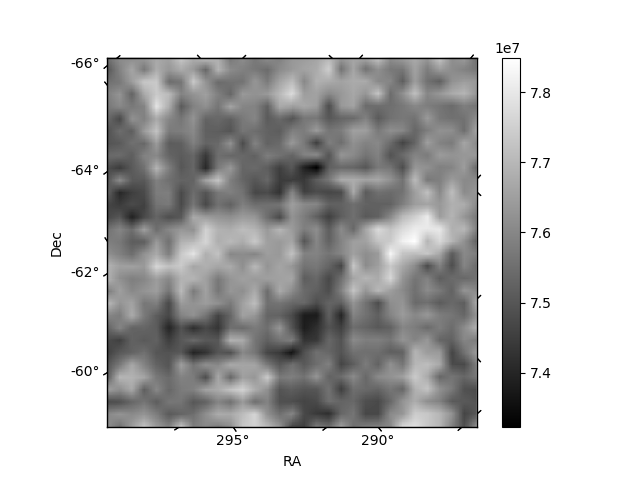
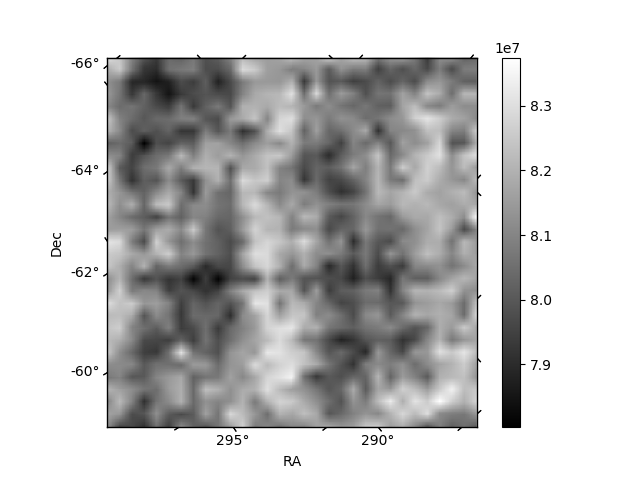
Histogram calculated using DETX and DETY for each event in the final _common_clean file
| Quadrant A | 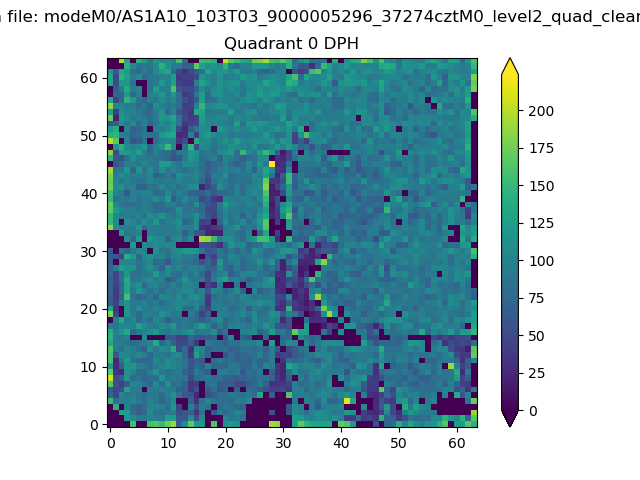 |
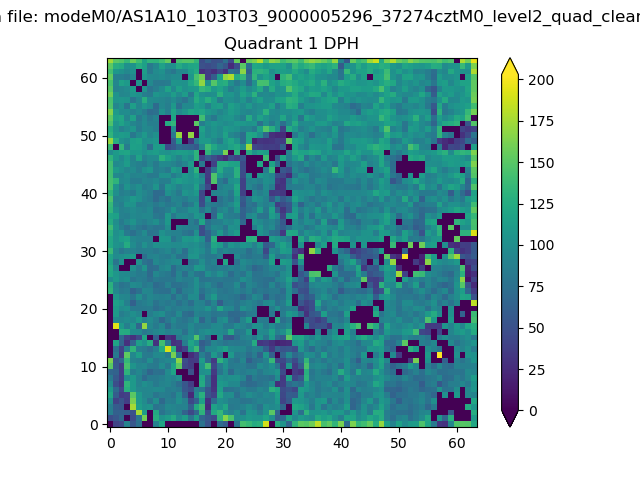 |
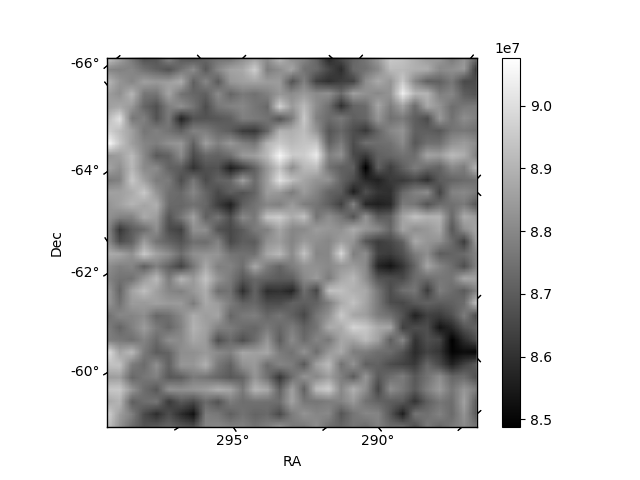
Quadrant B |
|---|---|---|---|
| Quadrant D | 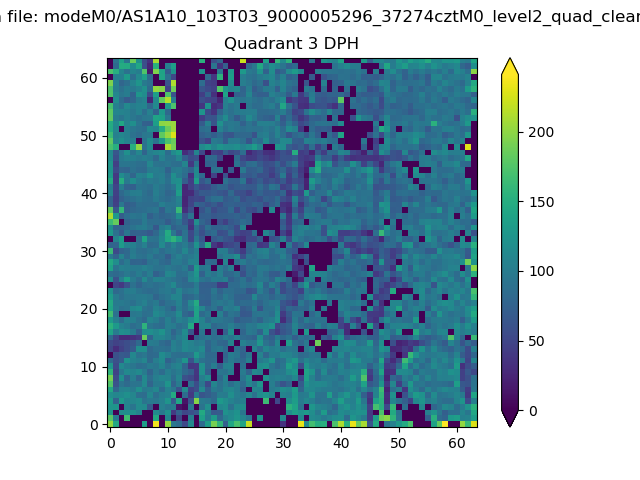 |
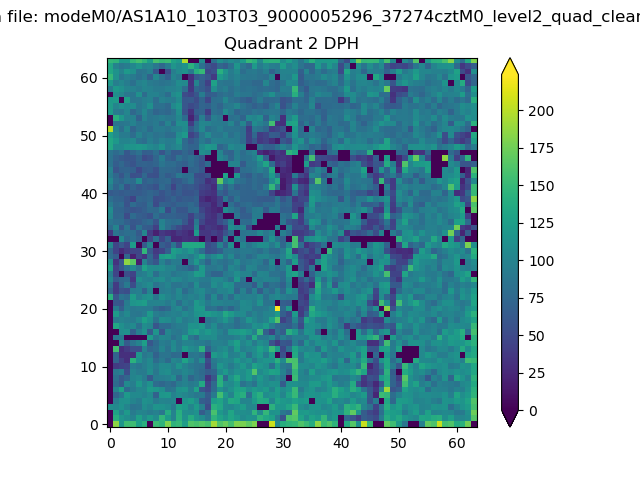 |
Quadrant C |
| Plot type | Count rate plots | Images |
|---|---|---|
| Comparison with Poisson distribution Blue bars denote a histogram of data divided into 1 sec bins. Red curve is a Poisson curve with rate = median count rate of data. |
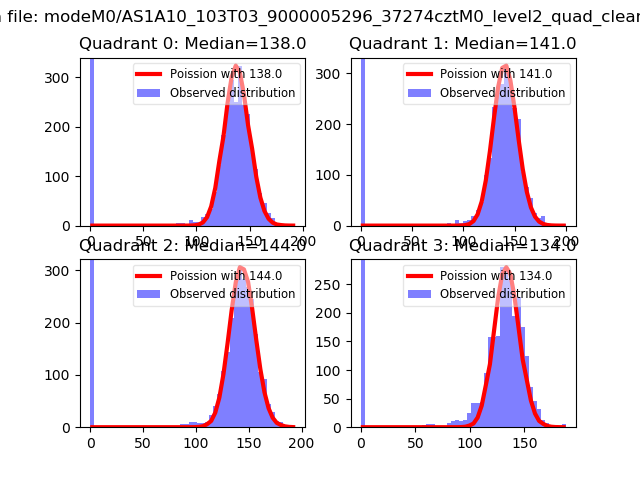 |
 |
| Quadrant-wise count rates Data is divided into 100 sec bins |
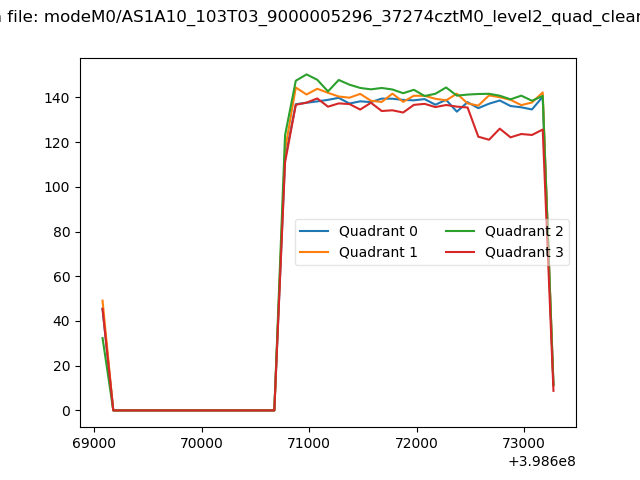 |
|
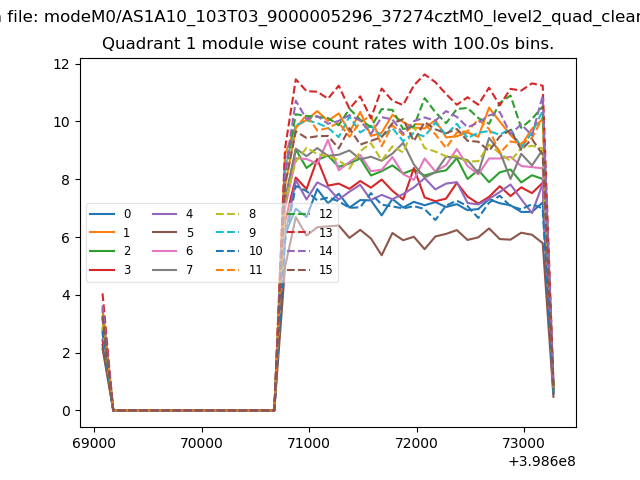
| Module-wise count rates for Quadrant A Data is divided into 100 sec bins |
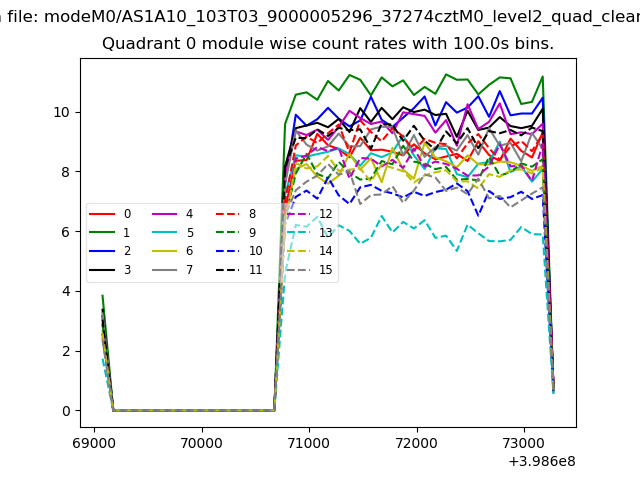 |
 |
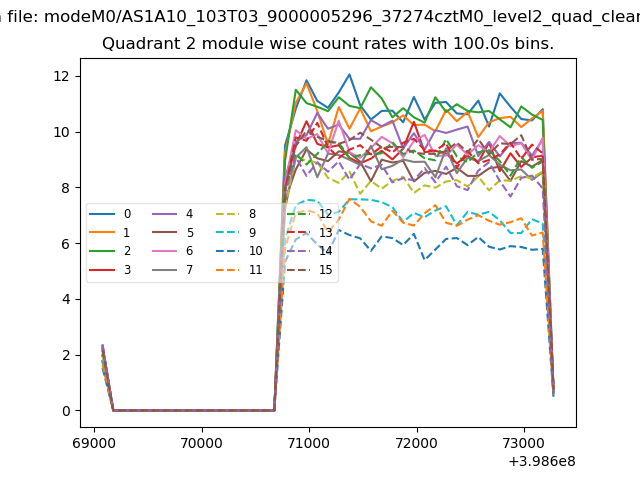
| Module-wise count rates for Quadrant B Data is divided into 100 sec bins |
 |
 |
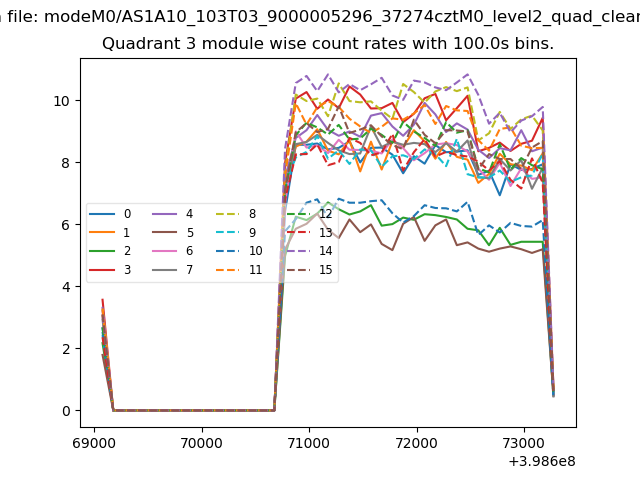
| Module-wise count rates for Quadrant C Data is divided into 100 sec bins |
 |
 |
| Module-wise count rates for Quadrant D Data is divided into 100 sec bins |
 |
 |
| Parameter | Plot |
|---|---|
| CZT HV Monitor | 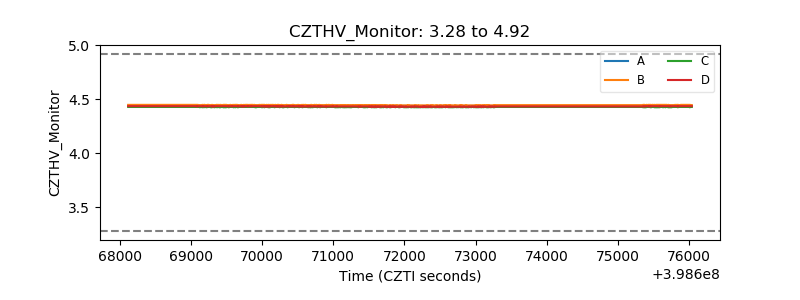 |
| D_VDD | 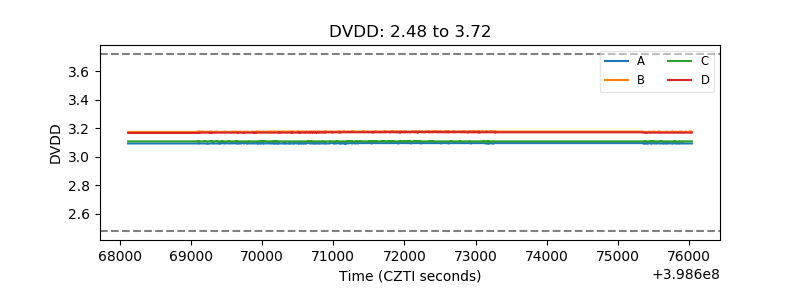 |
| Temperature 1 | 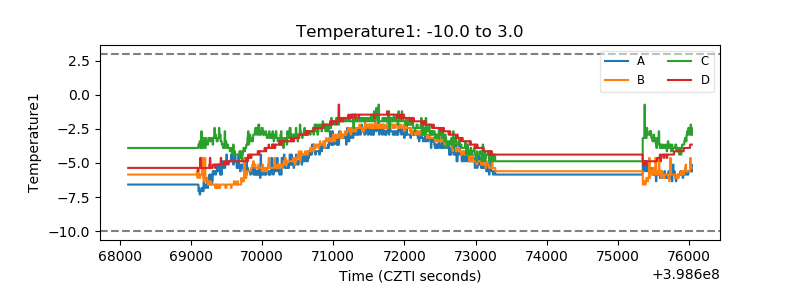 |
| Veto HV Monitor | 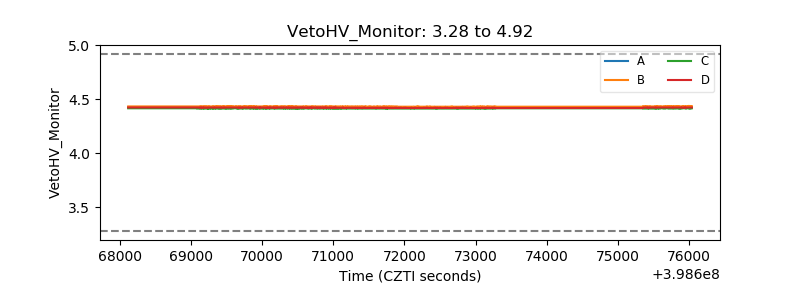 |
| Veto LLD | 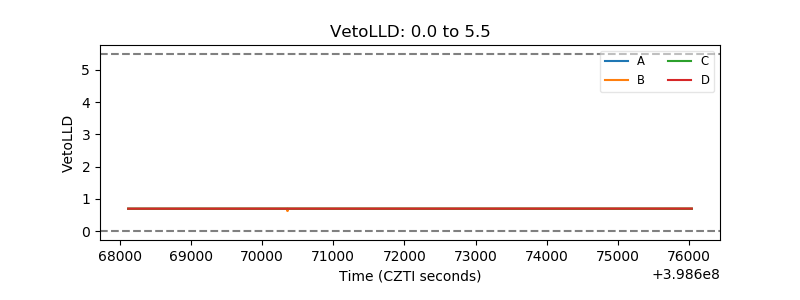 |
| Alpha Counter | 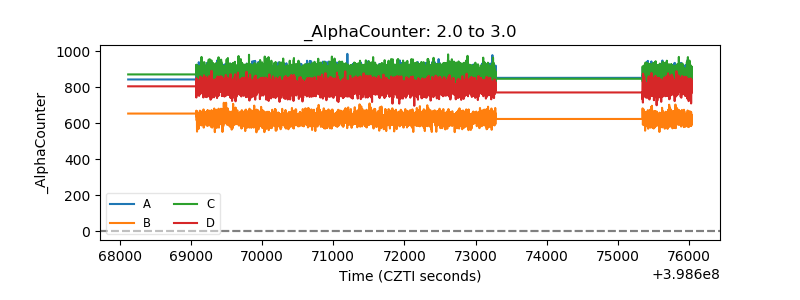 |
| _CPM_Rate | 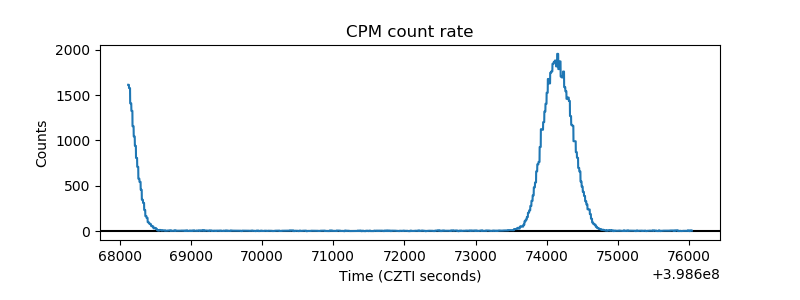 |
| CZT Counter | 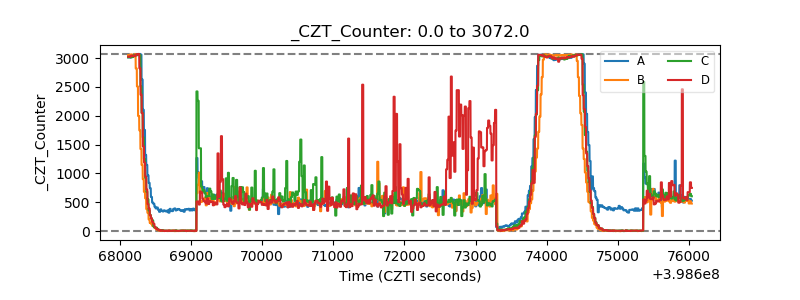 |
| +2.5 Volts monitor | 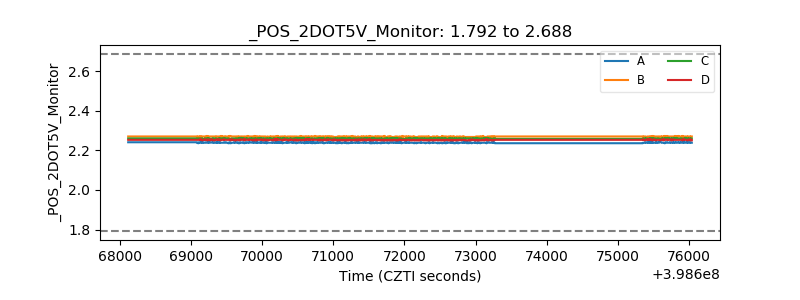 |
| +5 Volts monitor | 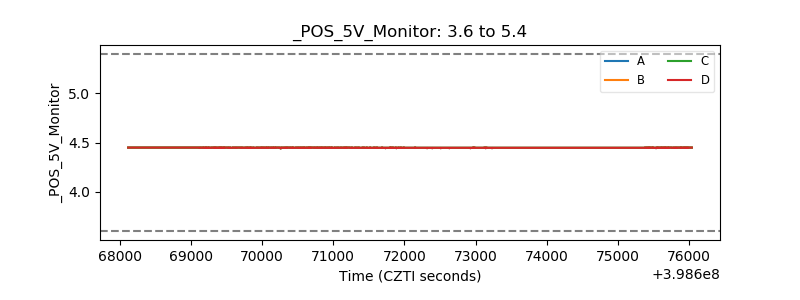 |
| _ROLL_ROT | 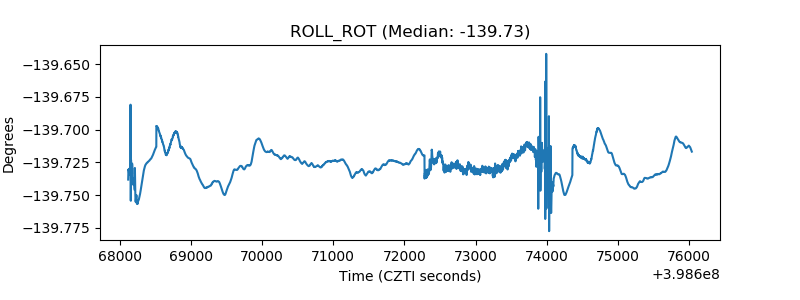 |
| _Roll_DEC | 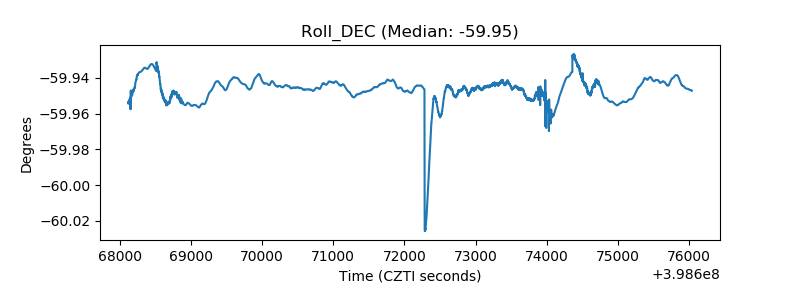 |
| _Roll_RA | 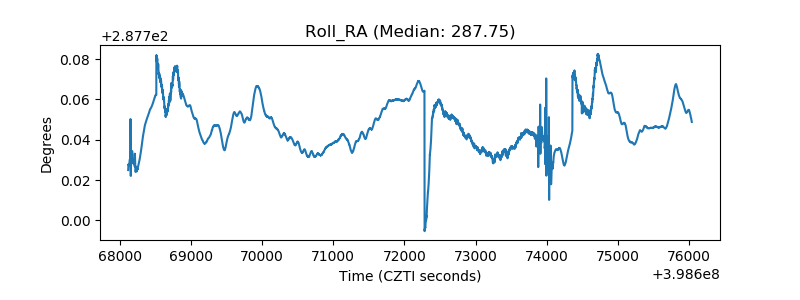 |
| Veto Counter | 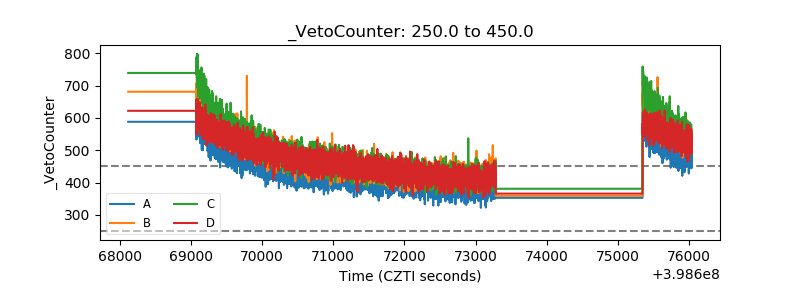 |