| Param | Original file | Final file |
|---|---|---|
| Filename | modeM0/AS1A10_103T03_9000005296_37275cztM0_level2.evt | modeM0/AS1A10_103T03_9000005296_37275cztM0_level2_quad_clean.evt |
| Size (bytes) | 464,768,640 | 62,049,600 |
| Size | 443.2 MB | 59.2 MB |
| Events in quadrant A | 2,758,059 | 393,934 |
| Events in quadrant B | 2,693,108 | 400,087 |
| Events in quadrant C | 2,808,393 | 412,994 |
| Events in quadrant D | 5,481,624 | 325,803 |
| Mode M0 | |||
|---|---|---|---|
| Quadrant | BADHDUFLAG | Total packets | Discarded packets |
| A | 0 | 11050 | 3 |
| B | 0 | 10849 | 2 |
| C | 0 | 11157 | 2 |
| D | 0 | 19492 | 2 |
| Mode SS | |||
|---|---|---|---|
| Quadrant | BADHDUFLAG | Total packets | Discarded packets |
| A | 0 | 100 | 0 |
| B | 0 | 100 | 0 |
| C | 0 | 100 | 0 |
| D | 0 | 100 | 0 |
| Mode M9 | |||
|---|---|---|---|
| Quadrant | BADHDUFLAG | Total packets | Discarded packets |
| A | 0 | 32 | 0 |
| B | 0 | 32 | 0 |
| C | 0 | 32 | 0 |
| D | 0 | 33 | 0 |
| Quadrant | Total seconds | Saturated seconds | Saturation percentage |
|---|---|---|---|
| A | 4927 | 15 | 0.304445% |
| B | 4927 | 22 | 0.446519% |
| C | 4927 | 59 | 1.197483% |
| D | 4927 | 1103 | 22.386848% |
Noise dominated data is calculated using 1-second bins in cleaned event files. If a bin has >2000 counts, and if more than 50% of those come from <1% of pixels, then it is considered to be noise-dominated and hence unusable.
| Quadrant | # 1 sec bins | Bins with >0 counts | Bins with >2000 counts | High rate bins dominated by noise | Noise dominated (total time) | Noise dominated (detector-on time) | Marked lightcurve |
|---|---|---|---|---|---|---|---|
| A | 7050 | 4928 | 9 | 9 | 0.13% | 0.18% | 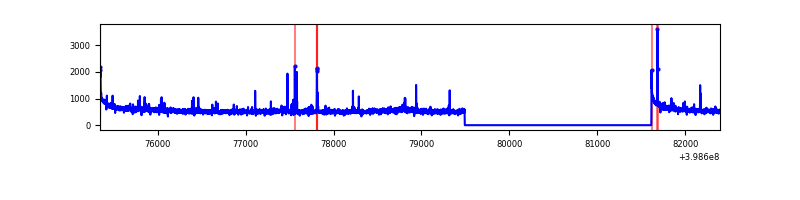 |
| B | 7050 | 4928 | 6 | 6 | 0.09% | 0.12% | 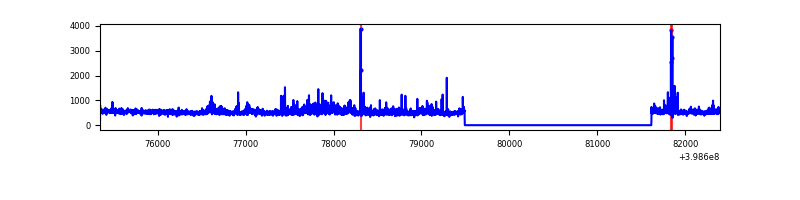 |
| C | 7050 | 4928 | 47 | 47 | 0.67% | 0.95% | 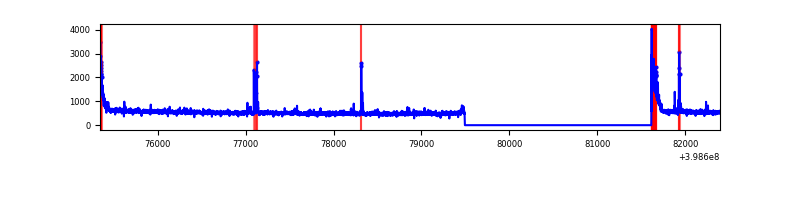 |
| D | 7050 | 4928 | 1019 | 1019 | 14.45% | 20.68% | 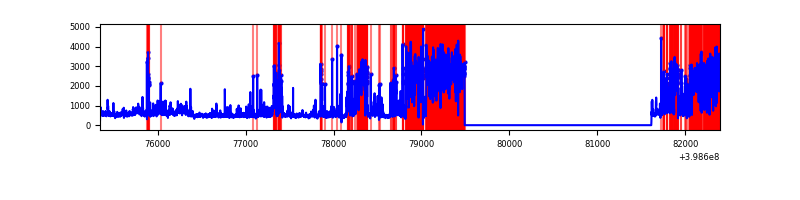 |
Top three noisy pixels from each quadrant. If the there are fewer than three noisy pixels in the level2.evt file, extra rows are filled as -1
| Pixel properties | Quadrant properties | ||||||
|---|---|---|---|---|---|---|---|
| Quadrant | DetID | PixID | Counts | Sigma | Mean | Median | Sigma |
| A | 10 | 83 | 257516 | 2139.05 | 609 | 599 | 120.1 |
| A | 9 | 143 | 107183 | 887.4 | 609 | 599 | 120.1 |
| A | 13 | 248 | 15490 | 123.98 | 609 | 599 | 120.1 |
| B | 0 | 213 | 177550 | 1568.12 | 606 | 594 | 112.8 |
| B | 0 | 190 | 96038 | 845.79 | 606 | 594 | 112.8 |
| B | 12 | 111 | 12987 | 109.82 | 606 | 594 | 112.8 |
| C | 15 | 214 | 211632 | 1550.22 | 598 | 604 | 136.1 |
| C | 0 | 10 | 178799 | 1309.03 | 598 | 604 | 136.1 |
| C | 14 | 254 | 71935 | 524.0 | 598 | 604 | 136.1 |
| D | 10 | 253 | 3055297 | 23764.76 | 536 | 523 | 128.5 |
| D | 2 | 250 | 83951 | 649.03 | 536 | 523 | 128.5 |
| D | 2 | 153 | 72497 | 559.93 | 536 | 523 | 128.5 |
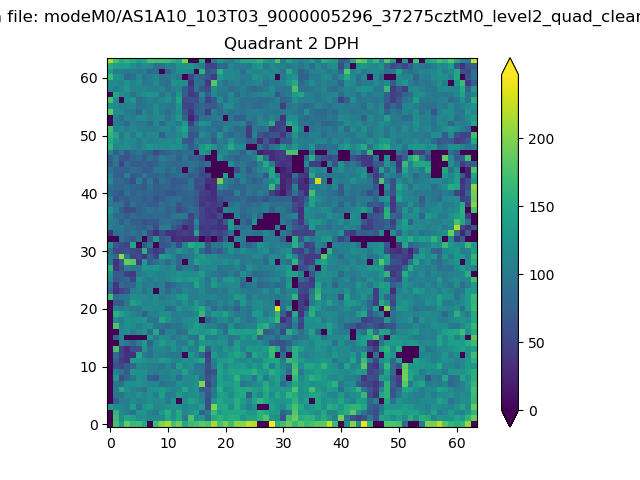
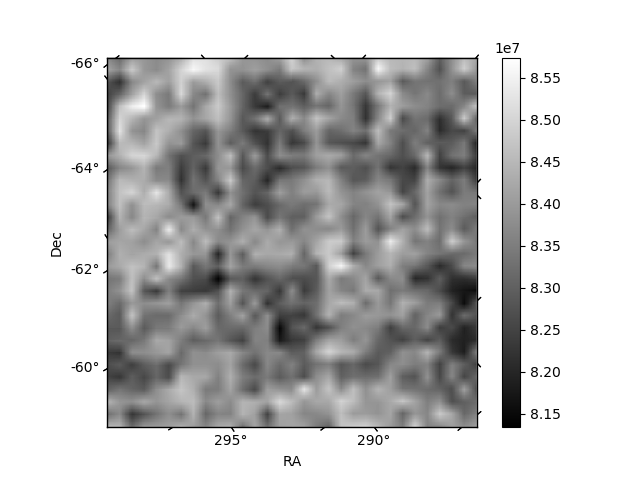
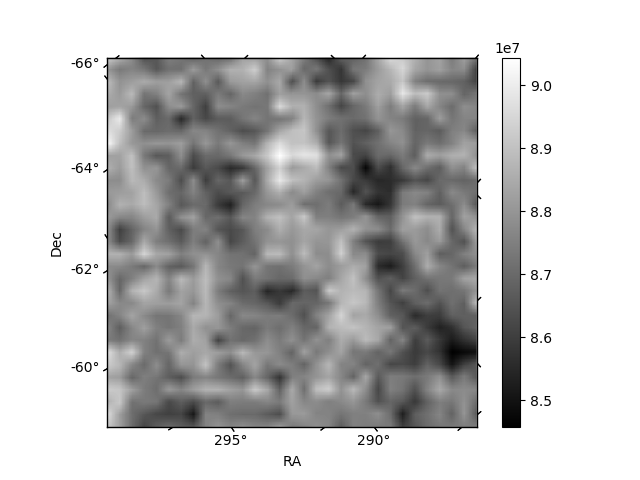
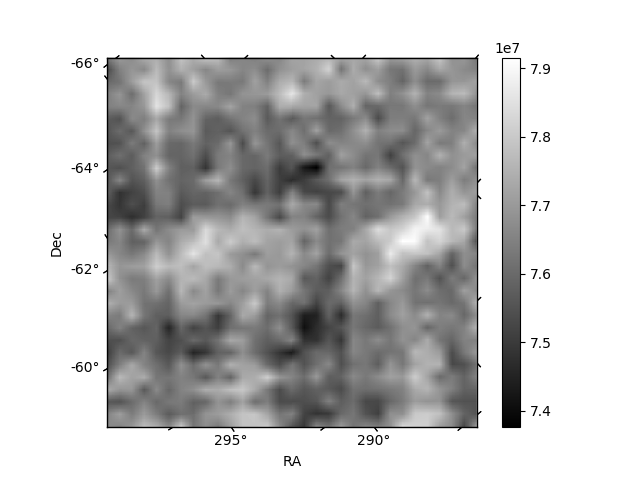
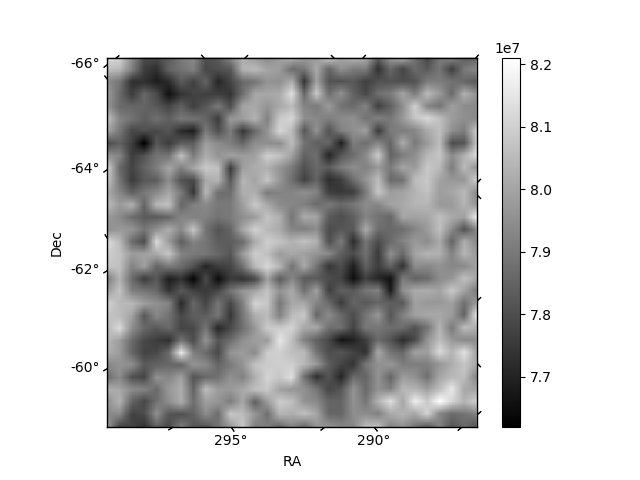
Histogram calculated using DETX and DETY for each event in the final _common_clean file
| Quadrant A | 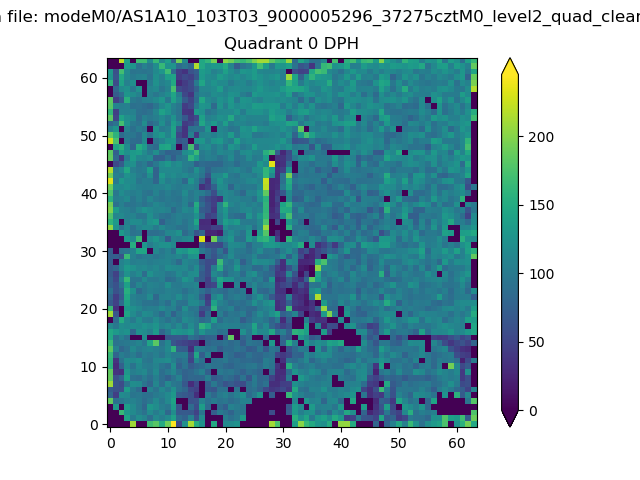 |
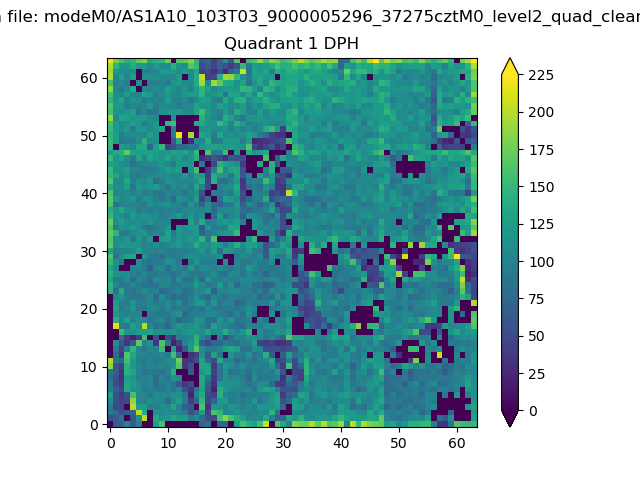 |
Quadrant B |
|---|---|---|---|
| Quadrant D | 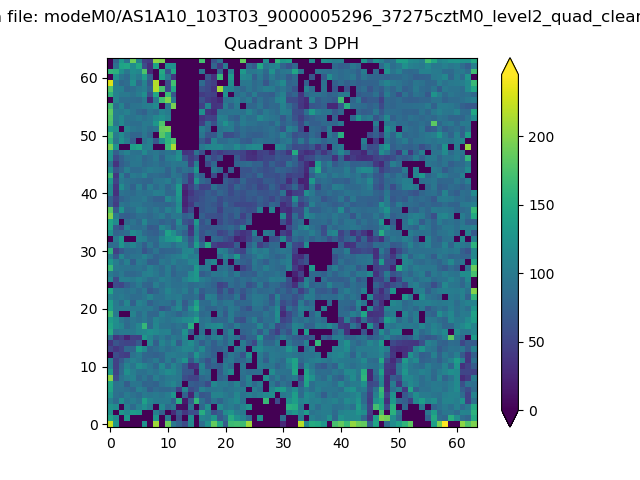 |
 |
Quadrant C |
| Plot type | Count rate plots | Images |
|---|---|---|
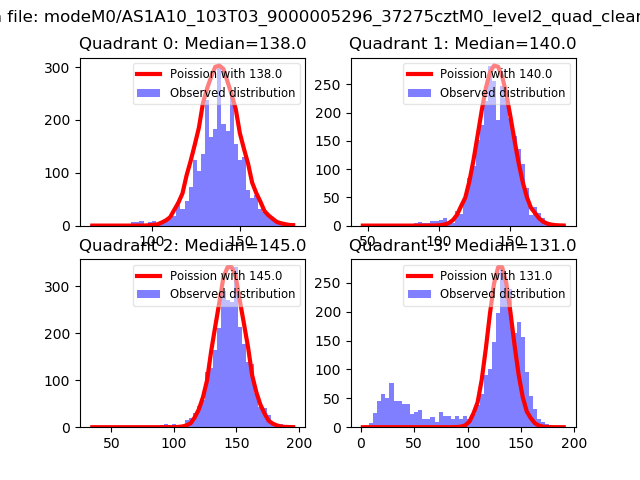
| Comparison with Poisson distribution Blue bars denote a histogram of data divided into 1 sec bins. Red curve is a Poisson curve with rate = median count rate of data. |
 |
 |
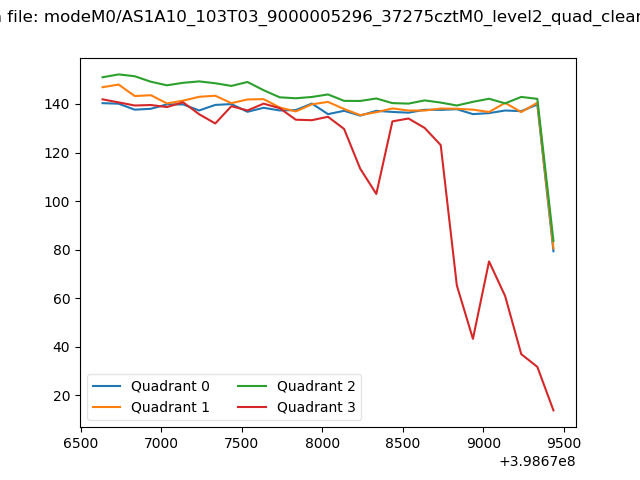
| Quadrant-wise count rates Data is divided into 100 sec bins |
 |
|
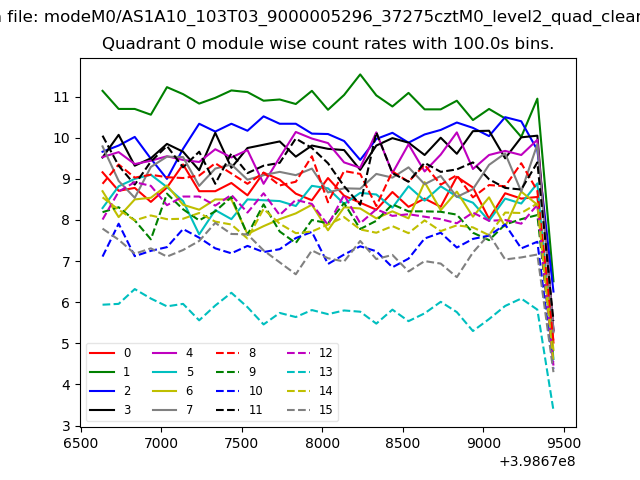
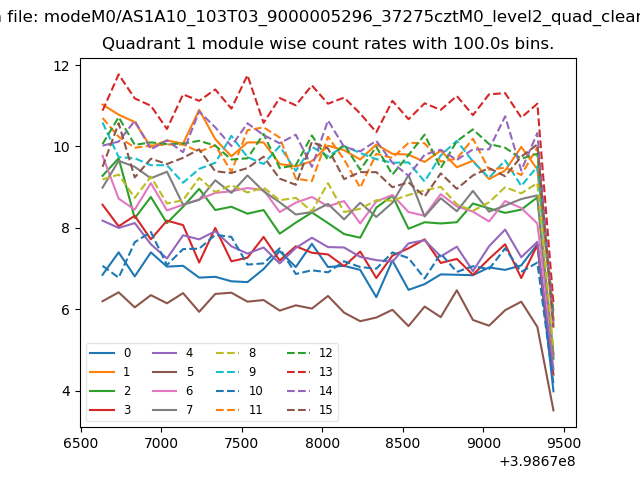
| Module-wise count rates for Quadrant A Data is divided into 100 sec bins |
 |
 |
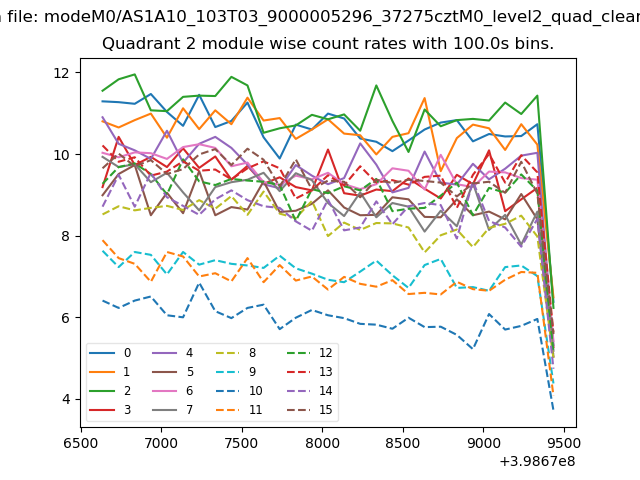
| Module-wise count rates for Quadrant B Data is divided into 100 sec bins |
 |
 |
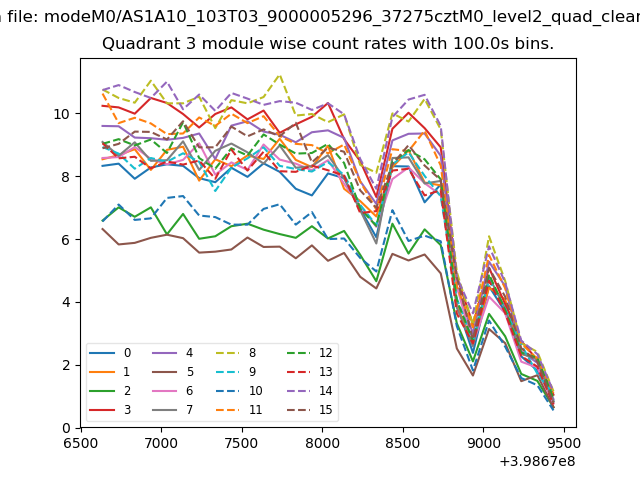
| Module-wise count rates for Quadrant C Data is divided into 100 sec bins |
 |
 |
| Module-wise count rates for Quadrant D Data is divided into 100 sec bins |
 |
 |
| Parameter | Plot |
|---|---|
| CZT HV Monitor | 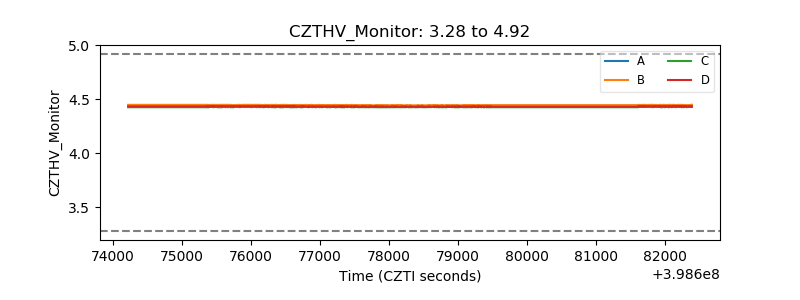 |
| D_VDD | 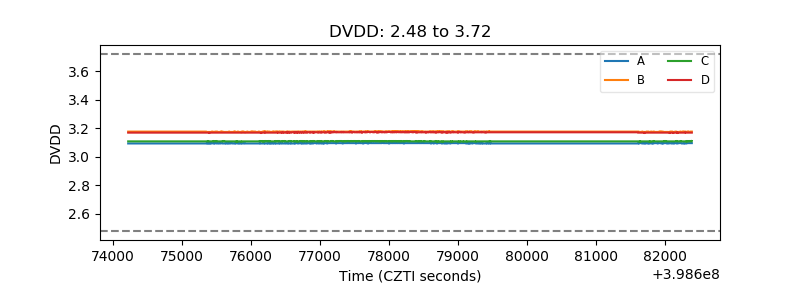 |
| Temperature 1 | 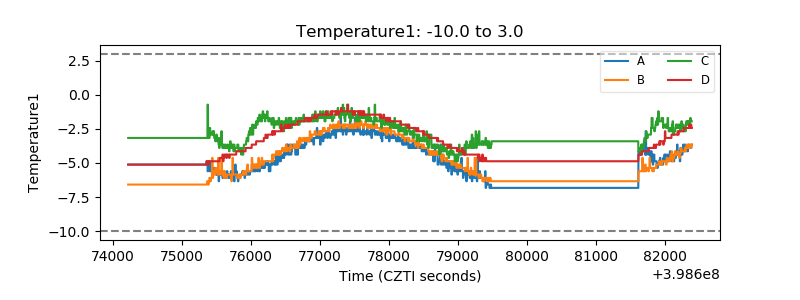 |
| Veto HV Monitor | 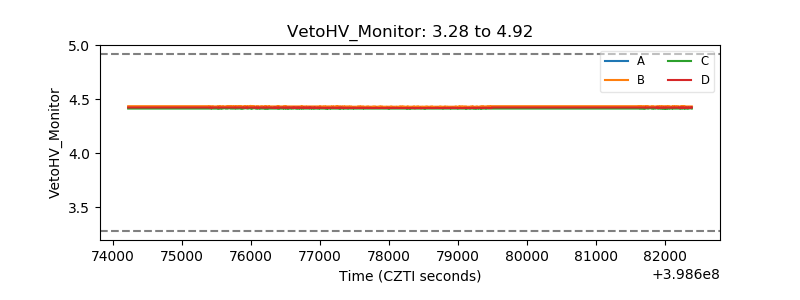 |
| Veto LLD | 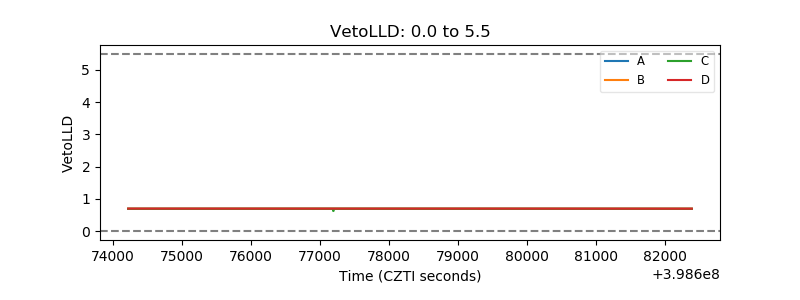 |
| Alpha Counter | 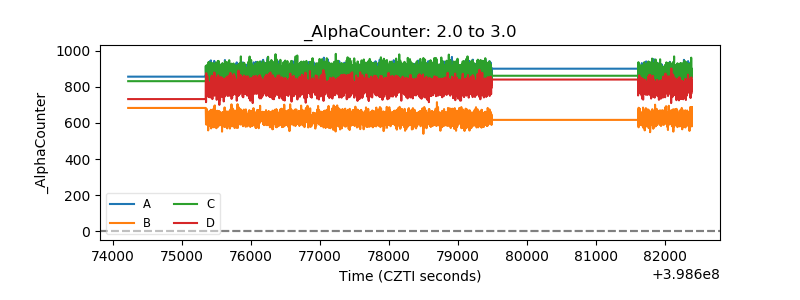 |
| _CPM_Rate | 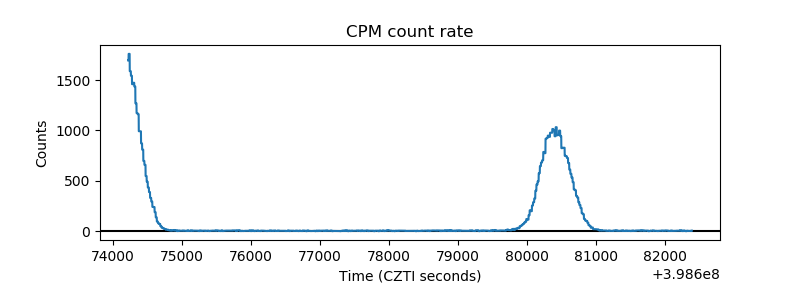 |
| CZT Counter | 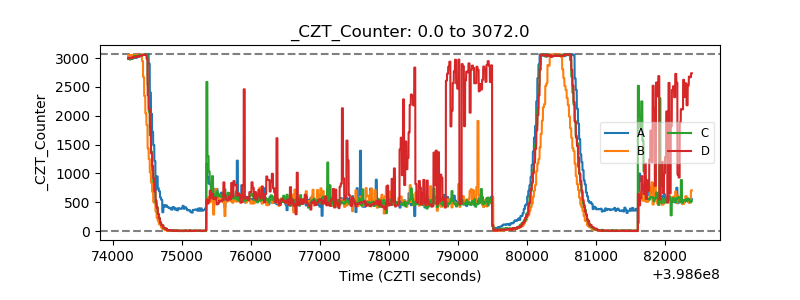 |
| +2.5 Volts monitor |  |
| +5 Volts monitor | 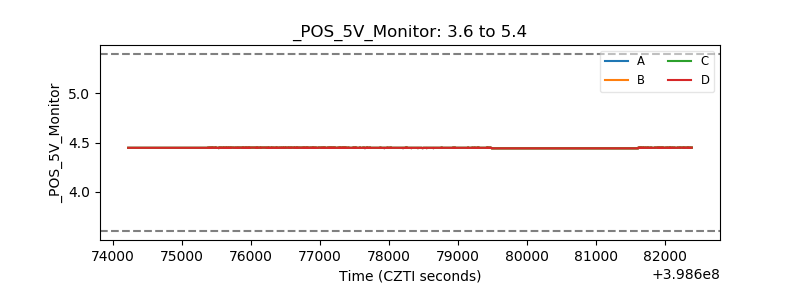 |
| _ROLL_ROT | 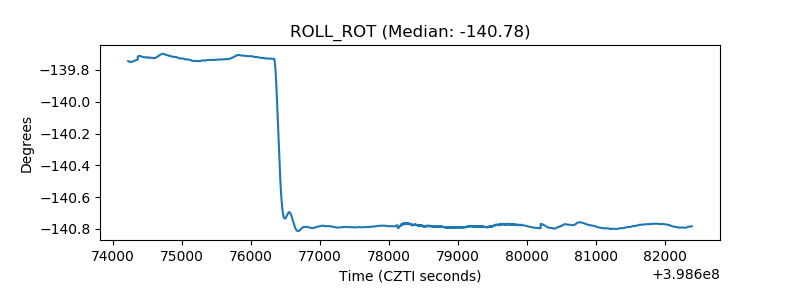 |
| _Roll_DEC | 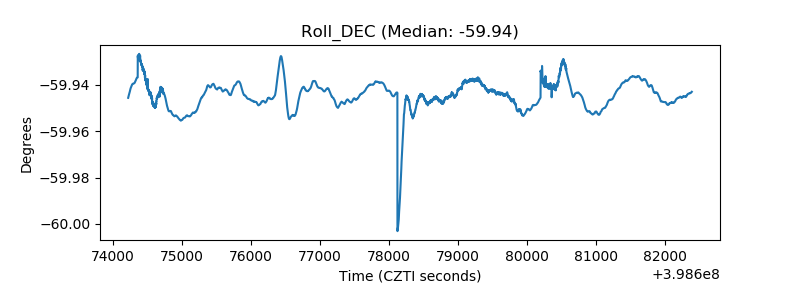 |
| _Roll_RA | 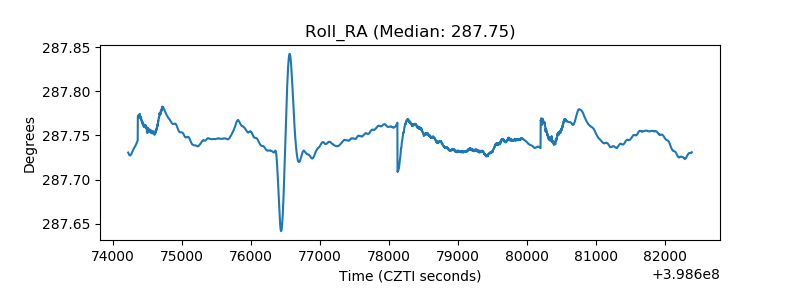 |
| Veto Counter | 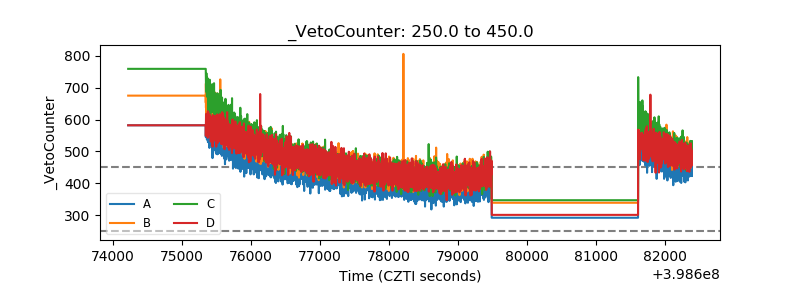 |