| Param | Original file | Final file |
|---|---|---|
| Filename | modeM0/AS1A10_103T03_9000005296_37276cztM0_level2.evt | modeM0/AS1A10_103T03_9000005296_37276cztM0_level2_quad_clean.evt |
| Size (bytes) | 414,406,080 | 76,550,400 |
| Size | 395.2 MB | 73.0 MB |
| Events in quadrant A | 2,761,268 | 489,914 |
| Events in quadrant B | 2,626,580 | 496,984 |
| Events in quadrant C | 2,779,147 | 512,705 |
| Events in quadrant D | 4,045,945 | 470,484 |
| Mode M0 | |||
|---|---|---|---|
| Quadrant | BADHDUFLAG | Total packets | Discarded packets |
| A | 0 | 11108 | 3 |
| B | 0 | 10824 | 2 |
| C | 0 | 11083 | 2 |
| D | 0 | 15334 | 2 |
| Mode SS | |||
|---|---|---|---|
| Quadrant | BADHDUFLAG | Total packets | Discarded packets |
| A | 0 | 102 | 0 |
| B | 0 | 102 | 0 |
| C | 0 | 102 | 0 |
| D | 0 | 102 | 0 |
| Mode M9 | |||
|---|---|---|---|
| Quadrant | BADHDUFLAG | Total packets | Discarded packets |
| A | 0 | 33 | 0 |
| B | 0 | 33 | 0 |
| C | 0 | 33 | 0 |
| D | 0 | 34 | 0 |
| Quadrant | Total seconds | Saturated seconds | Saturation percentage |
|---|---|---|---|
| A | 4959 | 24 | 0.483969% |
| B | 4959 | 16 | 0.322646% |
| C | 4959 | 73 | 1.472071% |
| D | 4959 | 611 | 12.321032% |
Noise dominated data is calculated using 1-second bins in cleaned event files. If a bin has >2000 counts, and if more than 50% of those come from <1% of pixels, then it is considered to be noise-dominated and hence unusable.
| Quadrant | # 1 sec bins | Bins with >0 counts | Bins with >2000 counts | High rate bins dominated by noise | Noise dominated (total time) | Noise dominated (detector-on time) | Marked lightcurve |
|---|---|---|---|---|---|---|---|
| A | 7082 | 4960 | 12 | 12 | 0.17% | 0.24% | 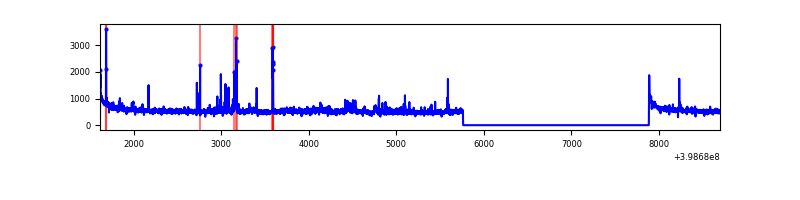 |
| B | 7082 | 4960 | 8 | 8 | 0.11% | 0.16% | 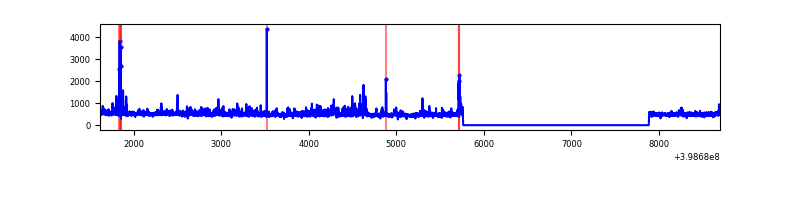 |
| C | 7082 | 4960 | 66 | 66 | 0.93% | 1.33% | 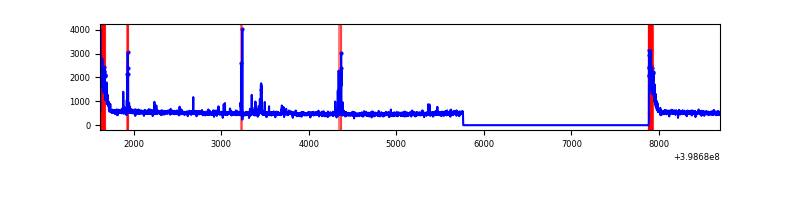 |
| D | 7082 | 4960 | 512 | 512 | 7.23% | 10.32% | 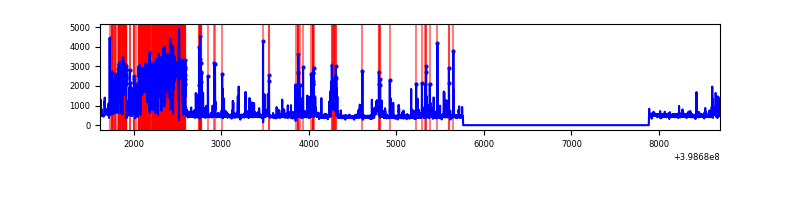 |
Top three noisy pixels from each quadrant. If the there are fewer than three noisy pixels in the level2.evt file, extra rows are filled as -1
| Pixel properties | Quadrant properties | ||||||
|---|---|---|---|---|---|---|---|
| Quadrant | DetID | PixID | Counts | Sigma | Mean | Median | Sigma |
| A | 10 | 83 | 263837 | 2238.43 | 590 | 581 | 117.6 |
| A | 9 | 143 | 155800 | 1319.81 | 590 | 581 | 117.6 |
| A | 13 | 248 | 41439 | 347.41 | 590 | 581 | 117.6 |
| B | 0 | 213 | 181252 | 1633.29 | 584 | 571 | 110.6 |
| B | 0 | 190 | 75309 | 675.61 | 584 | 571 | 110.6 |
| B | 5 | 172 | 32226 | 286.15 | 584 | 571 | 110.6 |
| C | 0 | 10 | 231642 | 1747.97 | 575 | 581 | 132.2 |
| C | 15 | 214 | 212838 | 1605.72 | 575 | 581 | 132.2 |
| C | 14 | 254 | 48339 | 361.29 | 575 | 581 | 132.2 |
| D | 10 | 253 | 1389397 | 10606.89 | 547 | 534 | 130.9 |
| D | 13 | 249 | 142668 | 1085.49 | 547 | 534 | 130.9 |
| D | 12 | 218 | 140303 | 1067.43 | 547 | 534 | 130.9 |
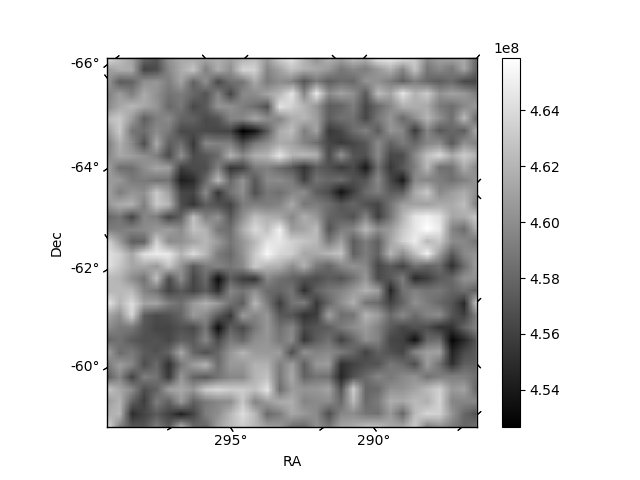
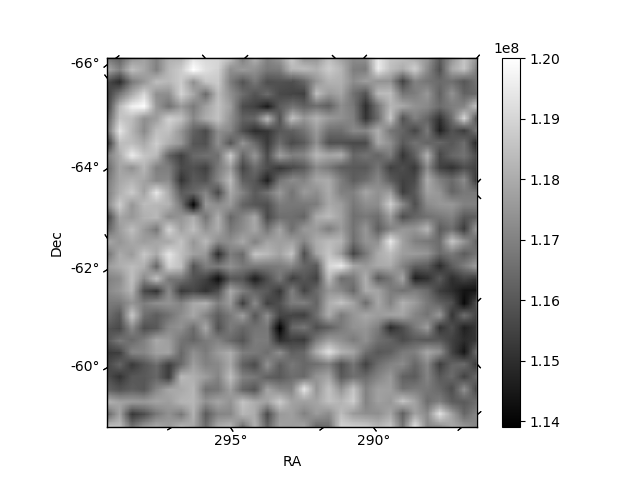
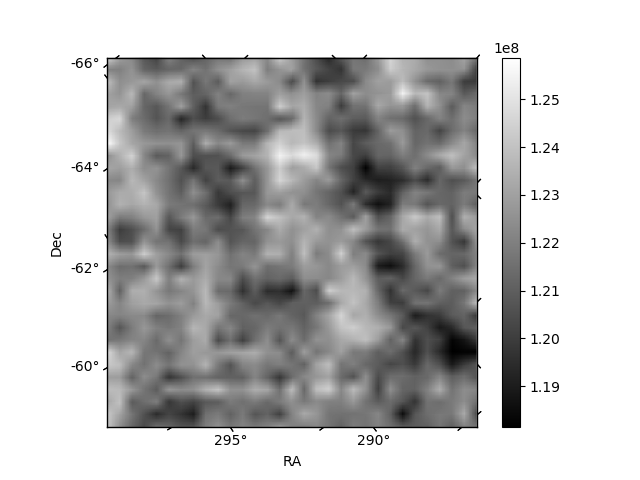
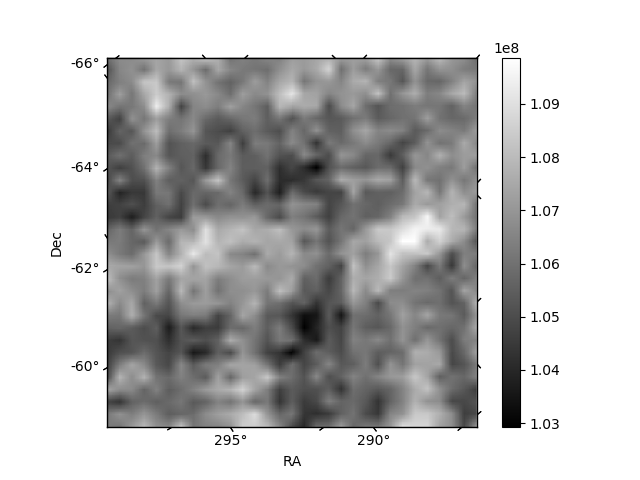
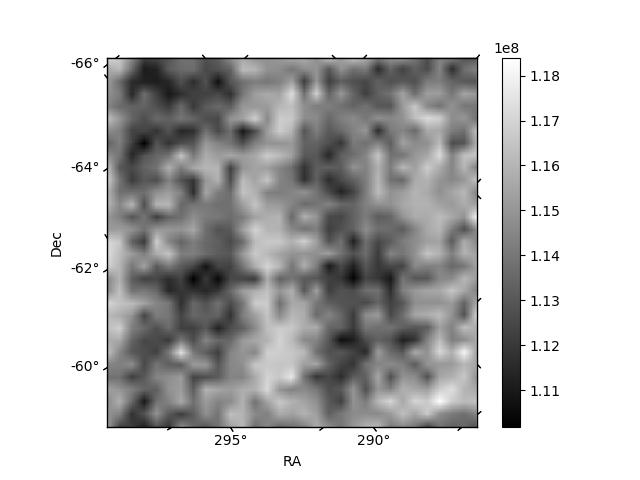
Histogram calculated using DETX and DETY for each event in the final _common_clean file
| Quadrant A | 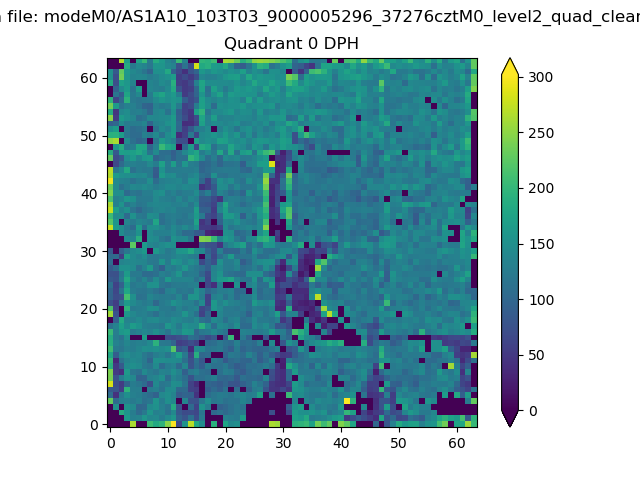 |
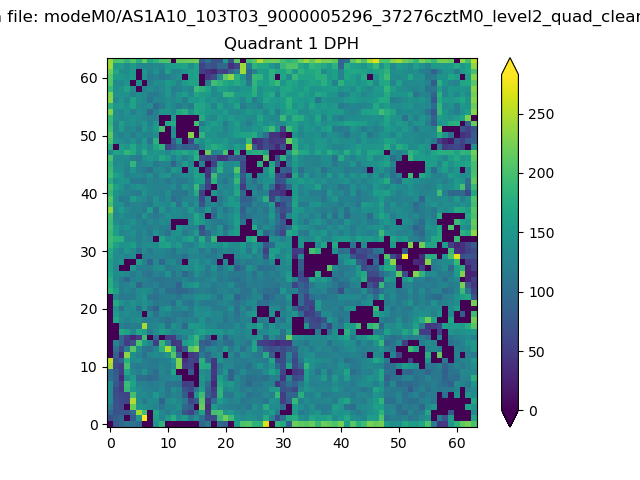 |
Quadrant B |
|---|---|---|---|
| Quadrant D | 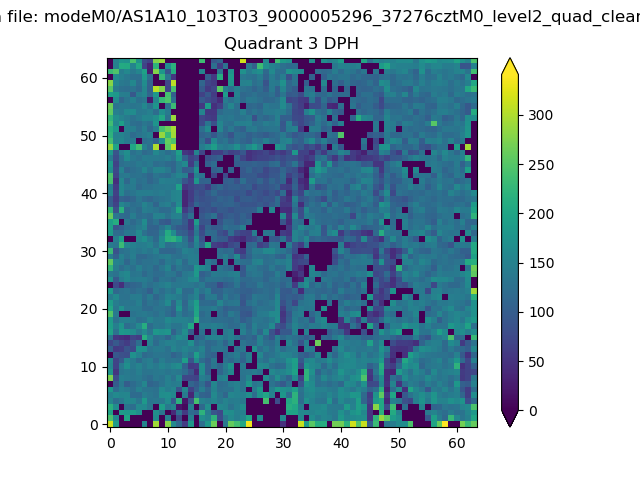 |
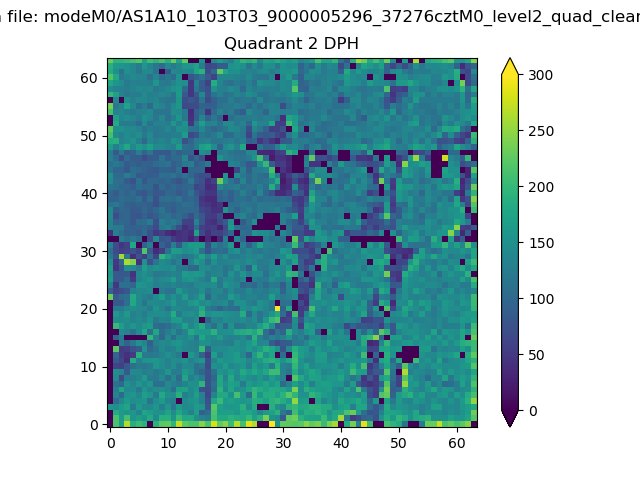 |
Quadrant C |
| Plot type | Count rate plots | Images |
|---|---|---|
| Comparison with Poisson distribution Blue bars denote a histogram of data divided into 1 sec bins. Red curve is a Poisson curve with rate = median count rate of data. |
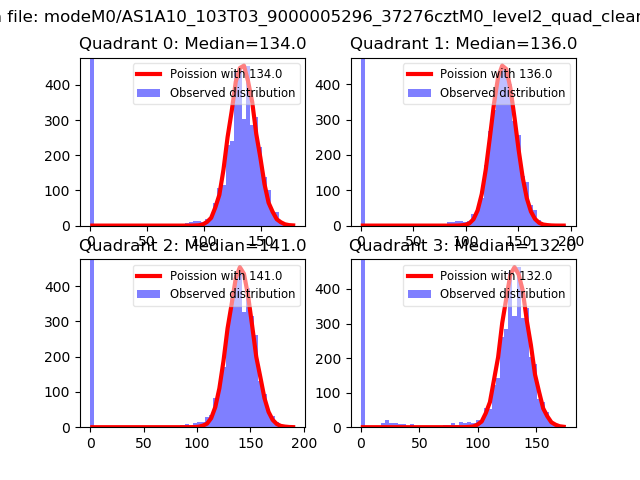 |
 |
| Quadrant-wise count rates Data is divided into 100 sec bins |
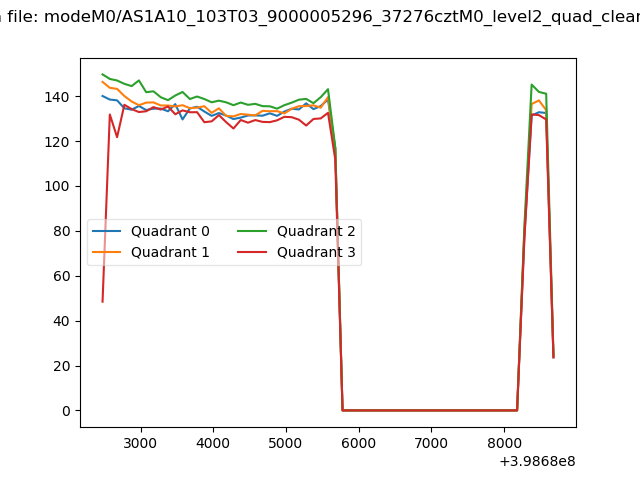 |
|
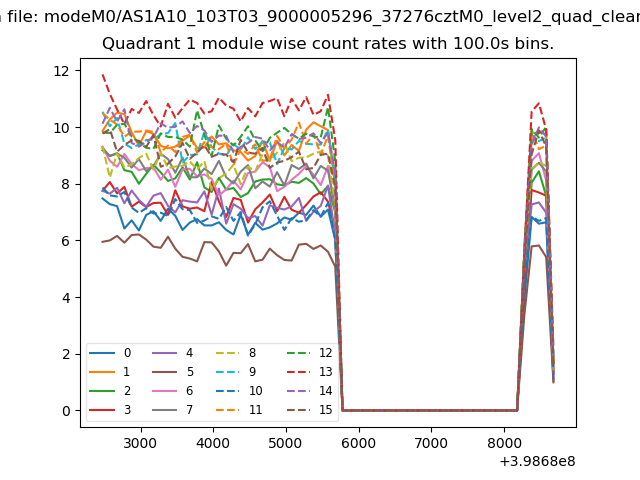
| Module-wise count rates for Quadrant A Data is divided into 100 sec bins |
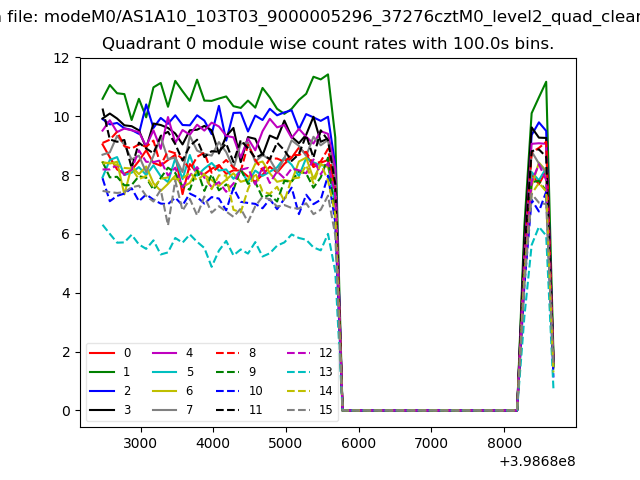 |
 |
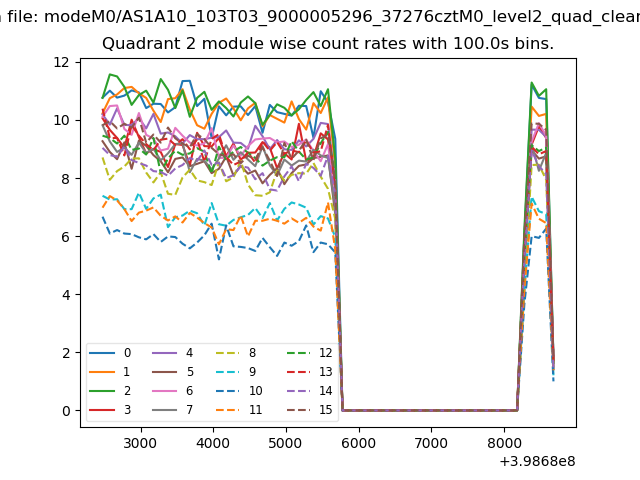
| Module-wise count rates for Quadrant B Data is divided into 100 sec bins |
 |
 |
| Module-wise count rates for Quadrant C Data is divided into 100 sec bins |
 |
 |
| Module-wise count rates for Quadrant D Data is divided into 100 sec bins |
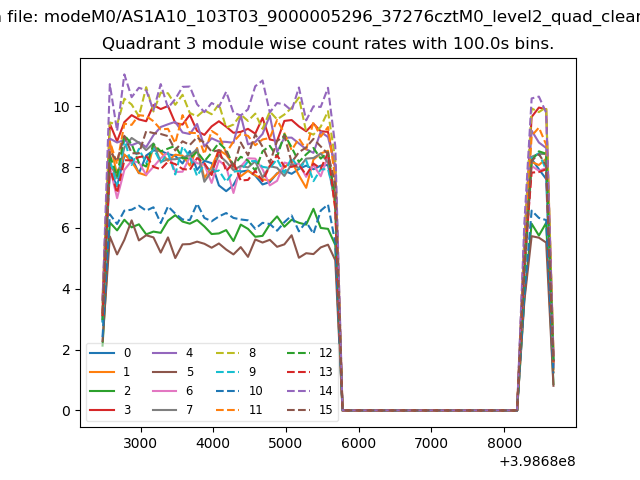 |
 |
| Parameter | Plot |
|---|---|
| CZT HV Monitor | 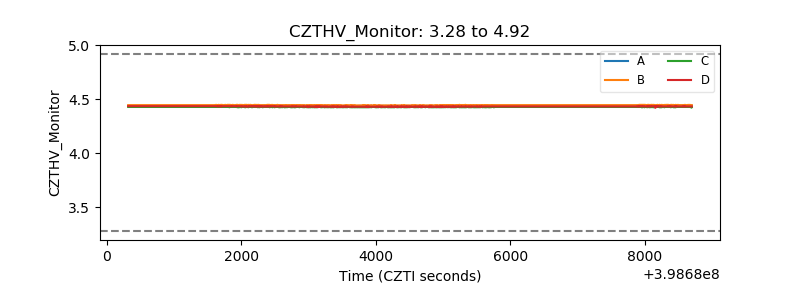 |
| D_VDD | 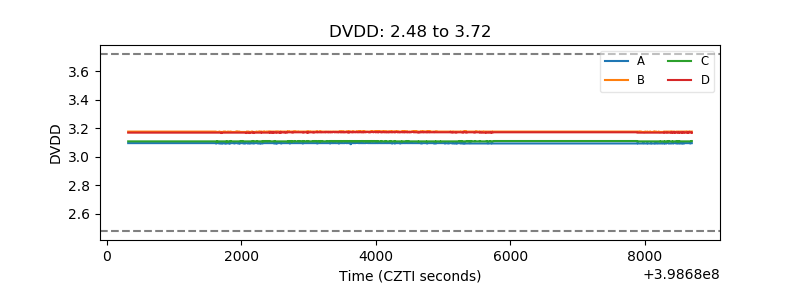 |
| Temperature 1 | 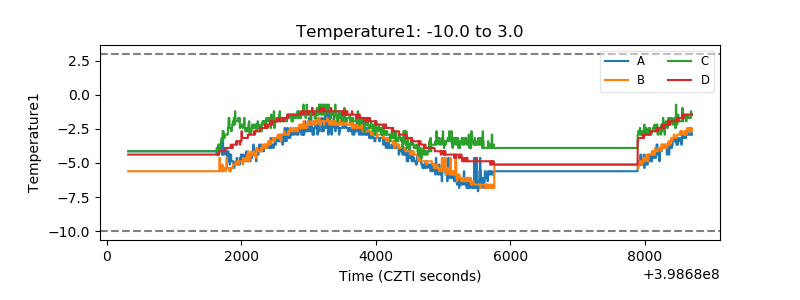 |
| Veto HV Monitor | 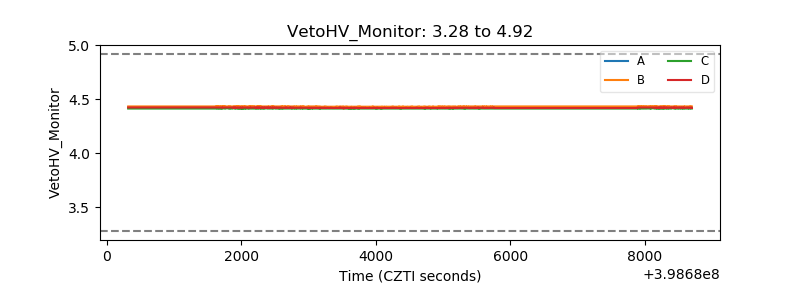 |
| Veto LLD | 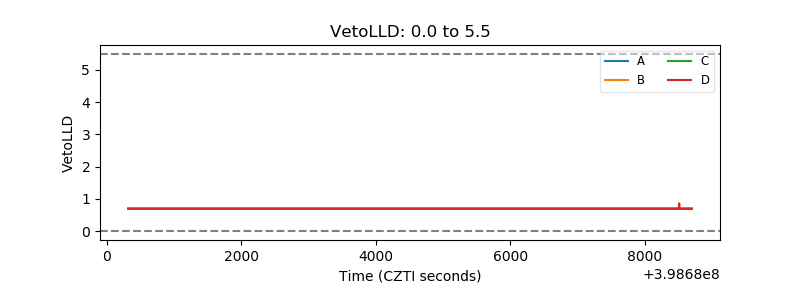 |
| Alpha Counter | 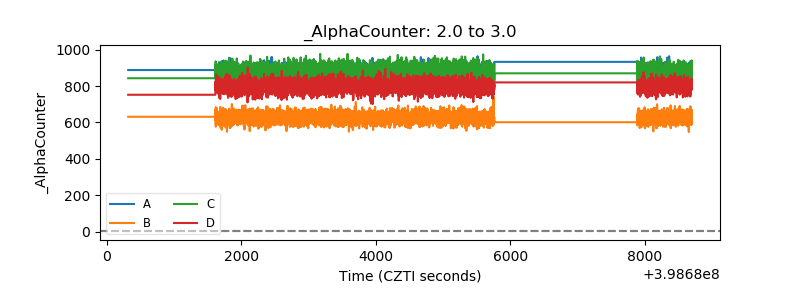 |
| _CPM_Rate | 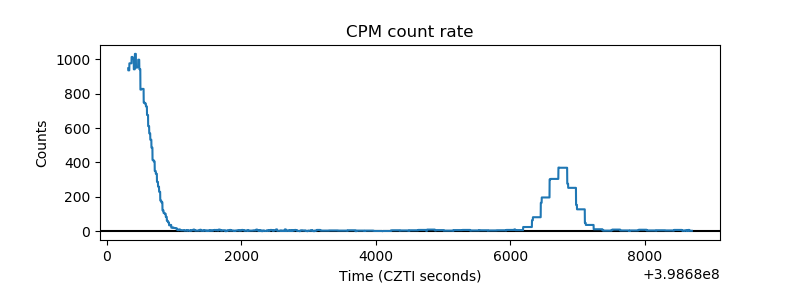 |
| CZT Counter | 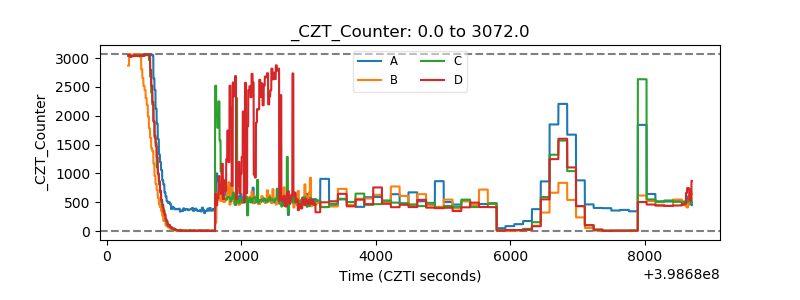 |
| +2.5 Volts monitor | 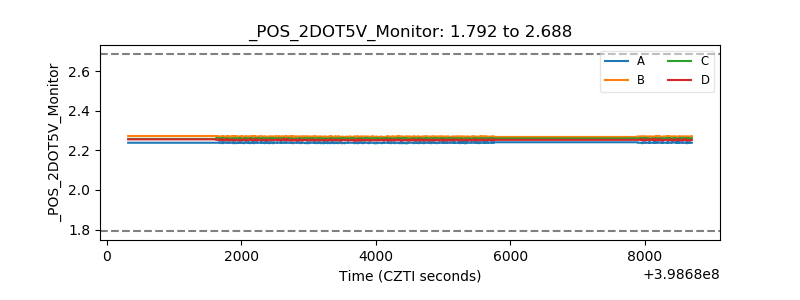 |
| +5 Volts monitor | 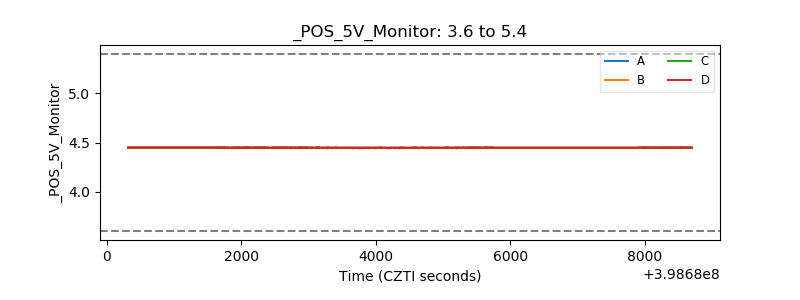 |
| _ROLL_ROT | 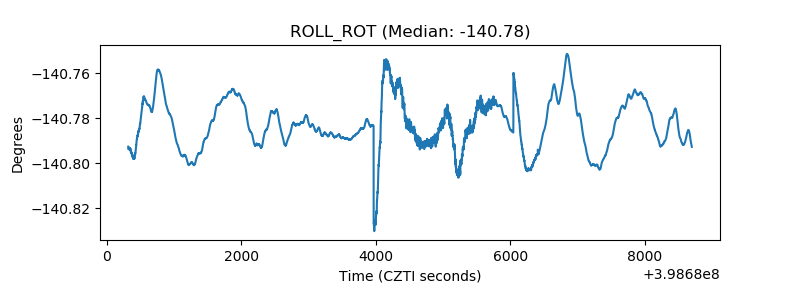 |
| _Roll_DEC | 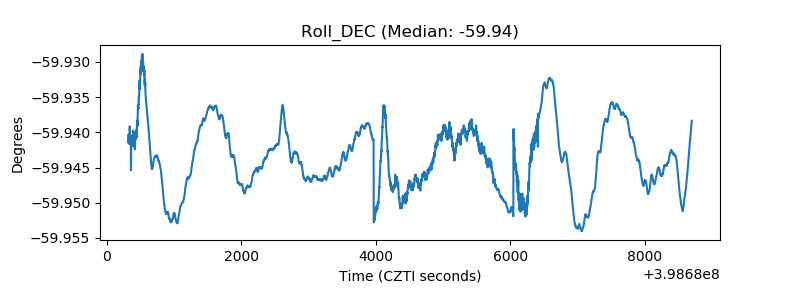 |
| _Roll_RA | 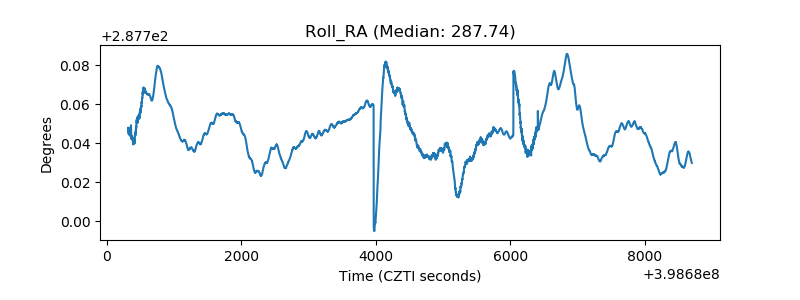 |
| Veto Counter | 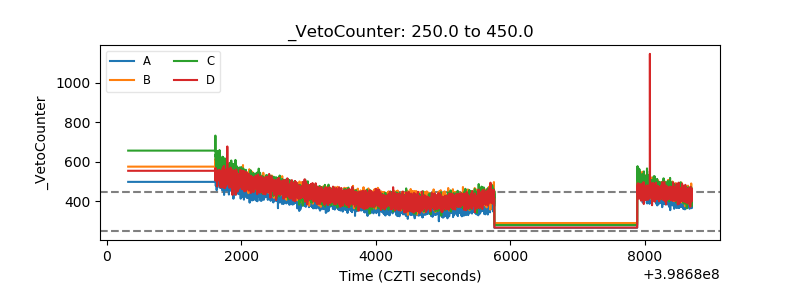 |