| Param | Original file | Final file |
|---|---|---|
| Filename | modeM0/AS1A10_103T03_9000005296_37277cztM0_level2.evt | modeM0/AS1A10_103T03_9000005296_37277cztM0_level2_quad_clean.evt |
| Size (bytes) | 363,769,920 | 89,994,240 |
| Size | 346.9 MB | 85.8 MB |
| Events in quadrant A | 2,618,892 | 588,346 |
| Events in quadrant B | 2,543,891 | 595,362 |
| Events in quadrant C | 2,631,187 | 610,625 |
| Events in quadrant D | 2,877,938 | 576,118 |
| Mode M0 | |||
|---|---|---|---|
| Quadrant | BADHDUFLAG | Total packets | Discarded packets |
| A | 0 | 10923 | 3 |
| B | 0 | 10827 | 2 |
| C | 0 | 10908 | 2 |
| D | 0 | 11973 | 2 |
| Mode SS | |||
|---|---|---|---|
| Quadrant | BADHDUFLAG | Total packets | Discarded packets |
| A | 0 | 104 | 0 |
| B | 0 | 104 | 0 |
| C | 0 | 104 | 0 |
| D | 0 | 104 | 0 |
| Mode M9 | |||
|---|---|---|---|
| Quadrant | BADHDUFLAG | Total packets | Discarded packets |
| A | 0 | 31 | 0 |
| B | 0 | 31 | 0 |
| C | 0 | 31 | 0 |
| D | 0 | 32 | 0 |
| Quadrant | Total seconds | Saturated seconds | Saturation percentage |
|---|---|---|---|
| A | 5062 | 21 | 0.414856% |
| B | 5062 | 22 | 0.434611% |
| C | 5062 | 70 | 1.382853% |
| D | 5062 | 111 | 2.192809% |
Noise dominated data is calculated using 1-second bins in cleaned event files. If a bin has >2000 counts, and if more than 50% of those come from <1% of pixels, then it is considered to be noise-dominated and hence unusable.
| Quadrant | # 1 sec bins | Bins with >0 counts | Bins with >2000 counts | High rate bins dominated by noise | Noise dominated (total time) | Noise dominated (detector-on time) | Marked lightcurve |
|---|---|---|---|---|---|---|---|
| A | 7034 | 5063 | 7 | 7 | 0.10% | 0.14% | 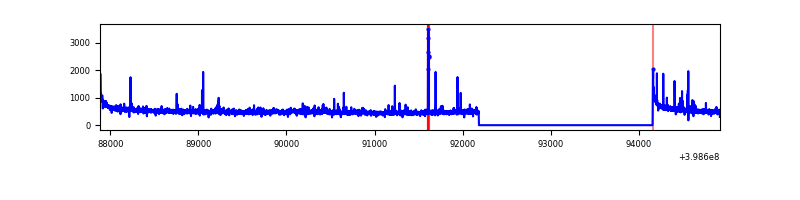 |
| B | 7034 | 5063 | 12 | 12 | 0.17% | 0.24% | 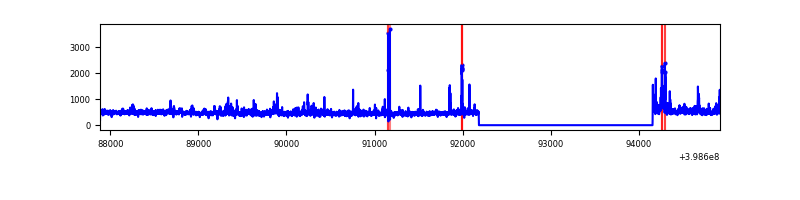 |
| C | 7034 | 5063 | 62 | 62 | 0.88% | 1.22% | 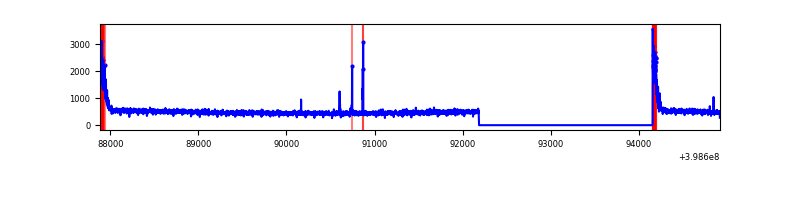 |
| D | 7034 | 5063 | 121 | 121 | 1.72% | 2.39% | 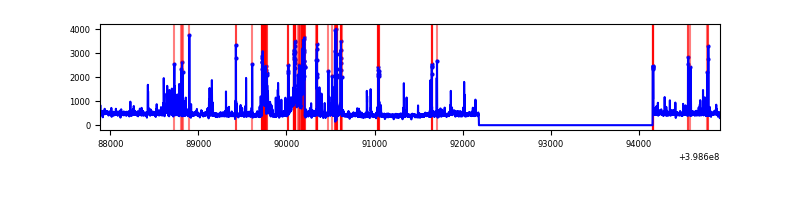 |
Top three noisy pixels from each quadrant. If the there are fewer than three noisy pixels in the level2.evt file, extra rows are filled as -1
| Pixel properties | Quadrant properties | ||||||
|---|---|---|---|---|---|---|---|
| Quadrant | DetID | PixID | Counts | Sigma | Mean | Median | Sigma |
| A | 10 | 83 | 260078 | 2273.03 | 572 | 561 | 114.2 |
| A | 9 | 143 | 82045 | 713.69 | 572 | 561 | 114.2 |
| A | 13 | 248 | 47615 | 412.13 | 572 | 561 | 114.2 |
| B | 5 | 172 | 91444 | 846.45 | 568 | 554 | 107.4 |
| B | 0 | 213 | 89406 | 827.47 | 568 | 554 | 107.4 |
| B | 0 | 190 | 72432 | 669.39 | 568 | 554 | 107.4 |
| C | 15 | 214 | 217093 | 1667.27 | 558 | 565 | 129.9 |
| C | 0 | 10 | 213775 | 1641.72 | 558 | 565 | 129.9 |
| C | 14 | 254 | 16714 | 124.35 | 558 | 565 | 129.9 |
| D | 13 | 249 | 411483 | 3077.19 | 557 | 543 | 133.5 |
| D | 12 | 218 | 154470 | 1152.63 | 557 | 543 | 133.5 |
| D | 10 | 199 | 39984 | 295.34 | 557 | 543 | 133.5 |
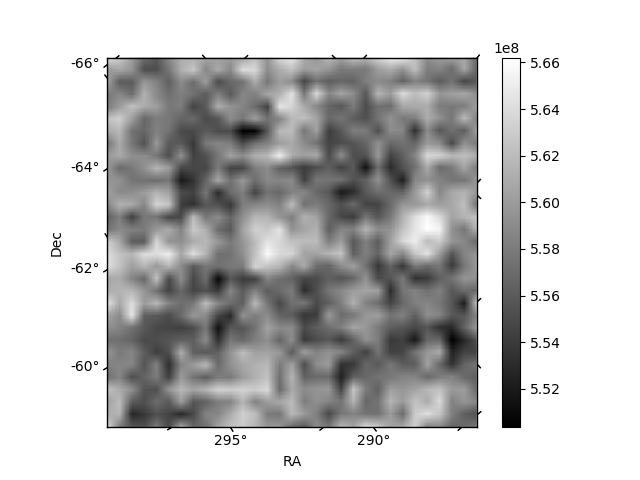
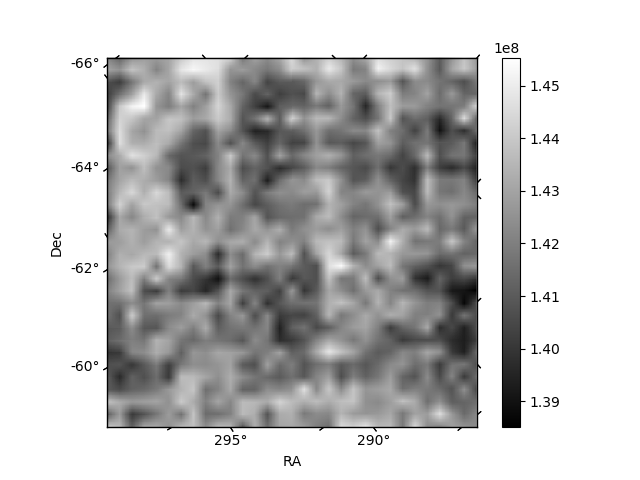
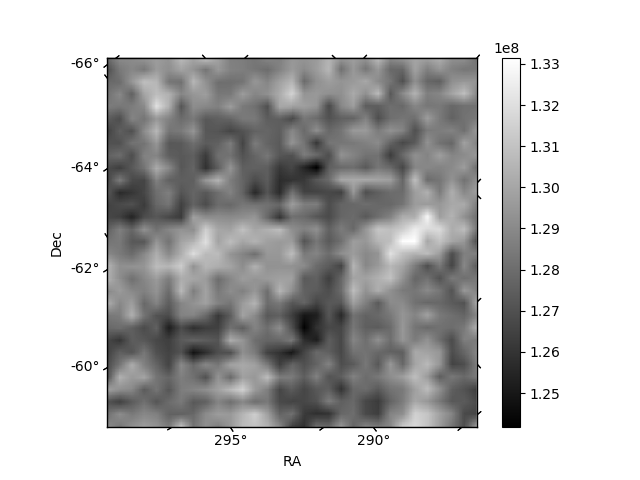
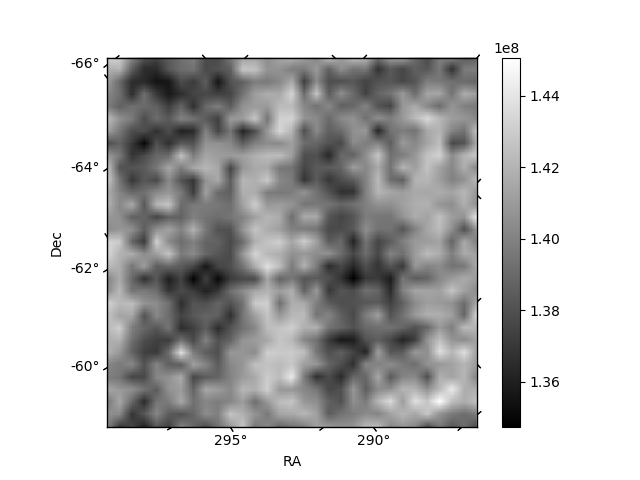
Histogram calculated using DETX and DETY for each event in the final _common_clean file
| Quadrant A | 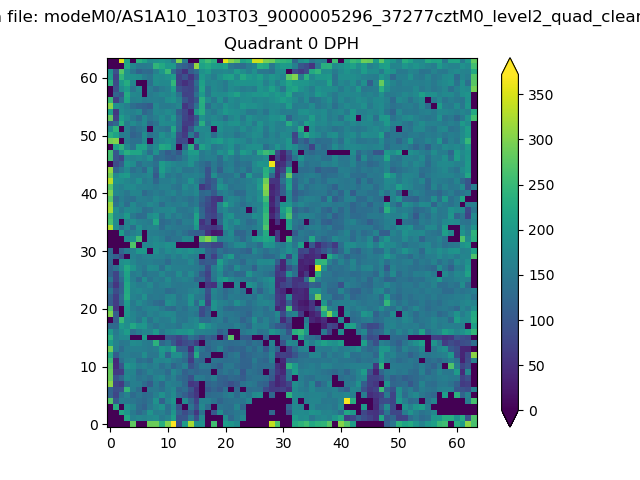 |
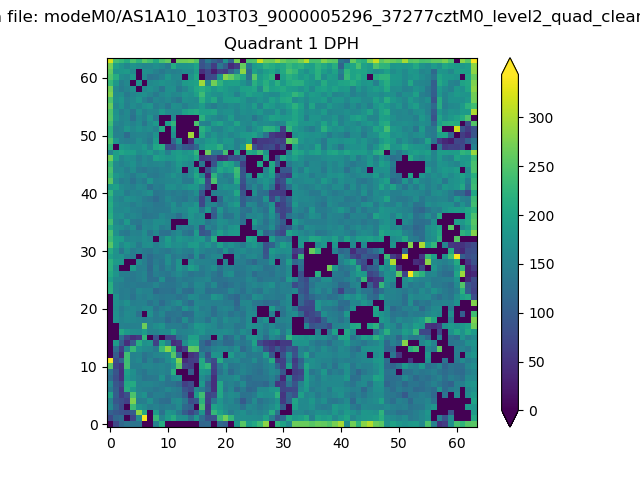 |
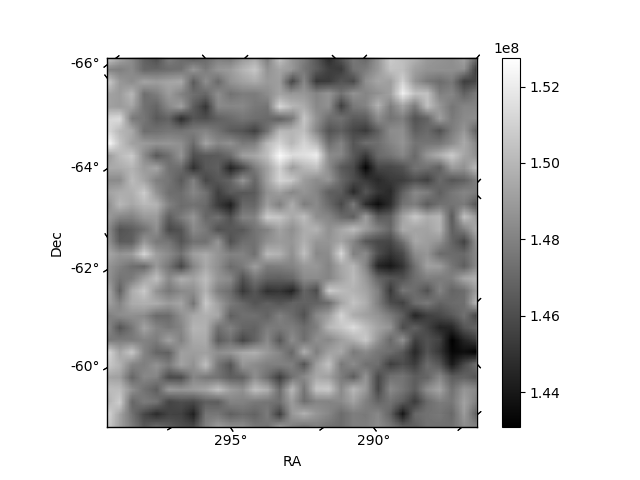
Quadrant B |
|---|---|---|---|
| Quadrant D | 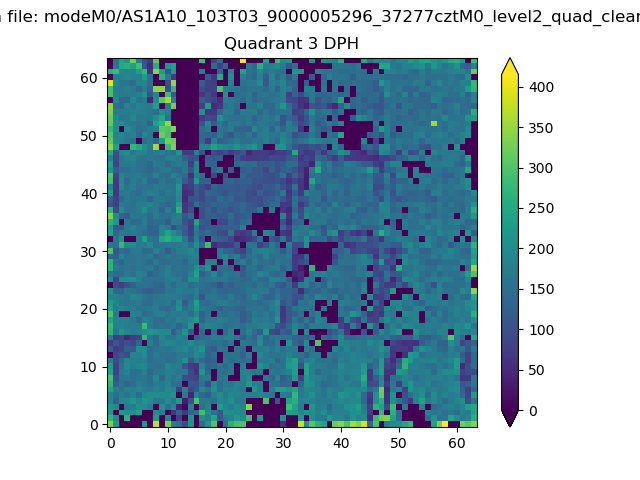 |
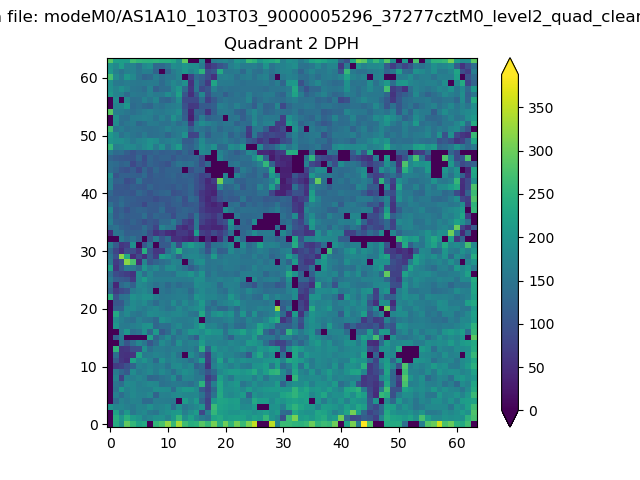 |
Quadrant C |
| Plot type | Count rate plots | Images |
|---|---|---|
| Comparison with Poisson distribution Blue bars denote a histogram of data divided into 1 sec bins. Red curve is a Poisson curve with rate = median count rate of data. |
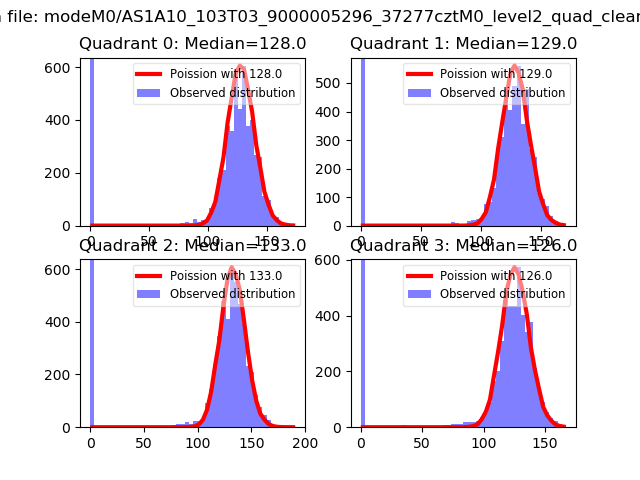 |
 |
| Quadrant-wise count rates Data is divided into 100 sec bins |
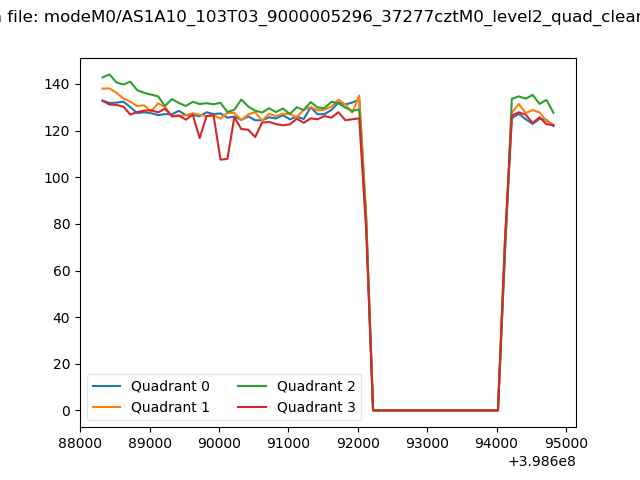 |
|
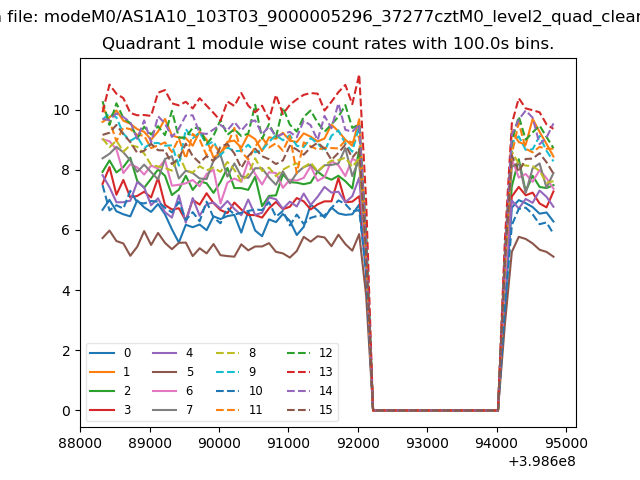
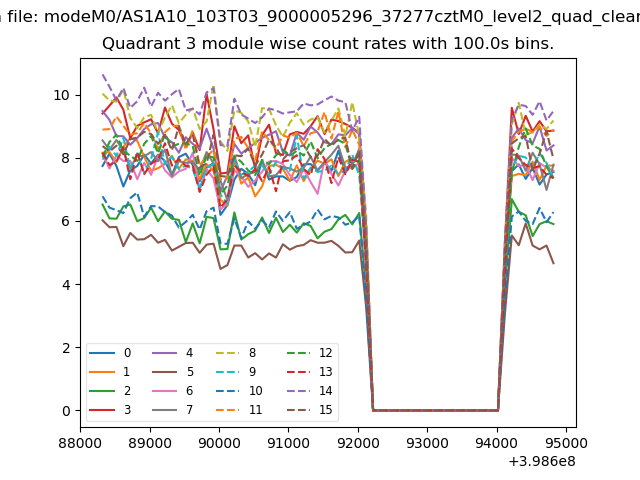
| Module-wise count rates for Quadrant A Data is divided into 100 sec bins |
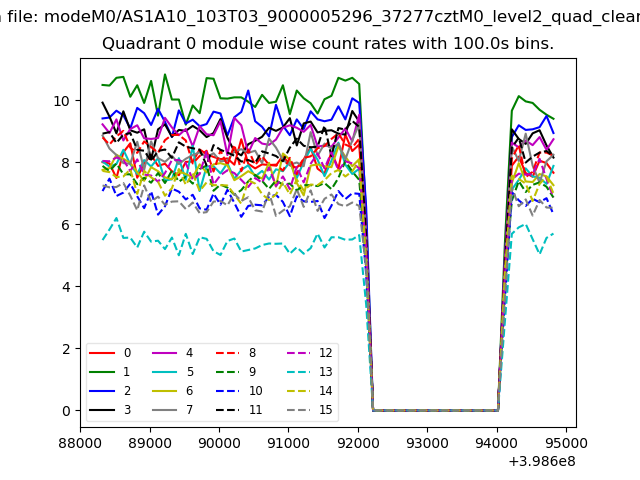 |
 |
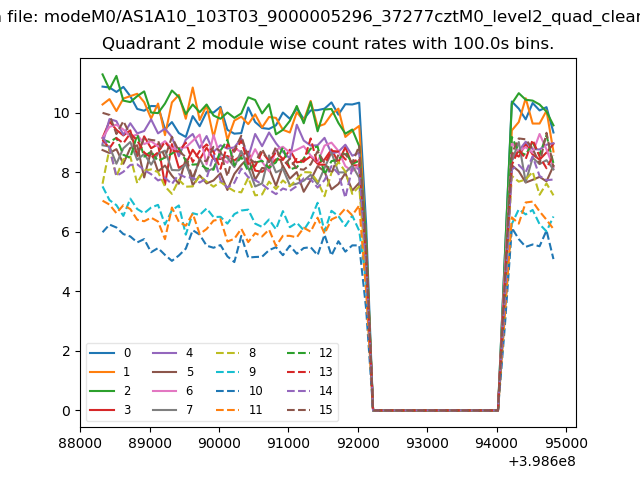
| Module-wise count rates for Quadrant B Data is divided into 100 sec bins |
 |
 |
| Module-wise count rates for Quadrant C Data is divided into 100 sec bins |
 |
 |
| Module-wise count rates for Quadrant D Data is divided into 100 sec bins |
 |
 |
| Parameter | Plot |
|---|---|
| CZT HV Monitor | 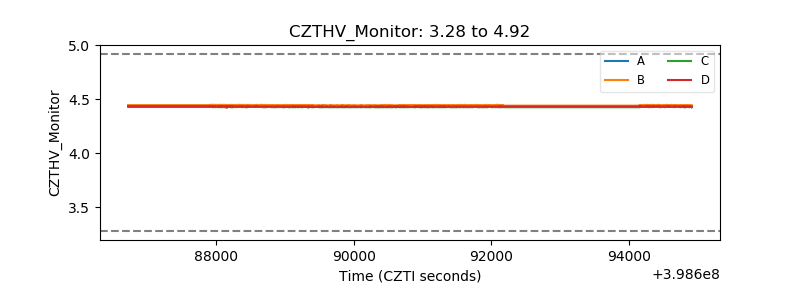 |
| D_VDD | 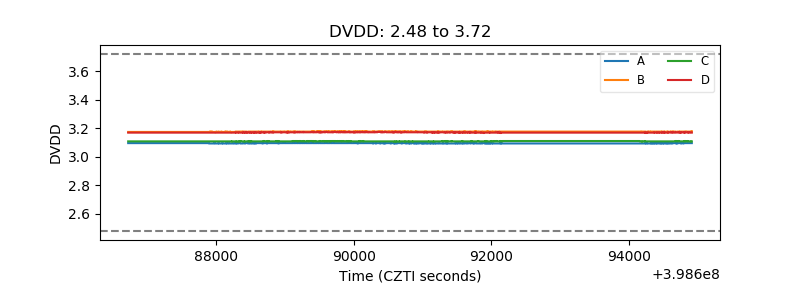 |
| Temperature 1 | 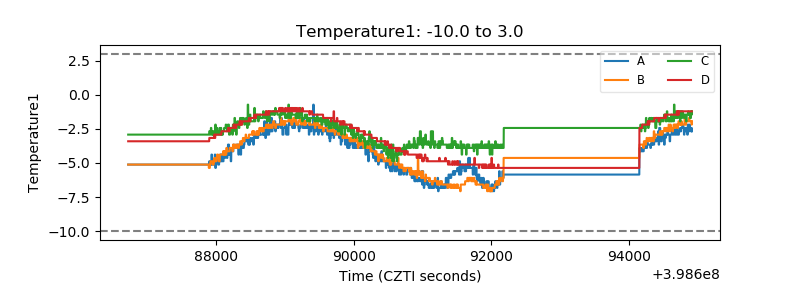 |
| Veto HV Monitor | 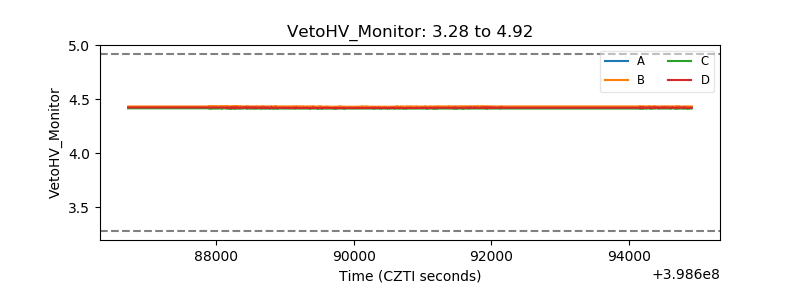 |
| Veto LLD | 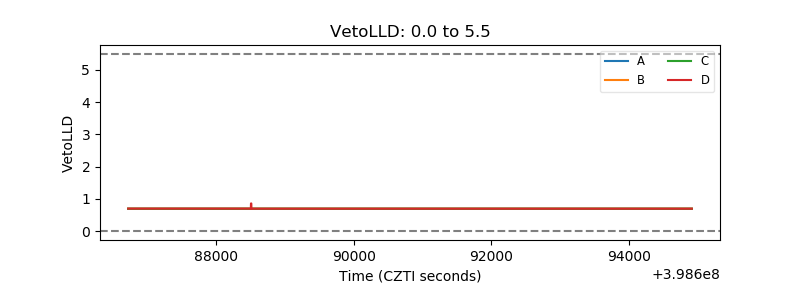 |
| Alpha Counter | 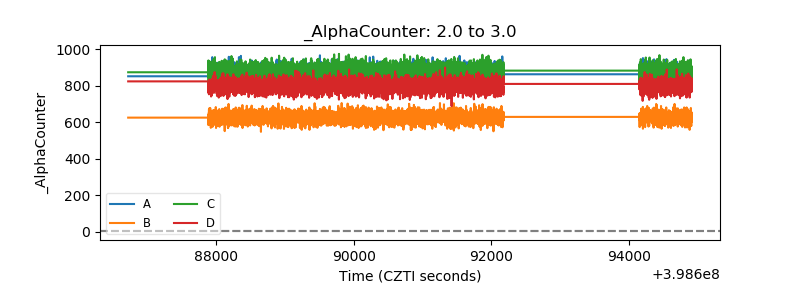 |
| _CPM_Rate | 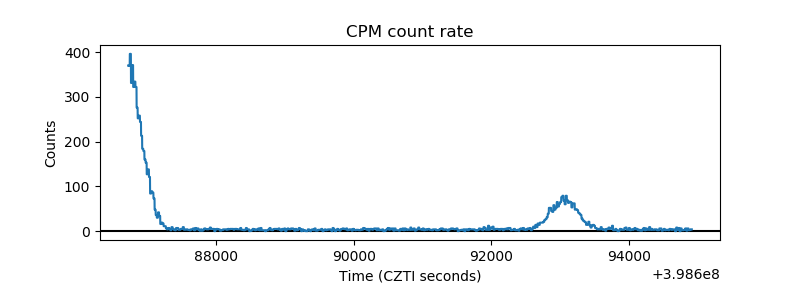 |
| CZT Counter | 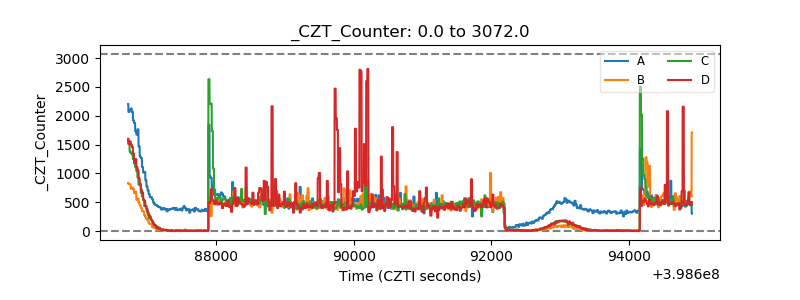 |
| +2.5 Volts monitor | 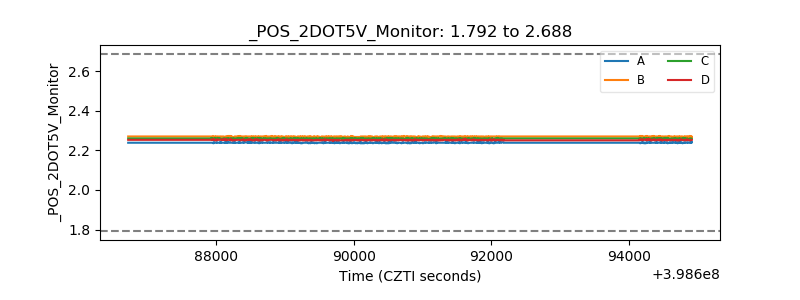 |
| +5 Volts monitor | 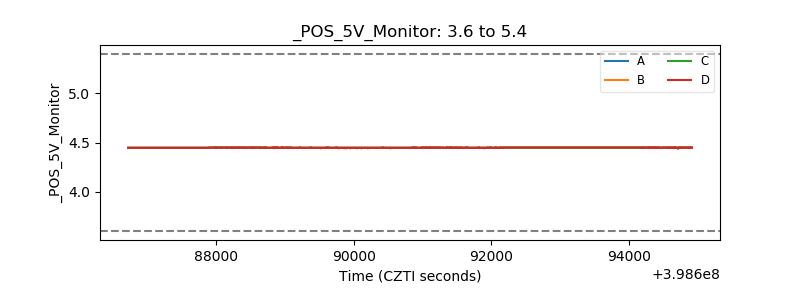 |
| _ROLL_ROT | 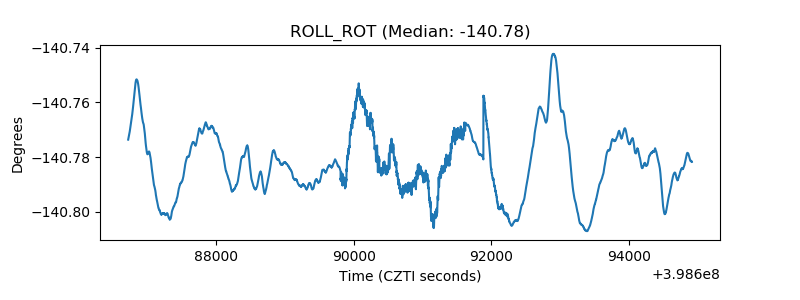 |
| _Roll_DEC | 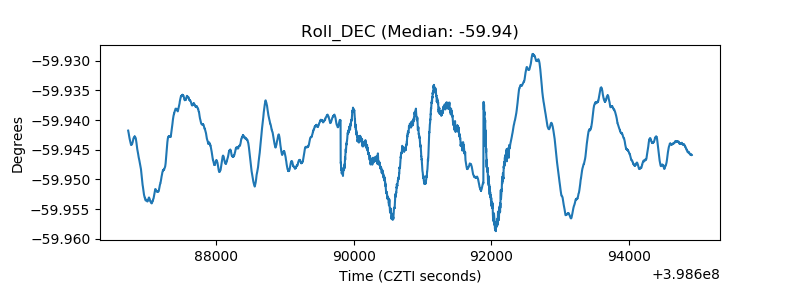 |
| _Roll_RA | 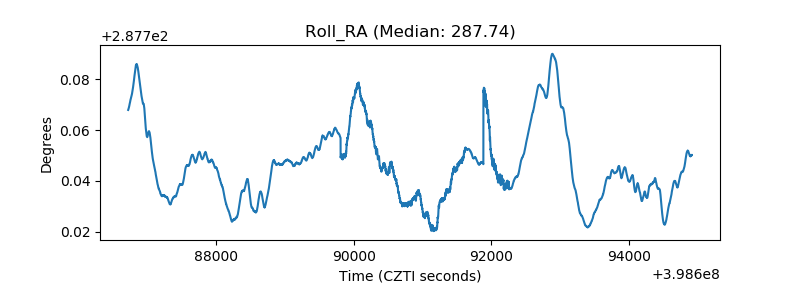 |
| Veto Counter | 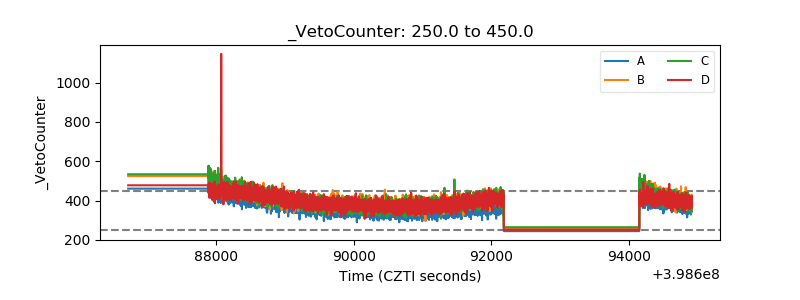 |