| Param | Original file | Final file |
|---|---|---|
| Filename | modeM0/AS1A10_103T03_9000005296_37279cztM0_level2.evt | modeM0/AS1A10_103T03_9000005296_37279cztM0_level2_quad_clean.evt |
| Size (bytes) | 461,903,040 | 88,292,160 |
| Size | 440.5 MB | 84.2 MB |
| Events in quadrant A | 2,874,815 | 573,171 |
| Events in quadrant B | 3,191,109 | 573,915 |
| Events in quadrant C | 4,316,106 | 553,264 |
| Events in quadrant D | 3,204,873 | 559,938 |
| Mode M0 | |||
|---|---|---|---|
| Quadrant | BADHDUFLAG | Total packets | Discarded packets |
| A | 0 | 12443 | 3 |
| B | 0 | 13426 | 2 |
| C | 0 | 16589 | 2 |
| D | 0 | 13753 | 2 |
| Mode SS | |||
|---|---|---|---|
| Quadrant | BADHDUFLAG | Total packets | Discarded packets |
| A | 0 | 120 | 0 |
| B | 0 | 120 | 0 |
| C | 0 | 120 | 0 |
| D | 0 | 120 | 0 |
| Mode M9 | |||
|---|---|---|---|
| Quadrant | BADHDUFLAG | Total packets | Discarded packets |
| A | 0 | 14 | 0 |
| B | 0 | 14 | 0 |
| C | 0 | 14 | 0 |
| D | 0 | 14 | 0 |
| Quadrant | Total seconds | Saturated seconds | Saturation percentage |
|---|---|---|---|
| A | 5917 | 14 | 0.236606% |
| B | 5917 | 36 | 0.608416% |
| C | 5917 | 483 | 8.162920% |
| D | 5917 | 97 | 1.639344% |
Noise dominated data is calculated using 1-second bins in cleaned event files. If a bin has >2000 counts, and if more than 50% of those come from <1% of pixels, then it is considered to be noise-dominated and hence unusable.
| Quadrant | # 1 sec bins | Bins with >0 counts | Bins with >2000 counts | High rate bins dominated by noise | Noise dominated (total time) | Noise dominated (detector-on time) | Marked lightcurve |
|---|---|---|---|---|---|---|---|
| A | 7530 | 6125 | 6 | 6 | 0.08% | 0.10% | 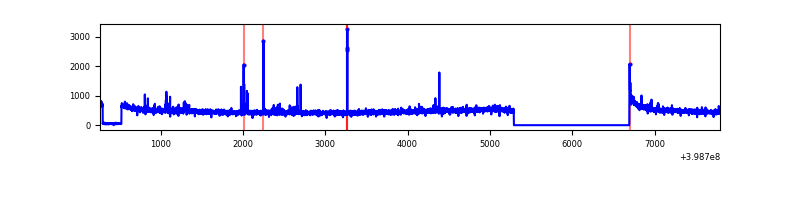 |
| B | 7530 | 6125 | 20 | 20 | 0.27% | 0.33% | 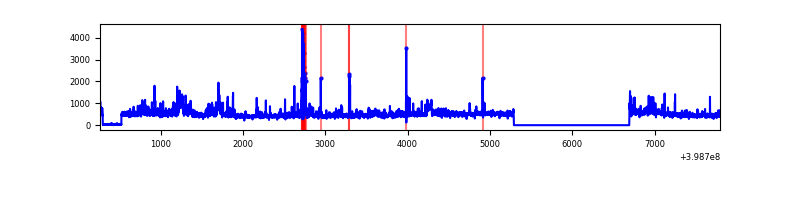 |
| C | 7530 | 6125 | 439 | 439 | 5.83% | 7.17% | 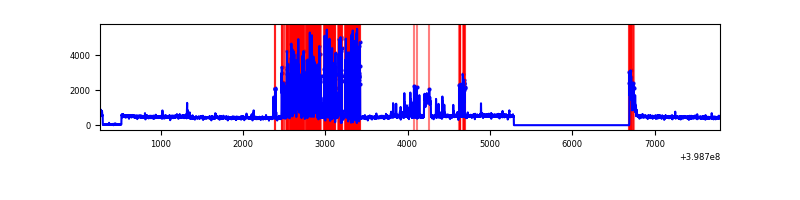 |
| D | 7530 | 6125 | 88 | 88 | 1.17% | 1.44% | 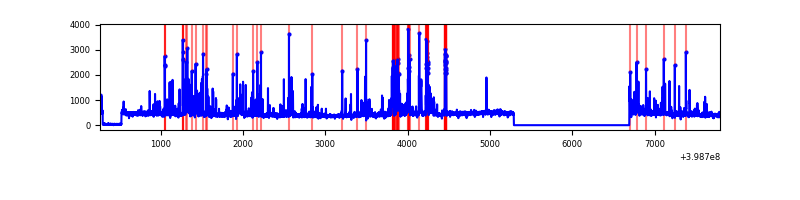 |
Top three noisy pixels from each quadrant. If the there are fewer than three noisy pixels in the level2.evt file, extra rows are filled as -1
| Pixel properties | Quadrant properties | ||||||
|---|---|---|---|---|---|---|---|
| Quadrant | DetID | PixID | Counts | Sigma | Mean | Median | Sigma |
| A | 10 | 83 | 276580 | 2096.29 | 651 | 639 | 131.6 |
| A | 13 | 248 | 31496 | 234.42 | 651 | 639 | 131.6 |
| A | 9 | 143 | 30568 | 227.37 | 651 | 639 | 131.6 |
| B | 0 | 213 | 217823 | 1751.04 | 647 | 631 | 124.0 |
| B | 0 | 190 | 152667 | 1225.74 | 647 | 631 | 124.0 |
| B | 5 | 172 | 111289 | 892.14 | 647 | 631 | 124.0 |
| C | 1 | 23 | 1546371 | 10833.51 | 610 | 614 | 142.7 |
| C | 15 | 214 | 242389 | 1694.49 | 610 | 614 | 142.7 |
| C | 0 | 10 | 109226 | 761.21 | 610 | 614 | 142.7 |
| D | 12 | 218 | 246136 | 1597.19 | 630 | 611 | 153.7 |
| D | 12 | 17 | 192842 | 1250.5 | 630 | 611 | 153.7 |
| D | 13 | 249 | 184031 | 1193.19 | 630 | 611 | 153.7 |
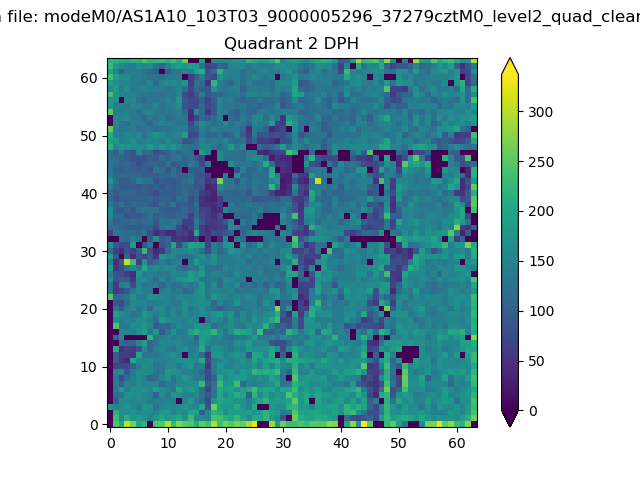
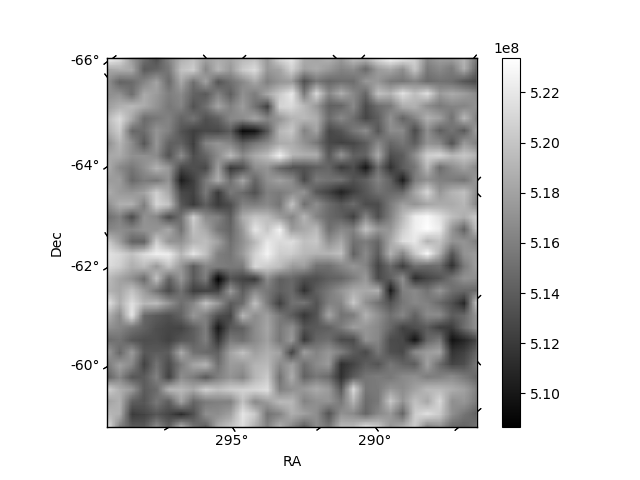
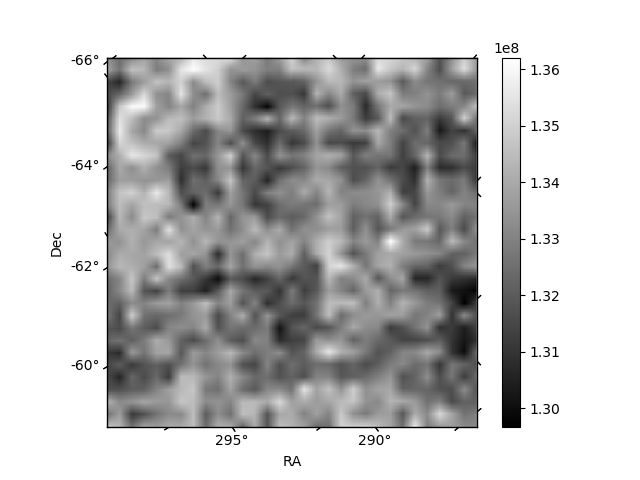
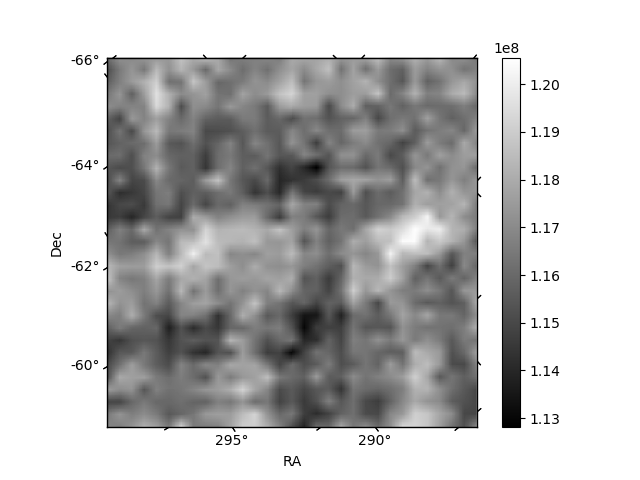
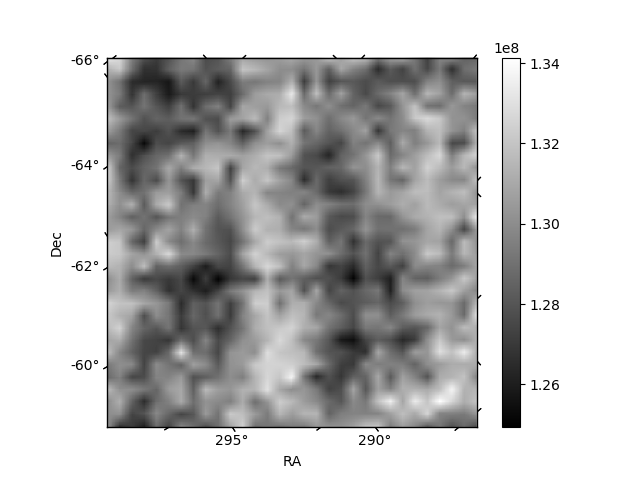
Histogram calculated using DETX and DETY for each event in the final _common_clean file
| Quadrant A | 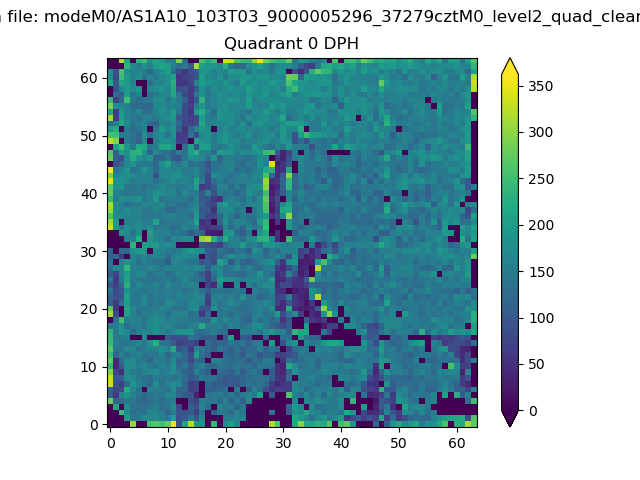 |
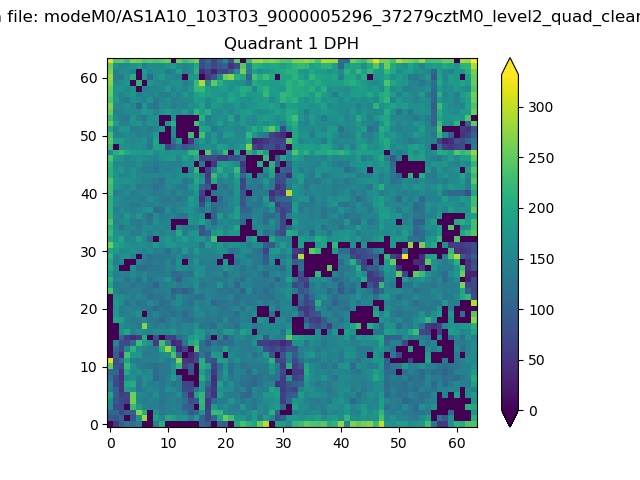 |
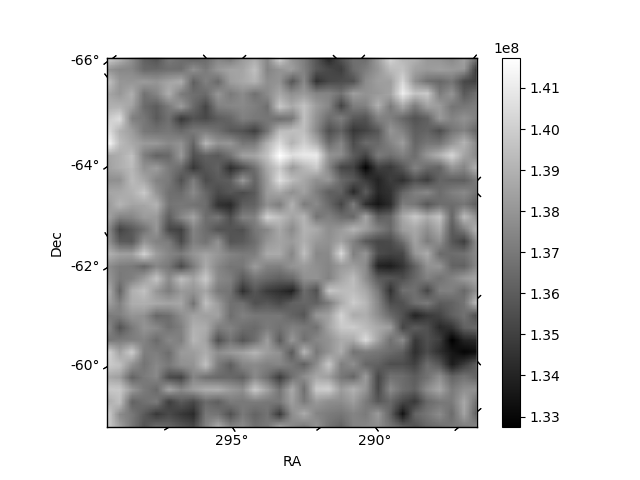
Quadrant B |
|---|---|---|---|
| Quadrant D | 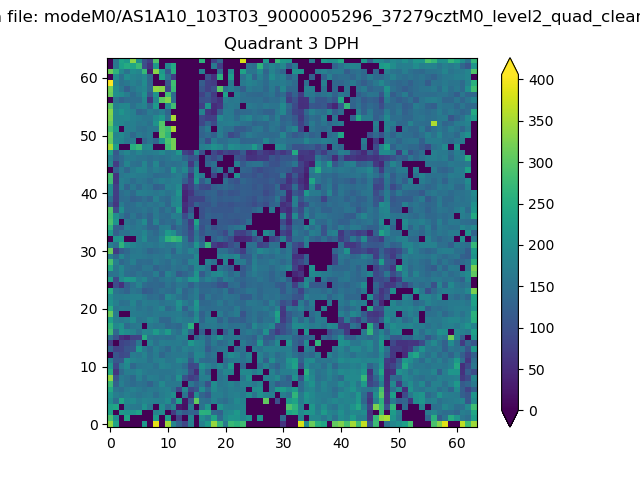 |
 |
Quadrant C |
| Plot type | Count rate plots | Images |
|---|---|---|
| Comparison with Poisson distribution Blue bars denote a histogram of data divided into 1 sec bins. Red curve is a Poisson curve with rate = median count rate of data. |
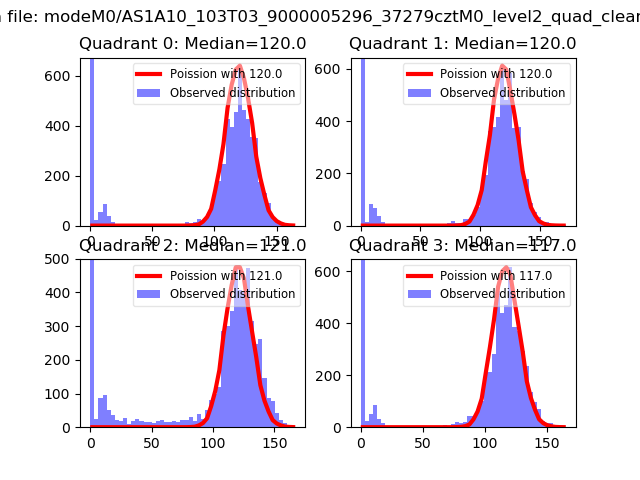 |
 |
| Quadrant-wise count rates Data is divided into 100 sec bins |
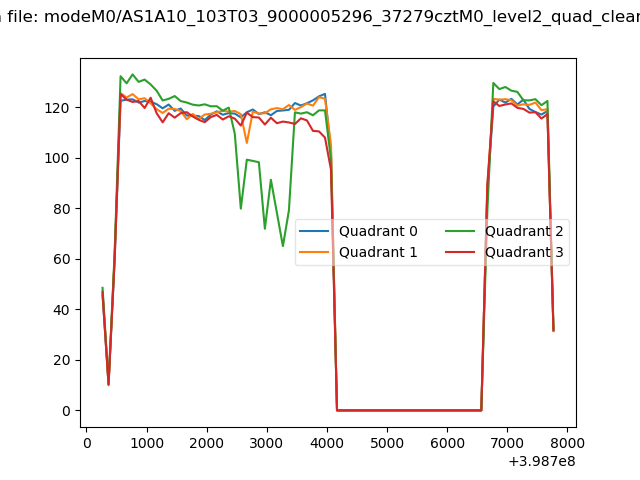 |
|
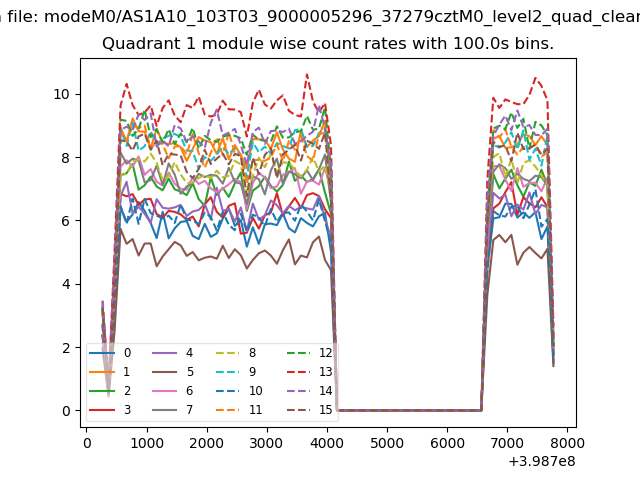
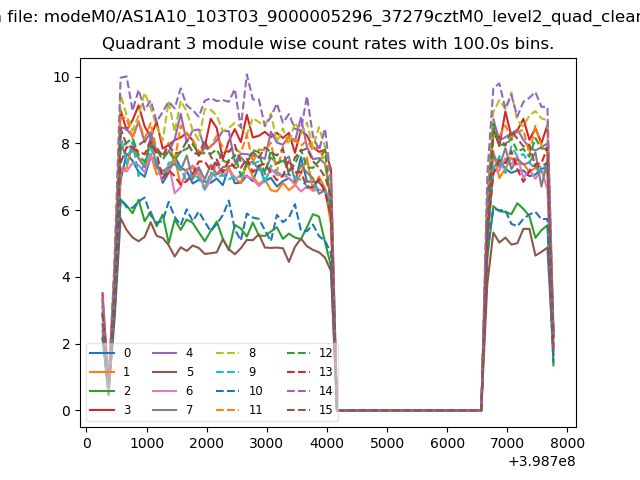
| Module-wise count rates for Quadrant A Data is divided into 100 sec bins |
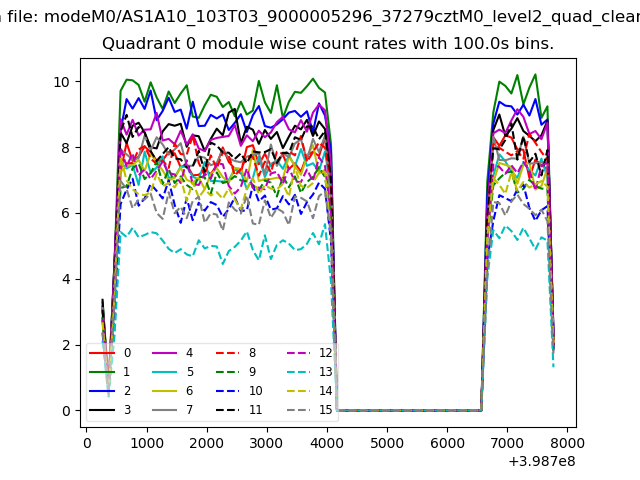 |
 |
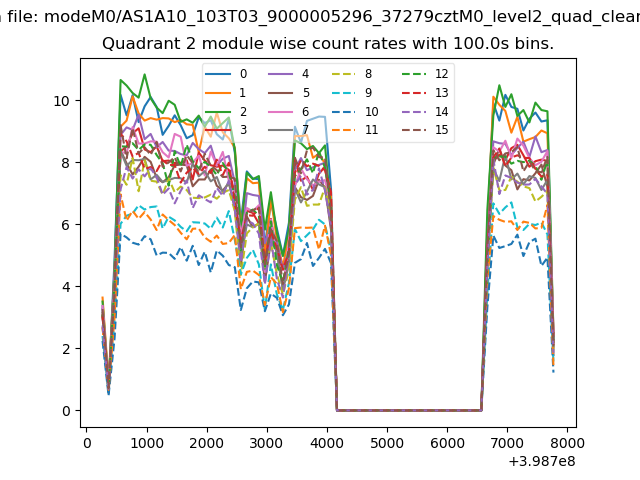
| Module-wise count rates for Quadrant B Data is divided into 100 sec bins |
 |
 |
| Module-wise count rates for Quadrant C Data is divided into 100 sec bins |
 |
 |
| Module-wise count rates for Quadrant D Data is divided into 100 sec bins |
 |
 |
| Parameter | Plot |
|---|---|
| CZT HV Monitor | 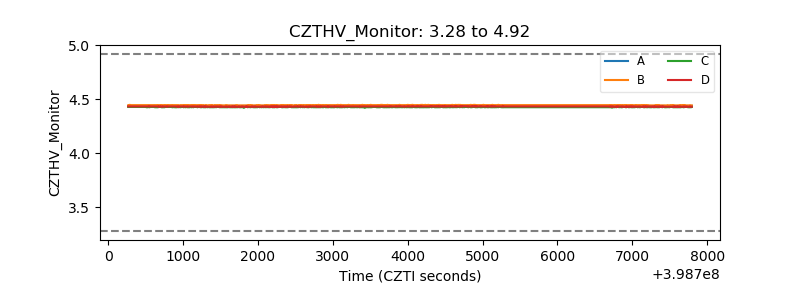 |
| D_VDD | 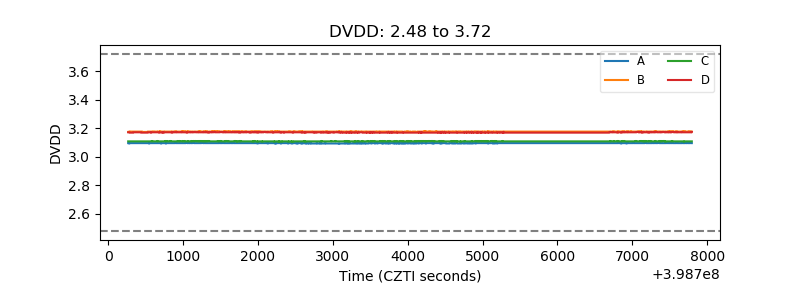 |
| Temperature 1 | 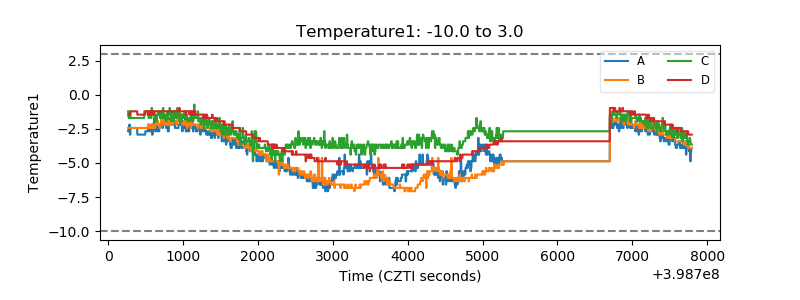 |
| Veto HV Monitor | 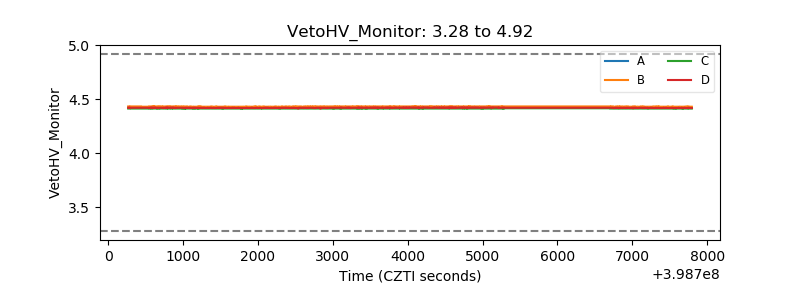 |
| Veto LLD | 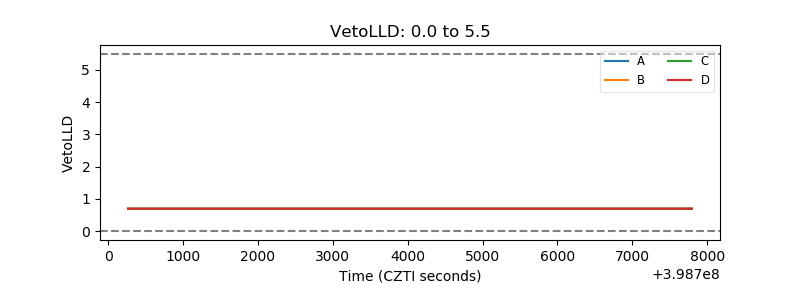 |
| Alpha Counter | 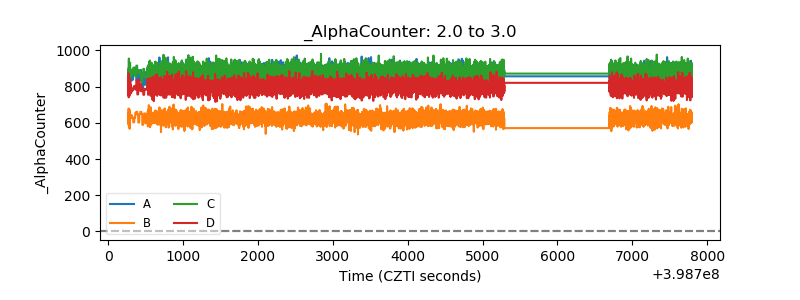 |
| _CPM_Rate | 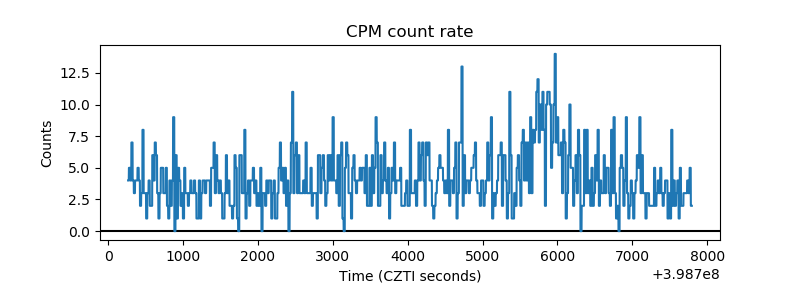 |
| CZT Counter | 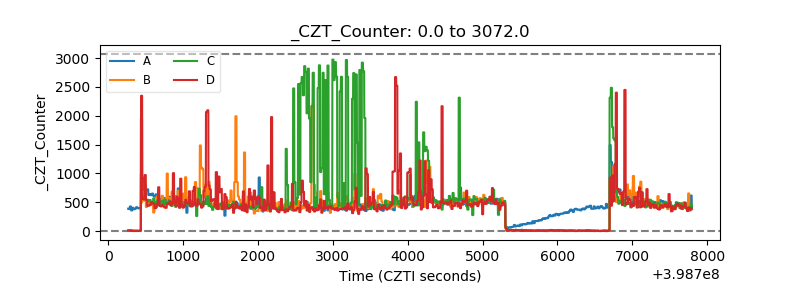 |
| +2.5 Volts monitor | 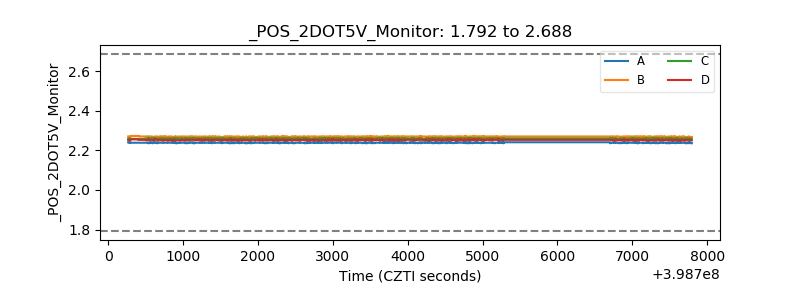 |
| +5 Volts monitor | 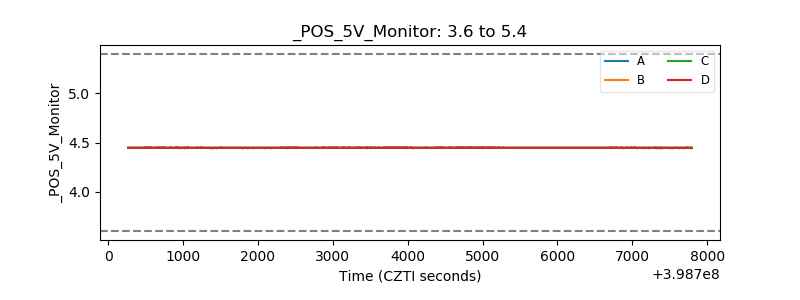 |
| _ROLL_ROT | 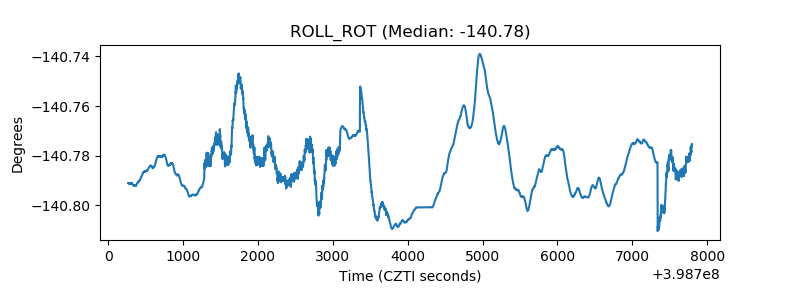 |
| _Roll_DEC | 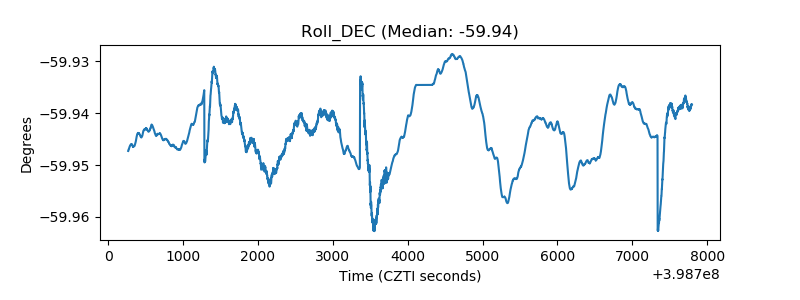 |
| _Roll_RA | 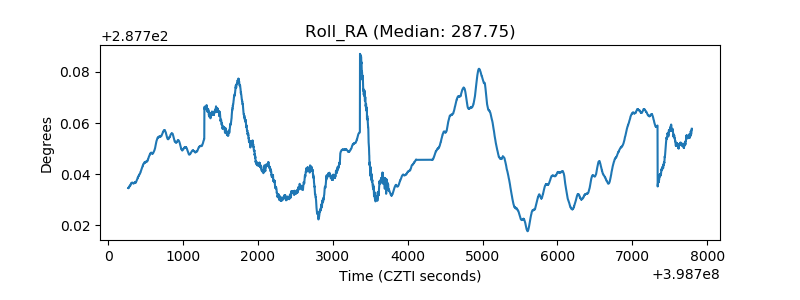 |
| Veto Counter | 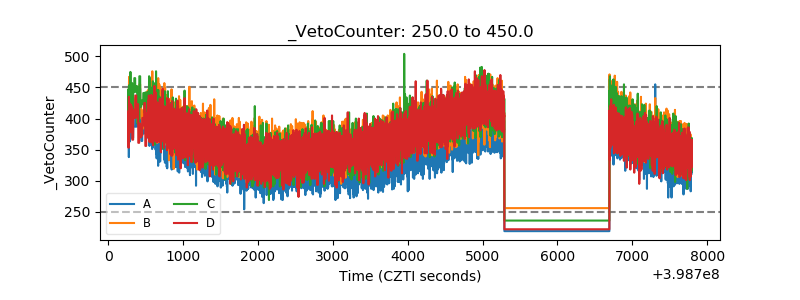 |