| Param | Original file | Final file |
|---|---|---|
| Filename | modeM0/AS1A10_103T03_9000005296_37280cztM0_level2.evt | modeM0/AS1A10_103T03_9000005296_37280cztM0_level2_quad_clean.evt |
| Size (bytes) | 463,173,120 | 82,077,120 |
| Size | 441.7 MB | 78.3 MB |
| Events in quadrant A | 2,940,567 | 518,654 |
| Events in quadrant B | 2,978,152 | 521,068 |
| Events in quadrant C | 3,130,672 | 526,819 |
| Events in quadrant D | 4,567,665 | 497,142 |
| Mode M0 | |||
|---|---|---|---|
| Quadrant | BADHDUFLAG | Total packets | Discarded packets |
| A | 0 | 12715 | 3 |
| B | 0 | 12872 | 2 |
| C | 0 | 13261 | 2 |
| D | 0 | 17998 | 2 |
| Mode SS | |||
|---|---|---|---|
| Quadrant | BADHDUFLAG | Total packets | Discarded packets |
| A | 0 | 122 | 0 |
| B | 0 | 122 | 0 |
| C | 0 | 122 | 0 |
| D | 0 | 122 | 0 |
| Mode M9 | |||
|---|---|---|---|
| Quadrant | BADHDUFLAG | Total packets | Discarded packets |
| A | 0 | 13 | 0 |
| B | 0 | 13 | 0 |
| C | 0 | 13 | 0 |
| D | 0 | 14 | 0 |
| Quadrant | Total seconds | Saturated seconds | Saturation percentage |
|---|---|---|---|
| A | 6041 | 20 | 0.331071% |
| B | 6041 | 29 | 0.480053% |
| C | 6041 | 61 | 1.009767% |
| D | 6041 | 546 | 9.038239% |
Noise dominated data is calculated using 1-second bins in cleaned event files. If a bin has >2000 counts, and if more than 50% of those come from <1% of pixels, then it is considered to be noise-dominated and hence unusable.
| Quadrant | # 1 sec bins | Bins with >0 counts | Bins with >2000 counts | High rate bins dominated by noise | Noise dominated (total time) | Noise dominated (detector-on time) | Marked lightcurve |
|---|---|---|---|---|---|---|---|
| A | 7324 | 6042 | 6 | 6 | 0.08% | 0.10% | 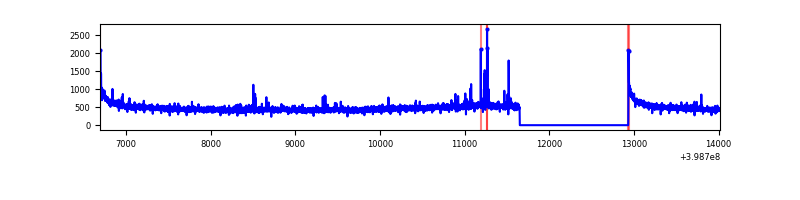 |
| B | 7324 | 6042 | 8 | 8 | 0.11% | 0.13% | 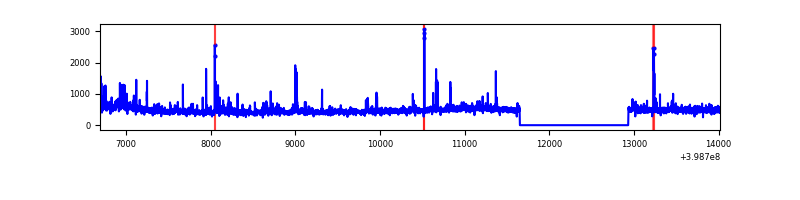 |
| C | 7324 | 6042 | 53 | 53 | 0.72% | 0.88% | 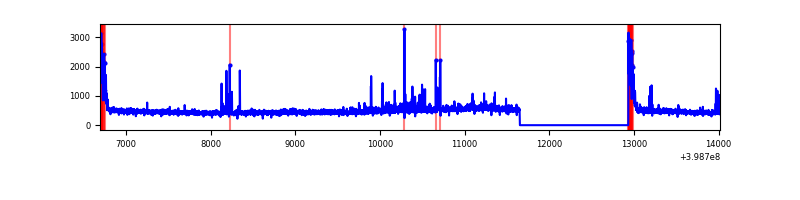 |
| D | 7324 | 6042 | 423 | 423 | 5.78% | 7.00% | 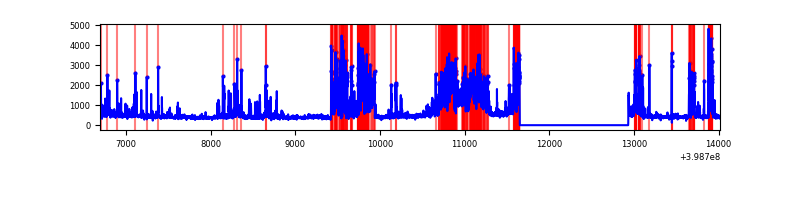 |
Top three noisy pixels from each quadrant. If the there are fewer than three noisy pixels in the level2.evt file, extra rows are filled as -1
| Pixel properties | Quadrant properties | ||||||
|---|---|---|---|---|---|---|---|
| Quadrant | DetID | PixID | Counts | Sigma | Mean | Median | Sigma |
| A | 10 | 83 | 298300 | 2216.17 | 664 | 651 | 134.3 |
| A | 9 | 143 | 33517 | 244.71 | 664 | 651 | 134.3 |
| A | 15 | 222 | 15843 | 113.11 | 664 | 651 | 134.3 |
| B | 0 | 230 | 89120 | 695.87 | 660 | 643 | 127.1 |
| B | 0 | 213 | 77495 | 604.44 | 660 | 643 | 127.1 |
| B | 0 | 190 | 48506 | 376.44 | 660 | 643 | 127.1 |
| C | 15 | 214 | 254608 | 1694.54 | 646 | 653 | 149.9 |
| C | 0 | 10 | 211257 | 1405.28 | 646 | 653 | 149.9 |
| C | 1 | 23 | 80034 | 529.68 | 646 | 653 | 149.9 |
| D | 2 | 249 | 1377638 | 9032.29 | 625 | 607 | 152.5 |
| D | 13 | 249 | 529661 | 3470.2 | 625 | 607 | 152.5 |
| D | 12 | 218 | 77885 | 506.89 | 625 | 607 | 152.5 |
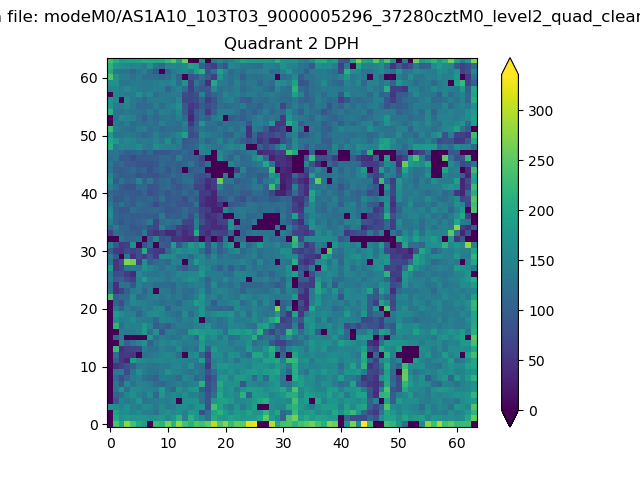
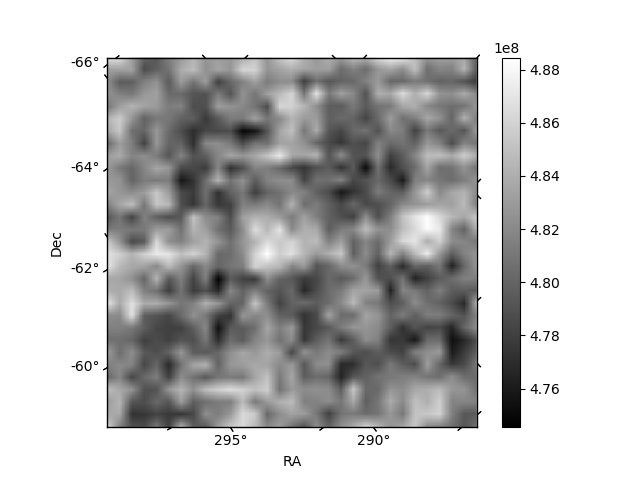
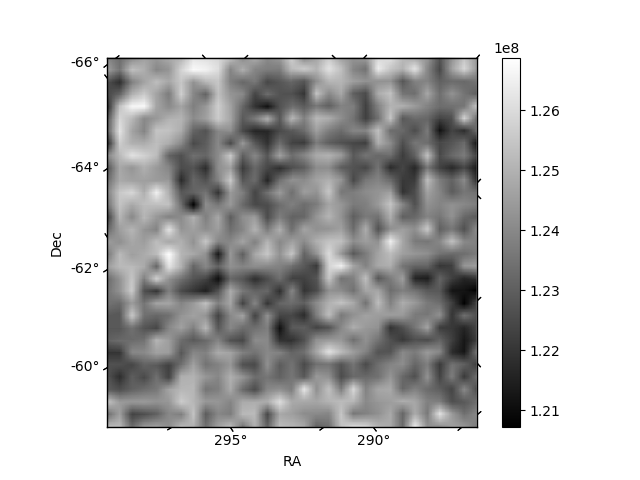
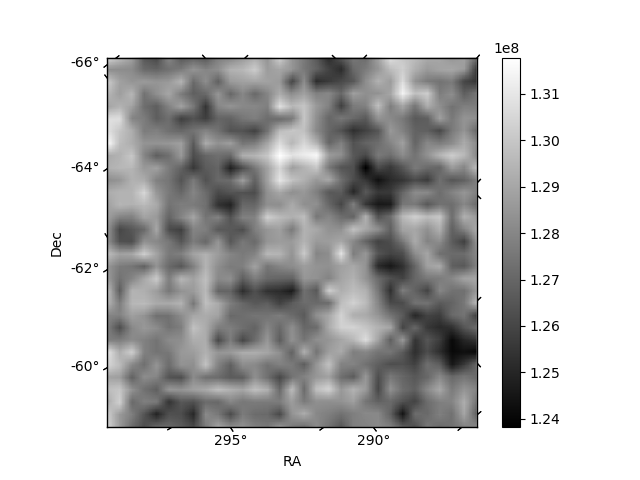
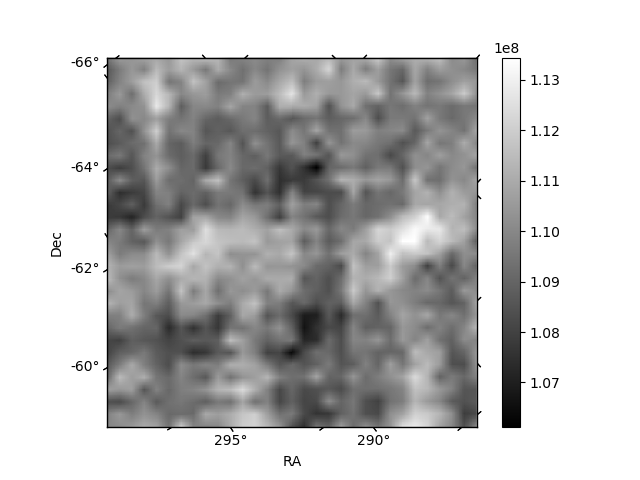
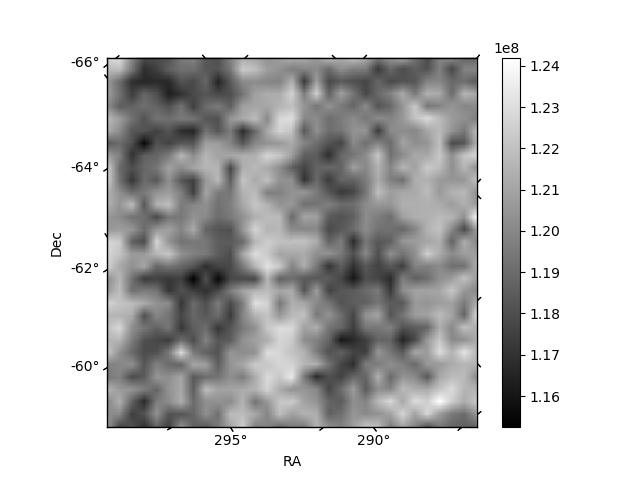
Histogram calculated using DETX and DETY for each event in the final _common_clean file
| Quadrant A | 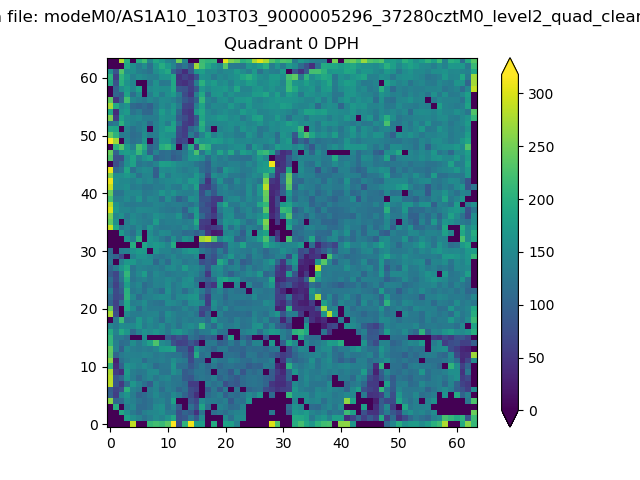 |
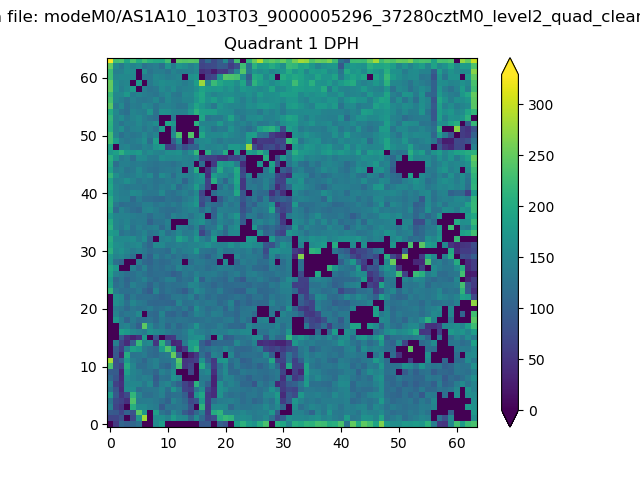 |
Quadrant B |
|---|---|---|---|
| Quadrant D | 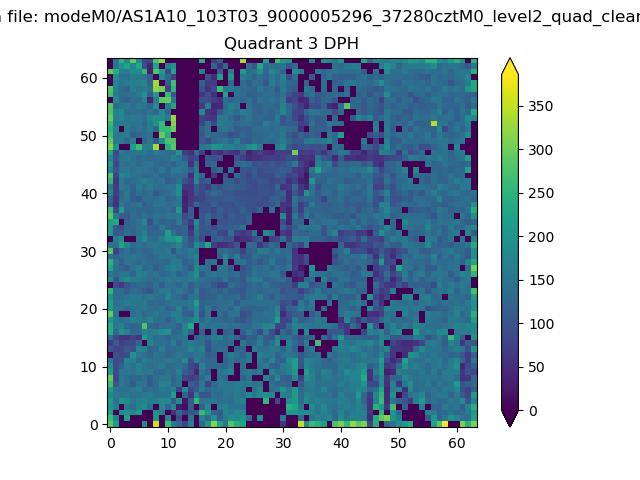 |
 |
Quadrant C |
| Plot type | Count rate plots | Images |
|---|---|---|
| Comparison with Poisson distribution Blue bars denote a histogram of data divided into 1 sec bins. Red curve is a Poisson curve with rate = median count rate of data. |
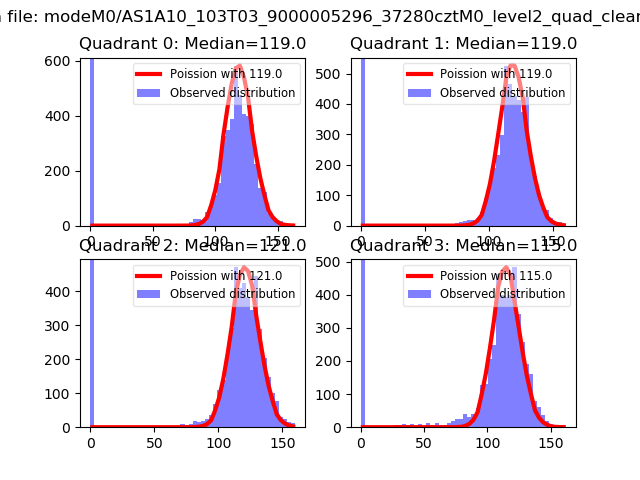 |
 |
| Quadrant-wise count rates Data is divided into 100 sec bins |
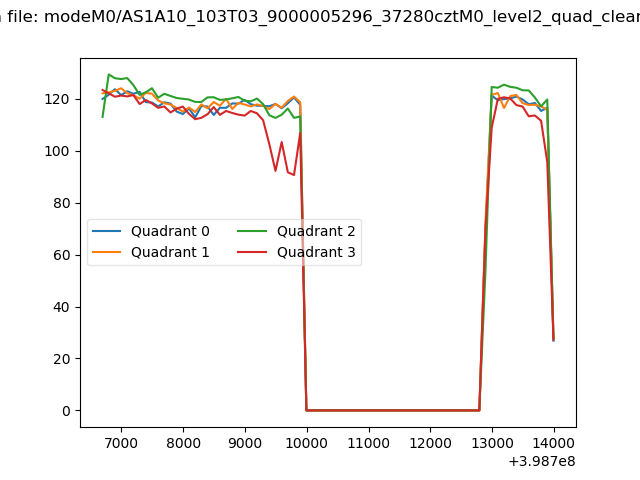 |
|
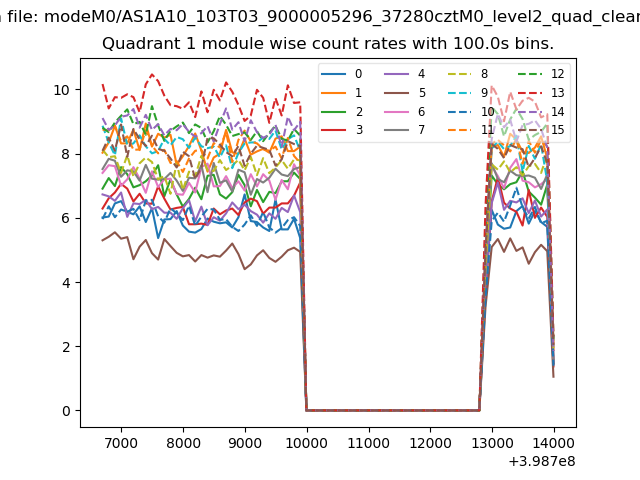
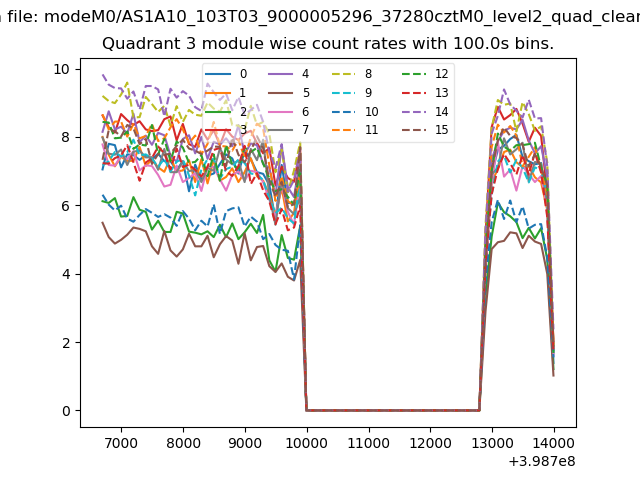
| Module-wise count rates for Quadrant A Data is divided into 100 sec bins |
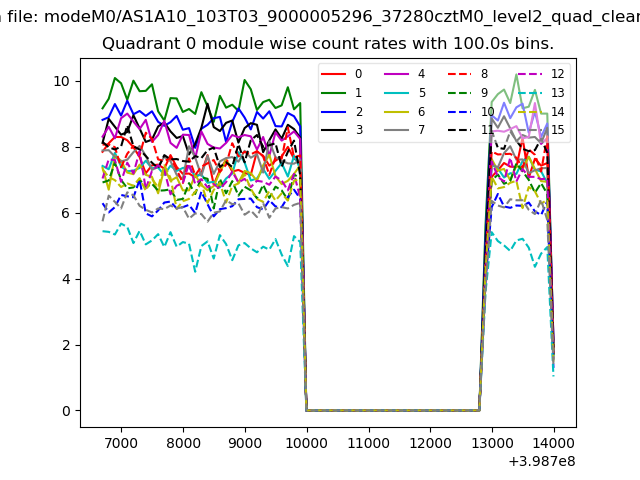 |
 |
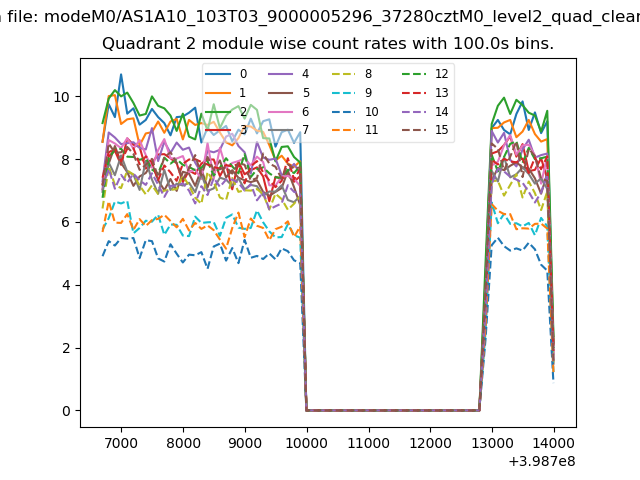
| Module-wise count rates for Quadrant B Data is divided into 100 sec bins |
 |
 |
| Module-wise count rates for Quadrant C Data is divided into 100 sec bins |
 |
 |
| Module-wise count rates for Quadrant D Data is divided into 100 sec bins |
 |
 |
| Parameter | Plot |
|---|---|
| CZT HV Monitor | 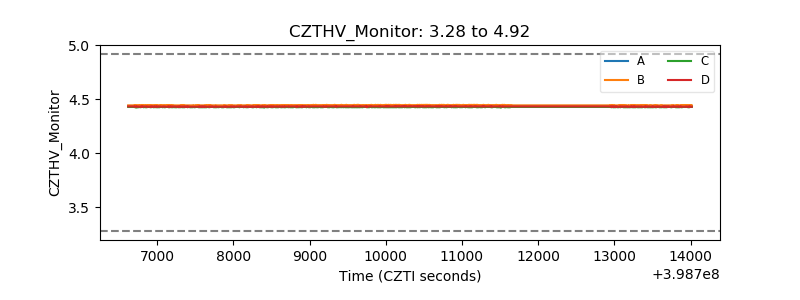 |
| D_VDD | 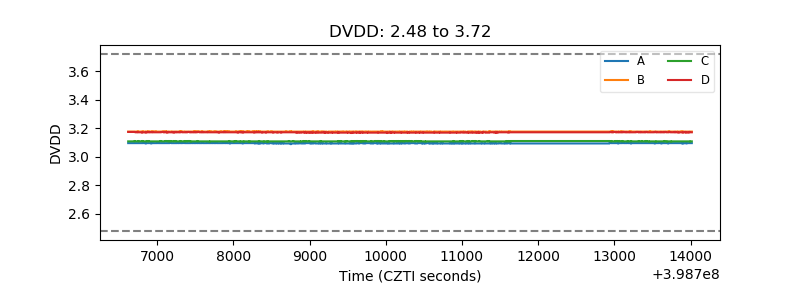 |
| Temperature 1 | 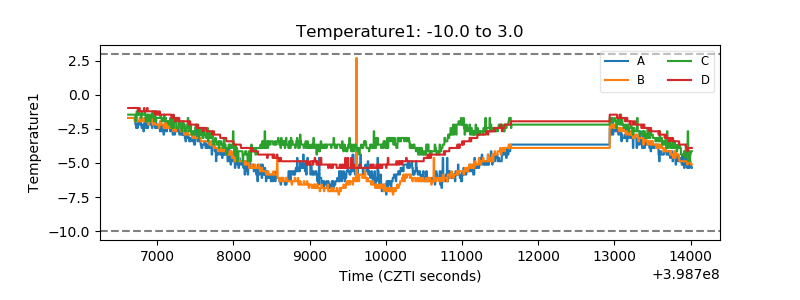 |
| Veto HV Monitor |  |
| Veto LLD | 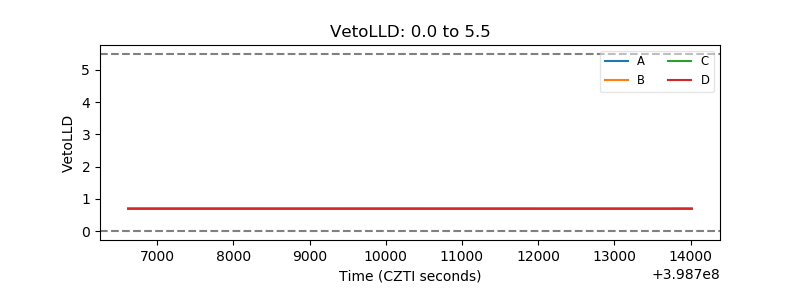 |
| Alpha Counter | 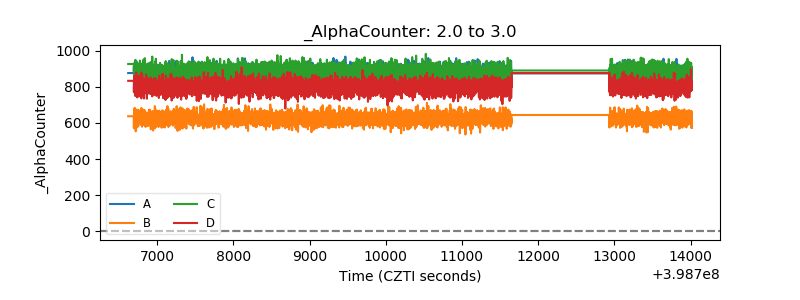 |
| _CPM_Rate | 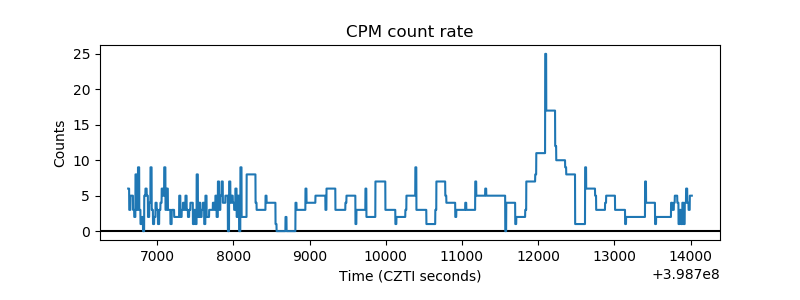 |
| CZT Counter | 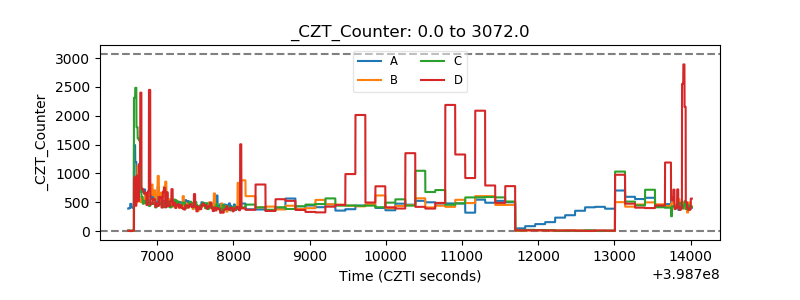 |
| +2.5 Volts monitor | 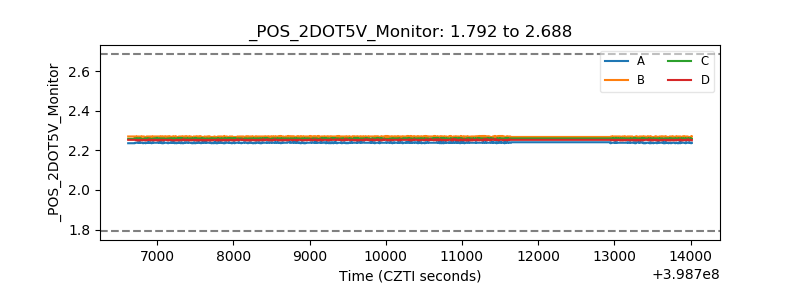 |
| +5 Volts monitor | 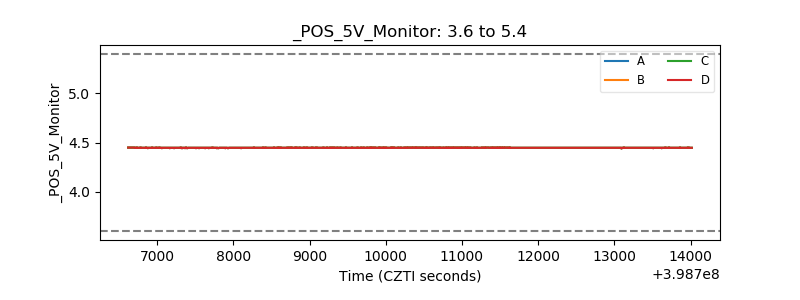 |
| _ROLL_ROT | 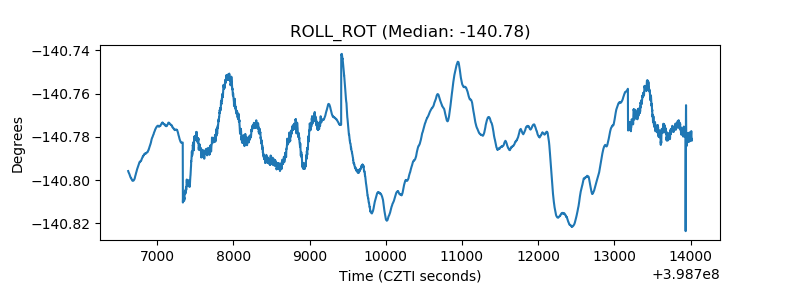 |
| _Roll_DEC | 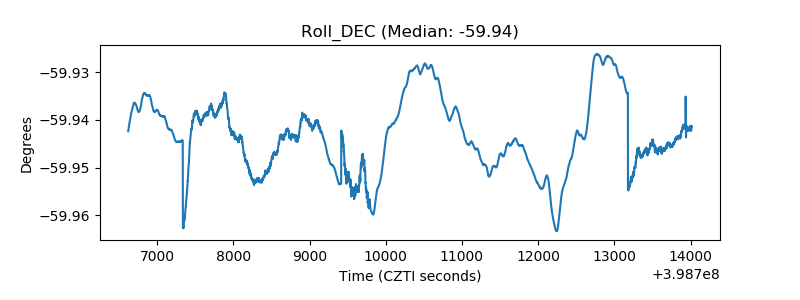 |
| _Roll_RA | 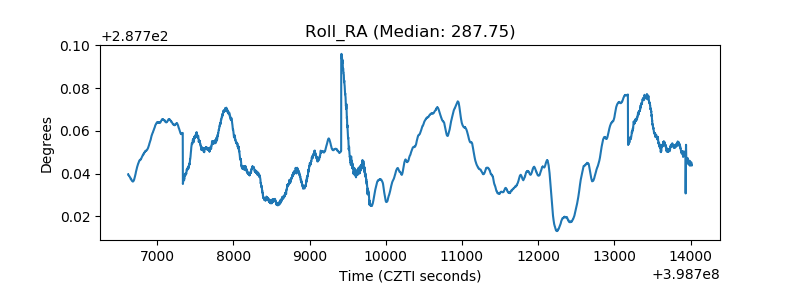 |
| Veto Counter | 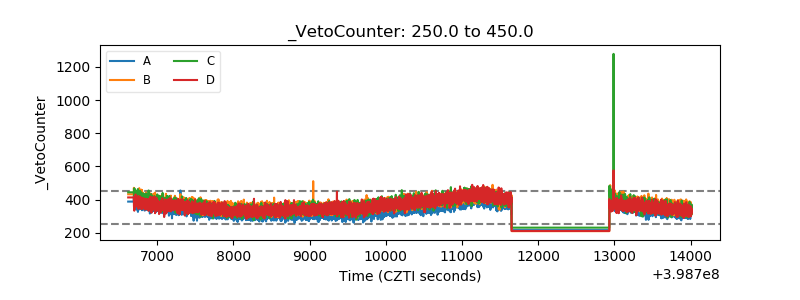 |