| Param | Original file | Final file |
|---|---|---|
| Filename | modeM0/AS1A10_103T03_9000005296_37283cztM0_level2.evt | modeM0/AS1A10_103T03_9000005296_37283cztM0_level2_quad_clean.evt |
| Size (bytes) | 121,610,880 | 30,326,400 |
| Size | 116.0 MB | 28.9 MB |
| Events in quadrant A | 817,792 | 198,891 |
| Events in quadrant B | 845,303 | 198,855 |
| Events in quadrant C | 882,954 | 203,786 |
| Events in quadrant D | 1,019,088 | 192,033 |
| Mode M0 | |||
|---|---|---|---|
| Quadrant | BADHDUFLAG | Total packets | Discarded packets |
| A | 0 | 3605 | 1 |
| B | 0 | 3569 | 1 |
| C | 0 | 3800 | 1 |
| D | 0 | 4311 | 1 |
| Mode SS | |||
|---|---|---|---|
| Quadrant | BADHDUFLAG | Total packets | Discarded packets |
| A | 0 | 34 | 0 |
| B | 0 | 34 | 0 |
| C | 0 | 34 | 0 |
| D | 0 | 34 | 0 |
| Mode M9 | |||
|---|---|---|---|
| Quadrant | BADHDUFLAG | Total packets | Discarded packets |
| A | 0 | 1 | 0 |
| B | 0 | 1 | 0 |
| C | 0 | 1 | 0 |
| D | 0 | 2 | 0 |
| Quadrant | Total seconds | Saturated seconds | Saturation percentage |
|---|---|---|---|
| A | 1692 | 5 | 0.295508% |
| B | 1692 | 10 | 0.591017% |
| C | 1692 | 32 | 1.891253% |
| D | 1692 | 91 | 5.378251% |
Noise dominated data is calculated using 1-second bins in cleaned event files. If a bin has >2000 counts, and if more than 50% of those come from <1% of pixels, then it is considered to be noise-dominated and hence unusable.
| Quadrant | # 1 sec bins | Bins with >0 counts | Bins with >2000 counts | High rate bins dominated by noise | Noise dominated (total time) | Noise dominated (detector-on time) | Marked lightcurve |
|---|---|---|---|---|---|---|---|
| A | 1692 | 1692 | 2 | 2 | 0.12% | 0.12% | 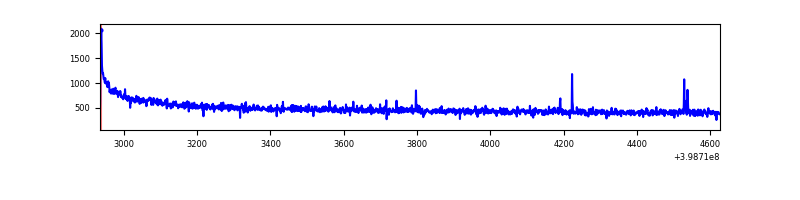 |
| B | 1692 | 1692 | 4 | 4 | 0.24% | 0.24% | 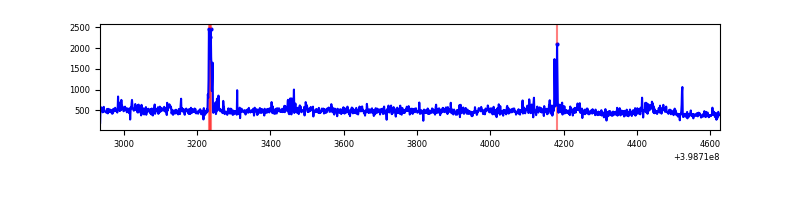 |
| C | 1692 | 1692 | 29 | 29 | 1.71% | 1.71% | 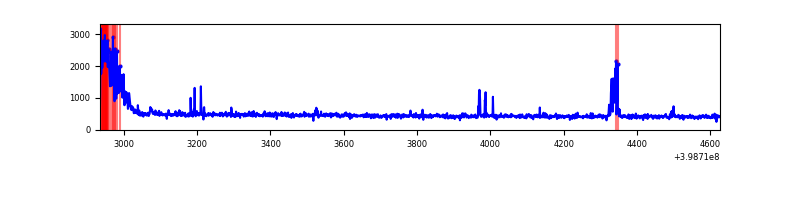 |
| D | 1692 | 1692 | 76 | 76 | 4.49% | 4.49% | 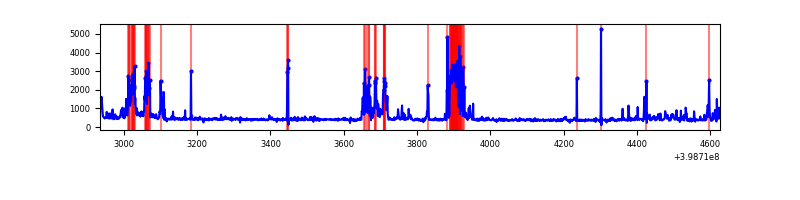 |
Top three noisy pixels from each quadrant. If the there are fewer than three noisy pixels in the level2.evt file, extra rows are filled as -1
| Pixel properties | Quadrant properties | ||||||
|---|---|---|---|---|---|---|---|
| Quadrant | DetID | PixID | Counts | Sigma | Mean | Median | Sigma |
| A | 10 | 83 | 114157 | 2974.5 | 178 | 174 | 38.3 |
| A | 9 | 143 | 4440 | 111.33 | 178 | 174 | 38.3 |
| A | 13 | 254 | 2920 | 71.66 | 178 | 174 | 38.3 |
| B | 0 | 230 | 80679 | 2215.84 | 177 | 172 | 36.3 |
| B | 0 | 213 | 32997 | 903.46 | 177 | 172 | 36.3 |
| B | 0 | 218 | 9394 | 253.82 | 177 | 172 | 36.3 |
| C | 0 | 10 | 110834 | 2666.68 | 169 | 169 | 41.5 |
| C | 15 | 214 | 74077 | 1780.95 | 169 | 169 | 41.5 |
| C | 14 | 254 | 25254 | 604.47 | 169 | 169 | 41.5 |
| D | 13 | 249 | 194490 | 4618.87 | 166 | 161 | 42.1 |
| D | 2 | 249 | 128465 | 3049.57 | 166 | 161 | 42.1 |
| D | 5 | 171 | 17462 | 411.22 | 166 | 161 | 42.1 |
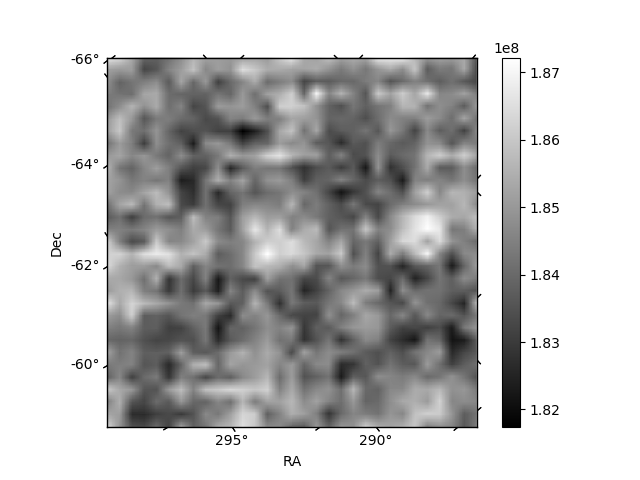
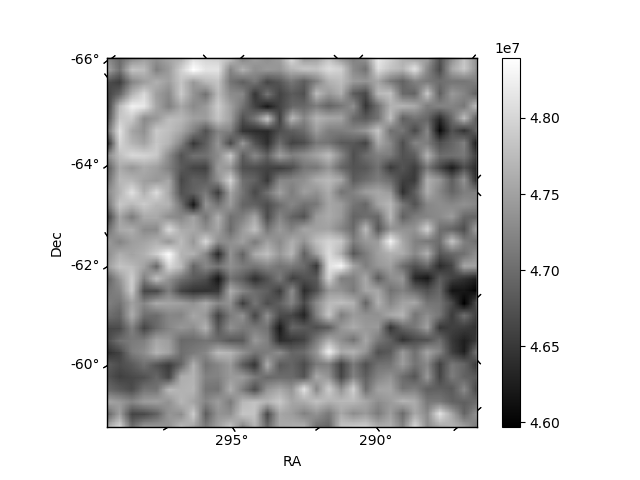
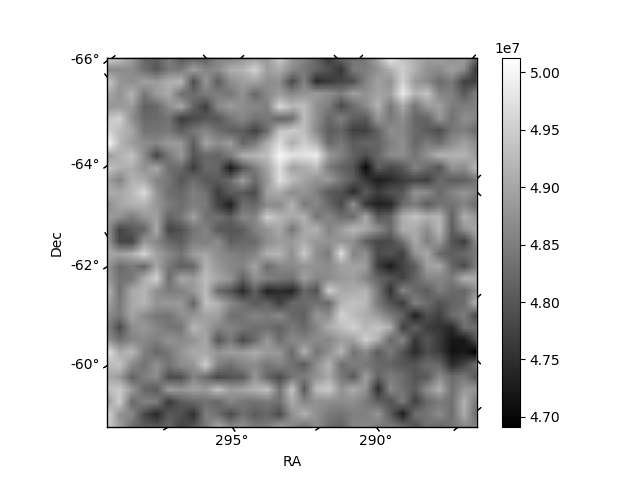
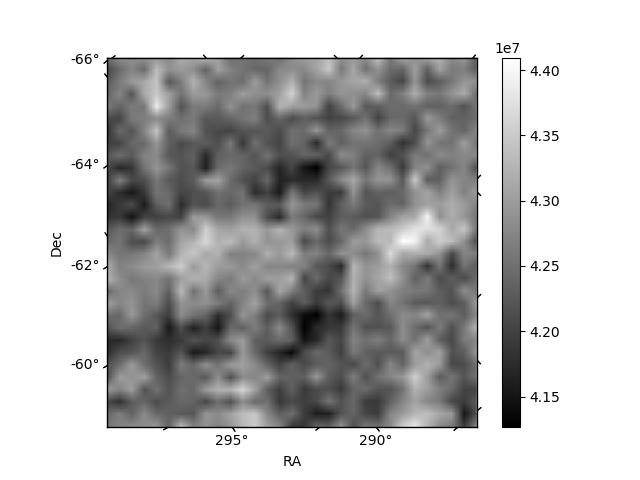
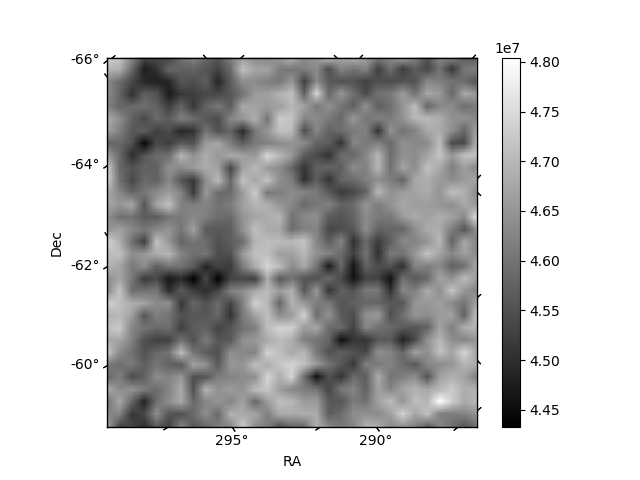
Histogram calculated using DETX and DETY for each event in the final _common_clean file
| Quadrant A | 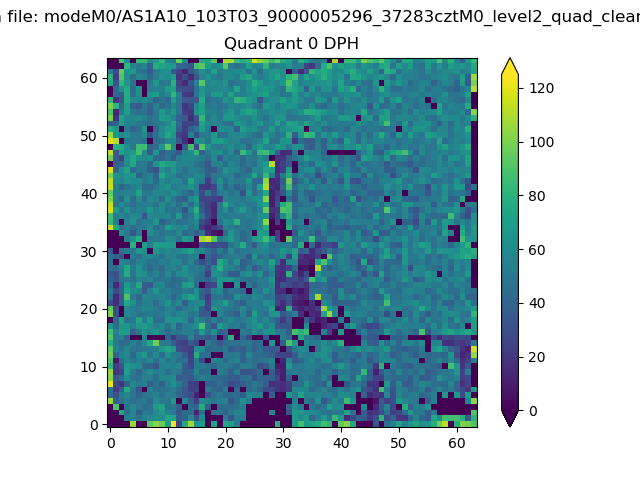 |
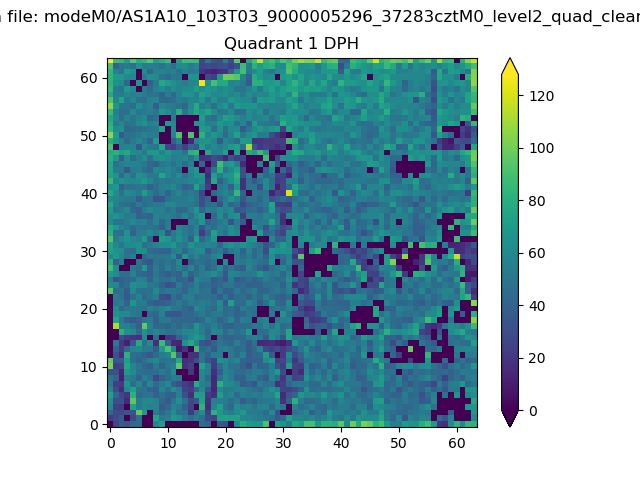 |
Quadrant B |
|---|---|---|---|
| Quadrant D | 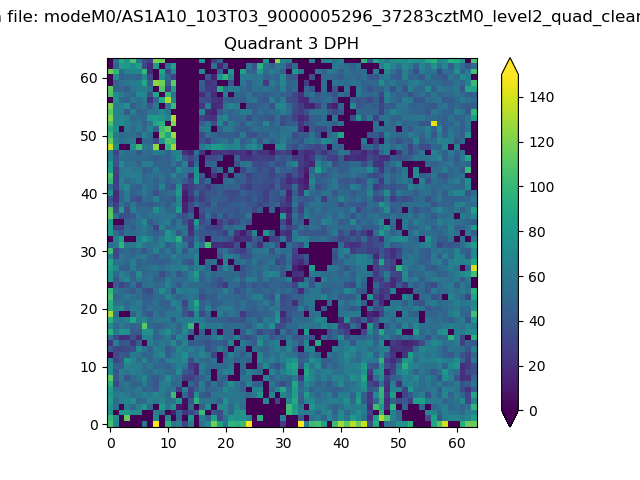 |
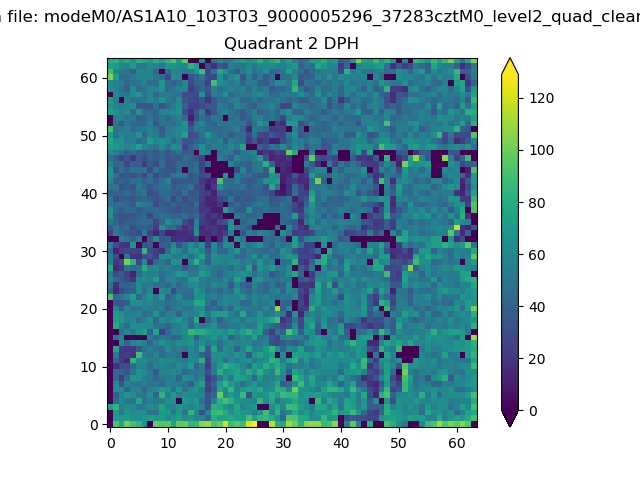 |
Quadrant C |
| Plot type | Count rate plots | Images |
|---|---|---|
| Comparison with Poisson distribution Blue bars denote a histogram of data divided into 1 sec bins. Red curve is a Poisson curve with rate = median count rate of data. |
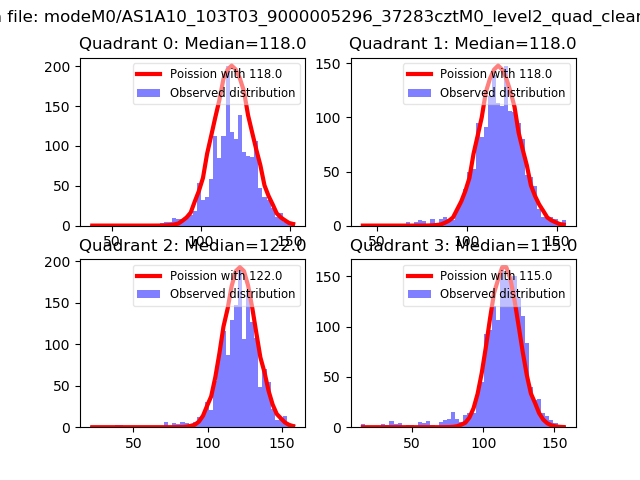 |
 |
| Quadrant-wise count rates Data is divided into 100 sec bins |
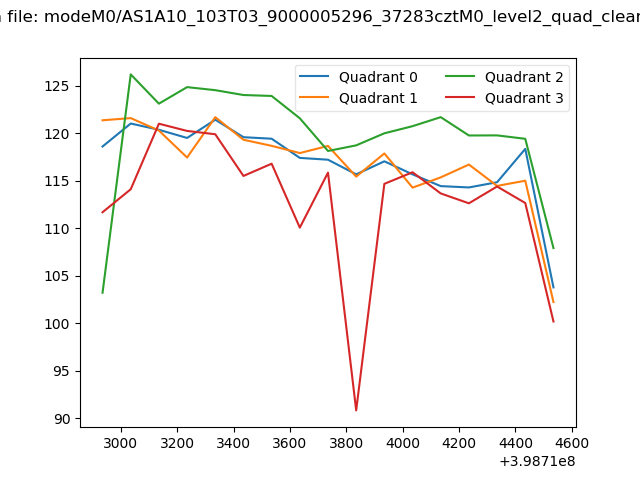 |
|
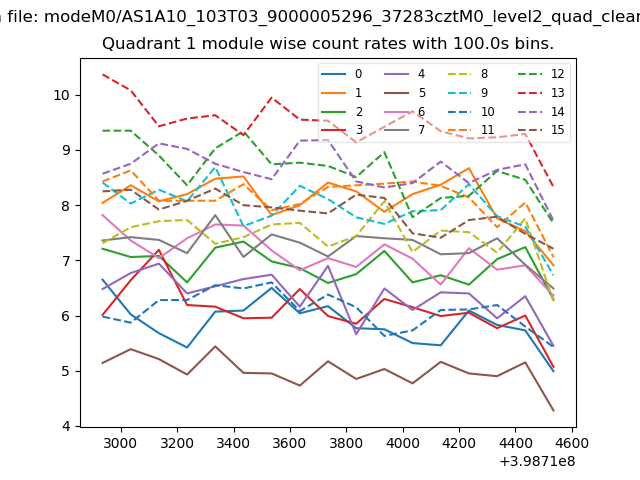
| Module-wise count rates for Quadrant A Data is divided into 100 sec bins |
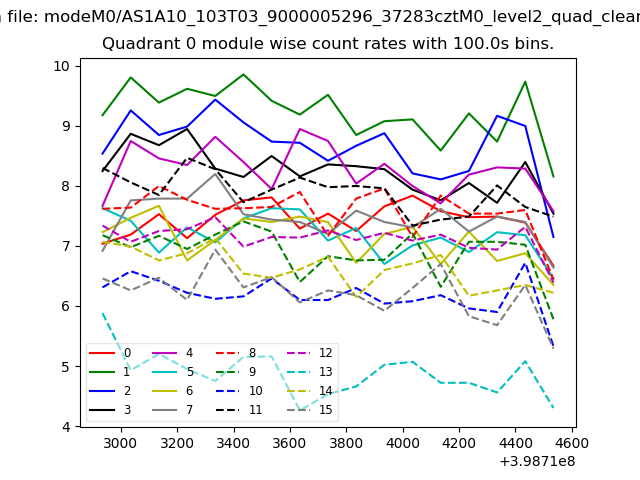 |
 |
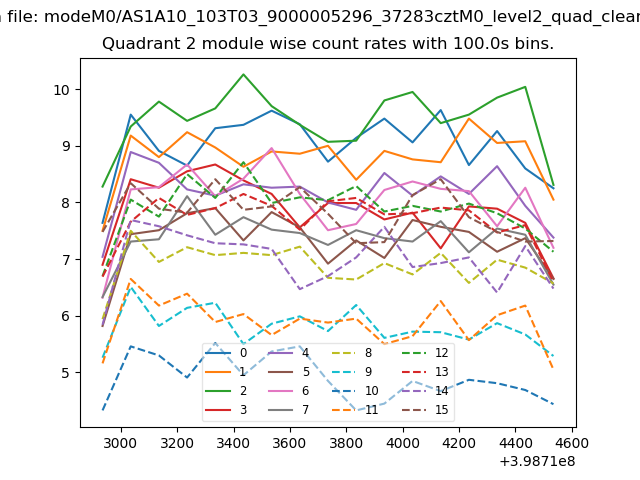
| Module-wise count rates for Quadrant B Data is divided into 100 sec bins |
 |
 |
| Module-wise count rates for Quadrant C Data is divided into 100 sec bins |
 |
 |
| Module-wise count rates for Quadrant D Data is divided into 100 sec bins |
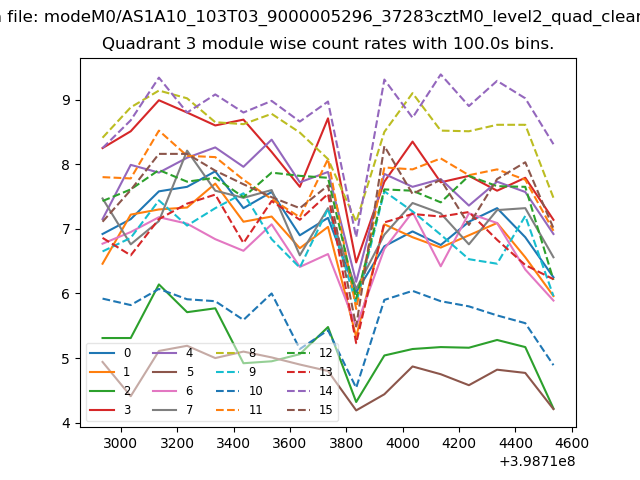 |
 |
| Parameter | Plot |
|---|---|
| CZT HV Monitor | 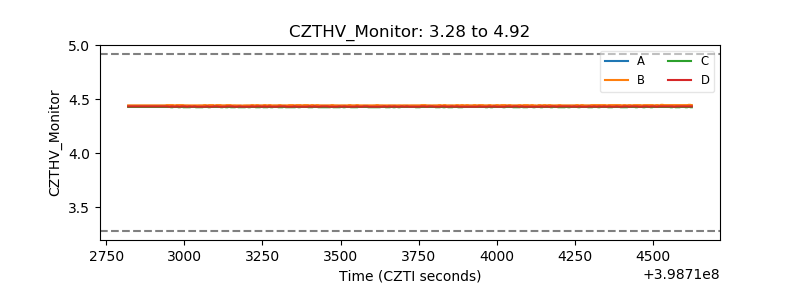 |
| D_VDD | 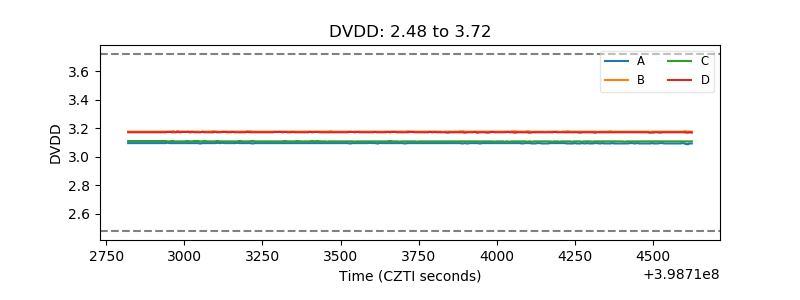 |
| Temperature 1 |  |
| Veto HV Monitor | 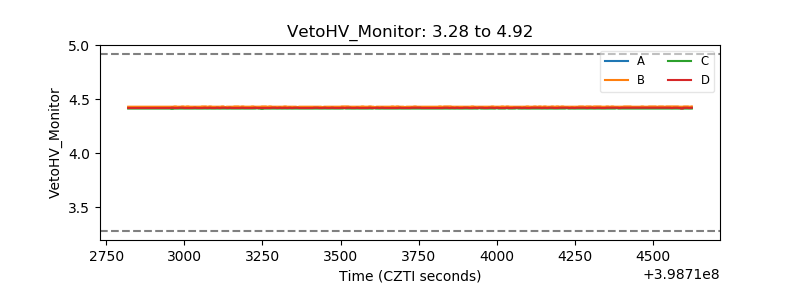 |
| Veto LLD | 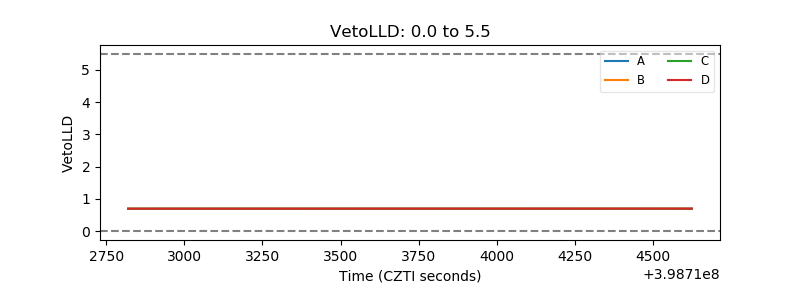 |
| Alpha Counter | 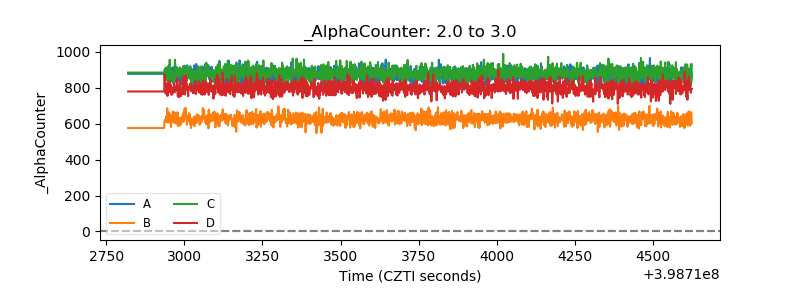 |
| _CPM_Rate | 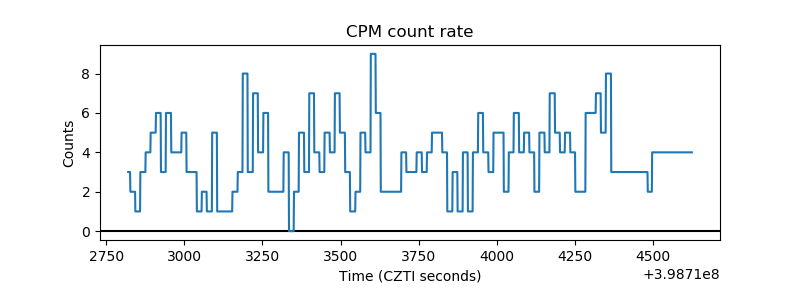 |
| CZT Counter | 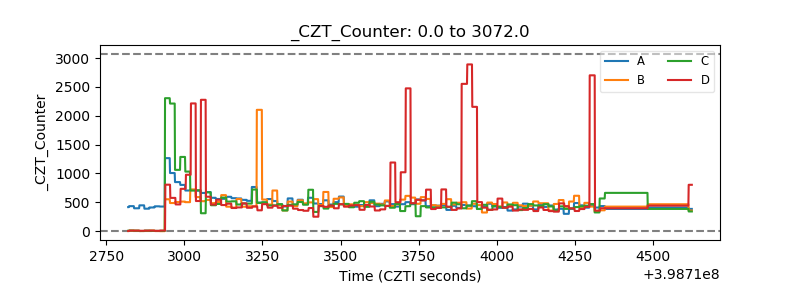 |
| +2.5 Volts monitor | 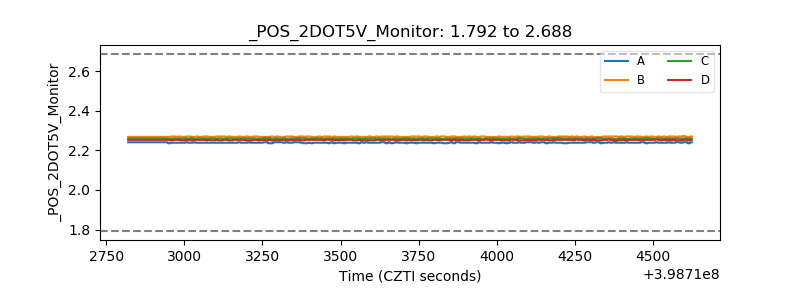 |
| +5 Volts monitor | 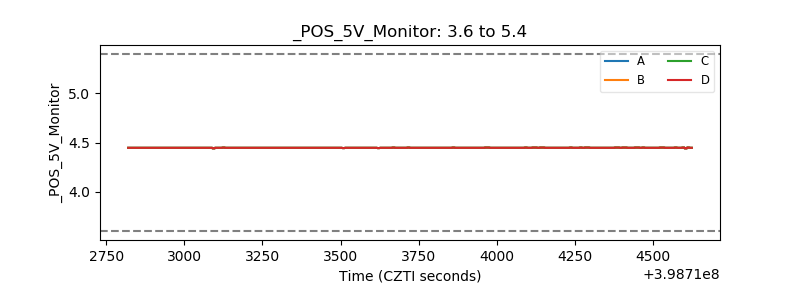 |
| _ROLL_ROT | 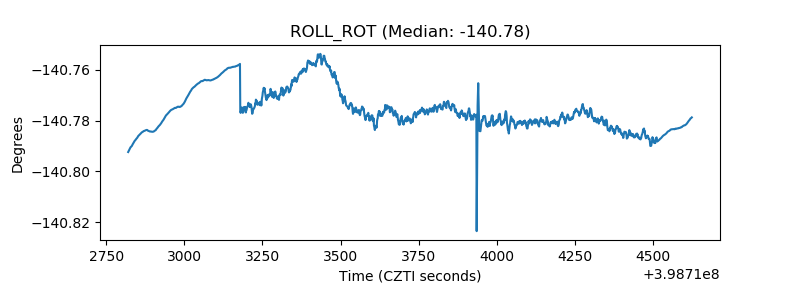 |
| _Roll_DEC | 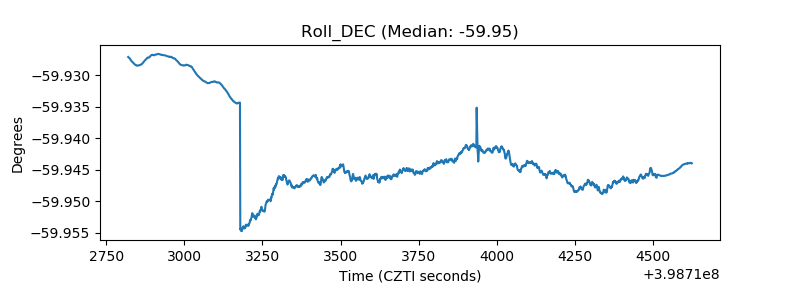 |
| _Roll_RA | 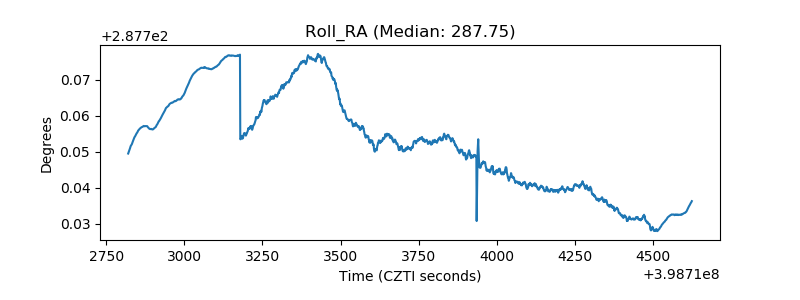 |
| Veto Counter | 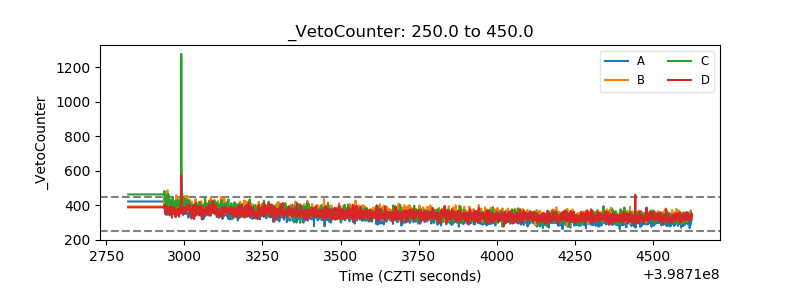 |