| Param | Original file | Final file |
|---|---|---|
| Filename | modeM0/AS1A10_094T16_9000005298cztM0_level2.fits | modeM0/AS1A10_094T16_9000005298cztM0_level2_quad_clean.evt |
| Size (bytes) | 64,353,600 | 71,470,080 |
| Size | 61.4 MB | 68.2 MB |
| Events in quadrant A | 391,788 | 433,929 |
| Events in quadrant B | 370,360 | 429,114 |
| Events in quadrant C | 385,884 | 419,112 |
| Events in quadrant D | 293,004 | 374,188 |
| Mode SS | |||
|---|---|---|---|
| Quadrant | BADHDUFLAG | Total packets | Discarded packets |
| A | 0 | 148 | 0 |
| B | 0 | 148 | 0 |
| C | 0 | 148 | 0 |
| D | 0 | 148 | 0 |
| Mode M9 | |||
|---|---|---|---|
| Quadrant | BADHDUFLAG | Total packets | Discarded packets |
| A | 0 | 14 | 0 |
| B | 0 | 14 | 0 |
| C | 0 | 14 | 0 |
| D | 0 | 14 | 0 |
| Mode M0 | |||
|---|---|---|---|
| Quadrant | BADHDUFLAG | Total packets | Discarded packets |
| A | 0 | 15065 | 0 |
| B | 0 | 16975 | 0 |
| C | 0 | 15425 | 0 |
| D | 0 | 25873 | 0 |
| Quadrant | Total seconds | Saturated seconds | Saturation percentage |
|---|---|---|---|
| A | 7288 | 19 | 0.260703% |
| B | 7288 | 150 | 2.058178% |
| C | 7288 | 39 | 0.535126% |
| D | 7288 | 1398 | 19.182217% |
Noise dominated data is calculated using 1-second bins in cleaned event files. If a bin has >2000 counts, and if more than 50% of those come from <1% of pixels, then it is considered to be noise-dominated and hence unusable.
| Quadrant | # 1 sec bins | Bins with >0 counts | Bins with >2000 counts | High rate bins dominated by noise | Noise dominated (total time) | Noise dominated (detector-on time) | Marked lightcurve |
|---|---|---|---|---|---|---|---|
| A | 8631 | 7288 | 0 | 0 | 0.00% | 0.00% | 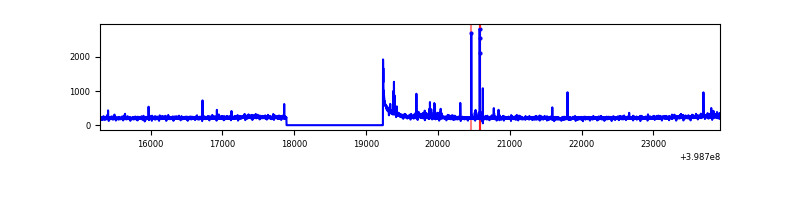 |
| B | 8631 | 7288 | 0 | 0 | 0.00% | 0.00% | 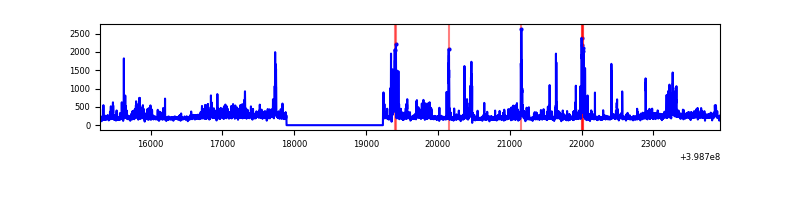 |
| C | 8631 | 7288 | 0 | 0 | 0.00% | 0.00% | 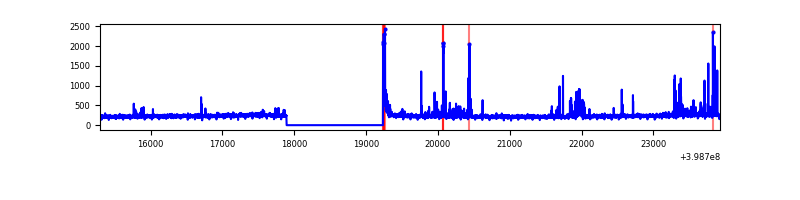 |
| D | 8631 | 7173 | 0 | 0 | 0.00% | 0.00% | 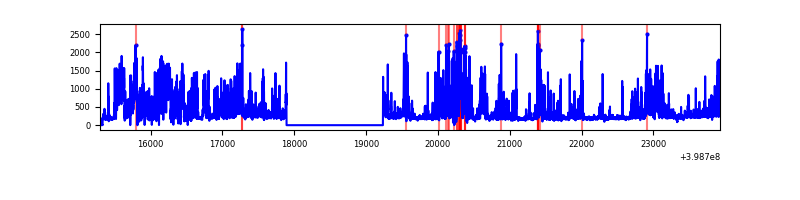 |
Top three noisy pixels from each quadrant. If the there are fewer than three noisy pixels in the level2.evt file, extra rows are filled as -1
| Pixel properties | Quadrant properties | ||||||
|---|---|---|---|---|---|---|---|
| Quadrant | DetID | PixID | Counts | Sigma | Mean | Median | Sigma |
| A | 7 | 110 | 365 | 9.84 | 102 | 96 | 27.3 |
| A | 0 | 29 | 323 | 8.3 | 102 | 96 | 27.3 |
| A | 9 | 19 | 311 | 7.86 | 102 | 96 | 27.3 |
| B | 2 | 9 | 318 | 10.56 | 97 | 93 | 21.3 |
| B | 3 | 80 | 312 | 10.28 | 97 | 93 | 21.3 |
| B | 5 | 128 | 271 | 8.35 | 97 | 93 | 21.3 |
| C | 3 | 202 | 335 | 8.51 | 101 | 95 | 28.2 |
| C | 1 | 81 | 320 | 7.97 | 101 | 95 | 28.2 |
| C | 1 | 80 | 320 | 7.97 | 101 | 95 | 28.2 |
| D | 6 | 83 | 234 | 6.65 | 83 | 76 | 23.8 |
| D | 6 | 38 | 223 | 6.19 | 83 | 76 | 23.8 |
| D | 14 | 238 | 216 | 5.89 | 83 | 76 | 23.8 |
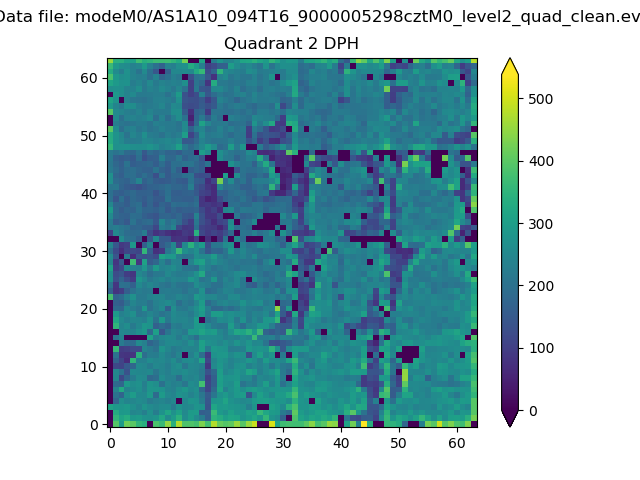
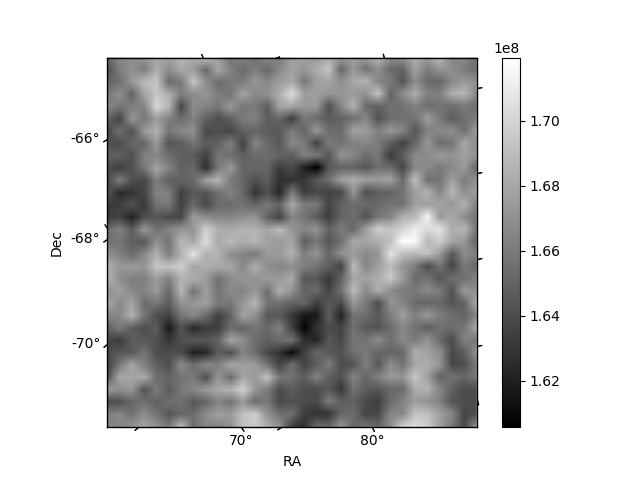
Histogram calculated using DETX and DETY for each event in the final _common_clean file
| Quadrant A | 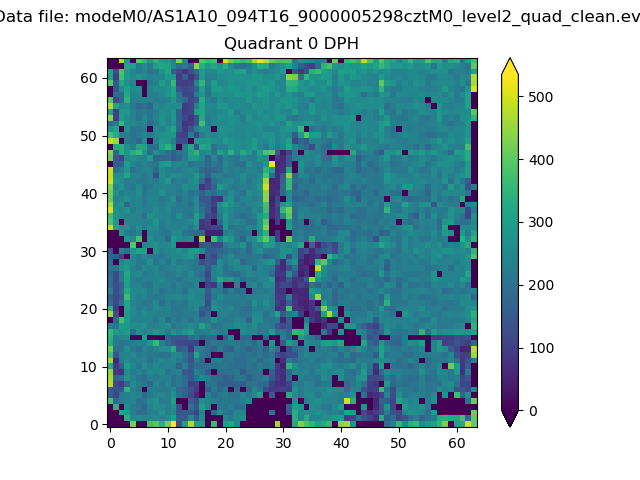 |
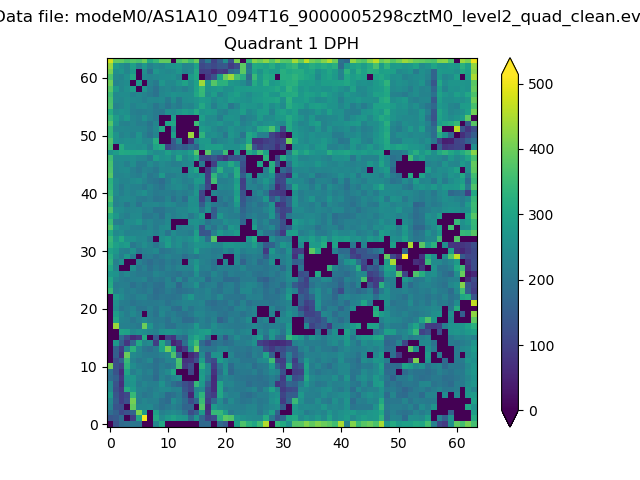 |
Quadrant B |
|---|---|---|---|
| Quadrant D | 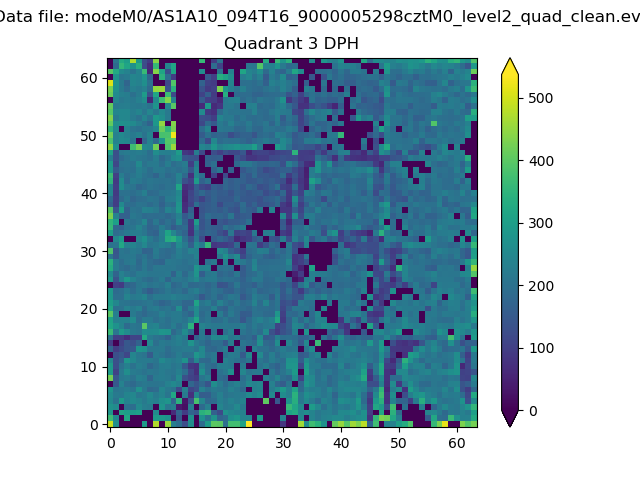 |
 |
Quadrant C |
| Plot type | Count rate plots | Images |
|---|---|---|
| Comparison with Poisson distribution Blue bars denote a histogram of data divided into 1 sec bins. Red curve is a Poisson curve with rate = median count rate of data. |
 |
 |
| Quadrant-wise count rates Data is divided into 100 sec bins |
 |
|
| Module-wise count rates for Quadrant A Data is divided into 100 sec bins |
 |
 |
| Module-wise count rates for Quadrant B Data is divided into 100 sec bins |
 |
 |
| Module-wise count rates for Quadrant C Data is divided into 100 sec bins |
 |
 |
| Module-wise count rates for Quadrant D Data is divided into 100 sec bins |
 |
 |
| Parameter | Plot |
|---|---|
| CZT HV Monitor |  |
| D_VDD | 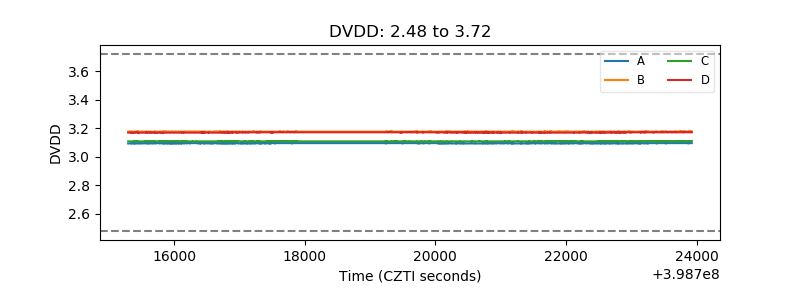 |
| Temperature 1 |  |
| Veto HV Monitor | 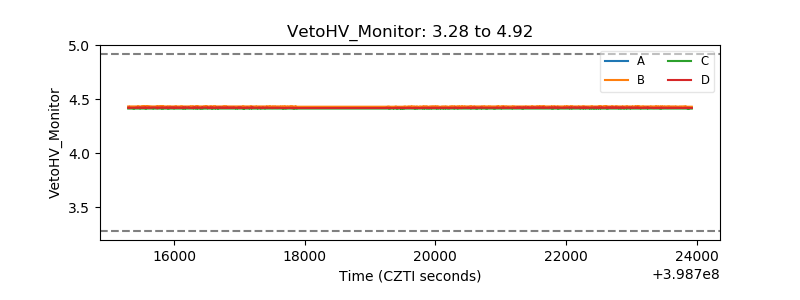 |
| Veto LLD | 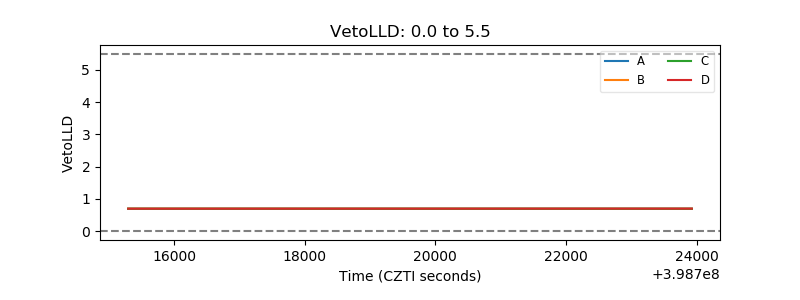 |
| Alpha Counter | 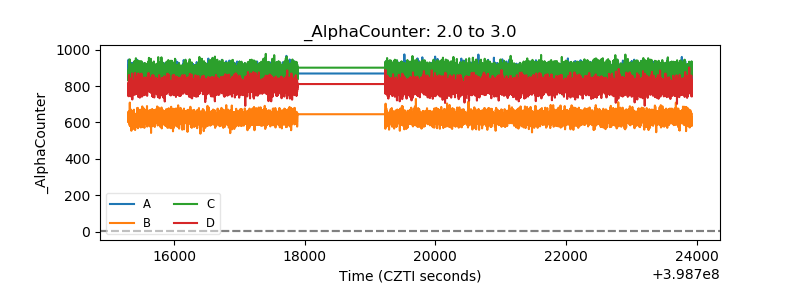 |
| _CPM_Rate |  |
| CZT Counter |  |
| +2.5 Volts monitor |  |
| +5 Volts monitor |  |
| _ROLL_ROT | 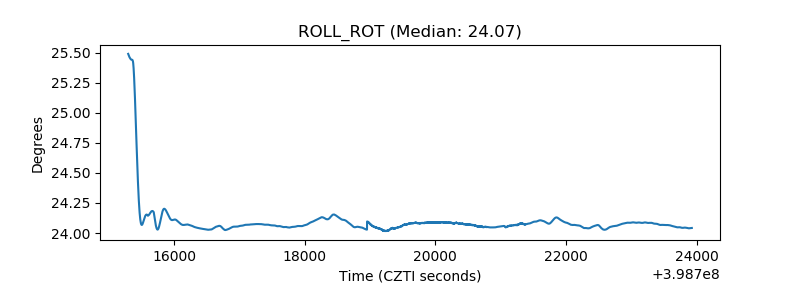 |
| _Roll_DEC | 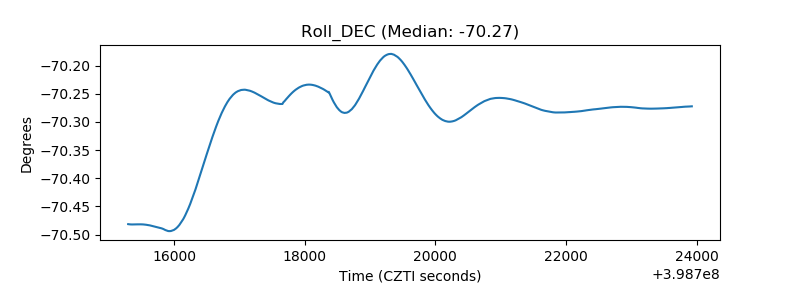 |
| _Roll_RA | 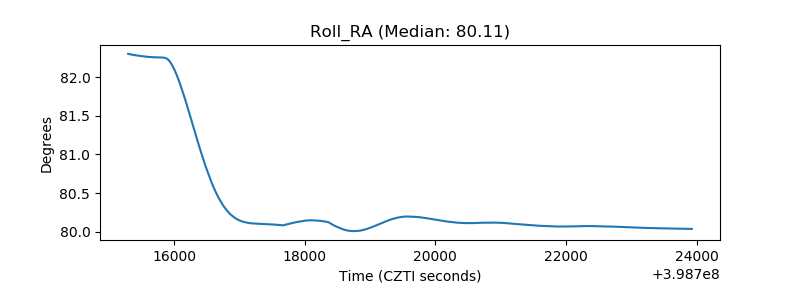 |
| Veto Counter |  |