| Param | Original file | Final file |
|---|---|---|
| Filename | modeM0/AS1A10_094T16_9000005298_37283cztM0_level2.evt | modeM0/AS1A10_094T16_9000005298_37283cztM0_level2_quad_clean.evt |
| Size (bytes) | 616,533,120 | 128,756,160 |
| Size | 588.0 MB | 122.8 MB |
| Events in quadrant A | 3,463,541 | 881,509 |
| Events in quadrant B | 4,043,161 | 881,883 |
| Events in quadrant C | 3,661,953 | 885,983 |
| Events in quadrant D | 7,008,843 | 742,359 |
| Mode SS | |||
|---|---|---|---|
| Quadrant | BADHDUFLAG | Total packets | Discarded packets |
| A | 0 | 148 | 0 |
| B | 0 | 148 | 0 |
| C | 0 | 148 | 0 |
| D | 0 | 148 | 0 |
| Mode M9 | |||
|---|---|---|---|
| Quadrant | BADHDUFLAG | Total packets | Discarded packets |
| A | 0 | 14 | 0 |
| B | 0 | 14 | 0 |
| C | 0 | 14 | 0 |
| D | 0 | 14 | 0 |
| Mode M0 | |||
|---|---|---|---|
| Quadrant | BADHDUFLAG | Total packets | Discarded packets |
| A | 0 | 15066 | 1 |
| B | 0 | 16976 | 1 |
| C | 0 | 15426 | 1 |
| D | 0 | 25874 | 1 |
| Quadrant | Total seconds | Saturated seconds | Saturation percentage |
|---|---|---|---|
| A | 7288 | 19 | 0.260703% |
| B | 7288 | 150 | 2.058178% |
| C | 7288 | 39 | 0.535126% |
| D | 7288 | 1398 | 19.182217% |
Noise dominated data is calculated using 1-second bins in cleaned event files. If a bin has >2000 counts, and if more than 50% of those come from <1% of pixels, then it is considered to be noise-dominated and hence unusable.
| Quadrant | # 1 sec bins | Bins with >0 counts | Bins with >2000 counts | High rate bins dominated by noise | Noise dominated (total time) | Noise dominated (detector-on time) | Marked lightcurve |
|---|---|---|---|---|---|---|---|
| A | 8631 | 7289 | 8 | 8 | 0.09% | 0.11% | 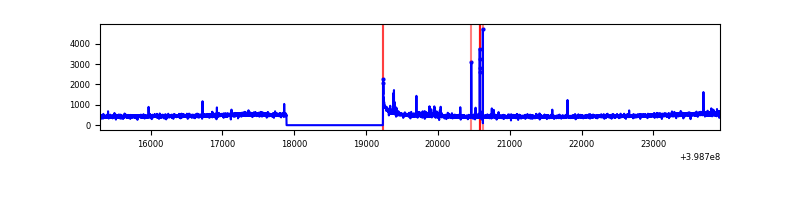 |
| B | 8631 | 7289 | 108 | 108 | 1.25% | 1.48% | 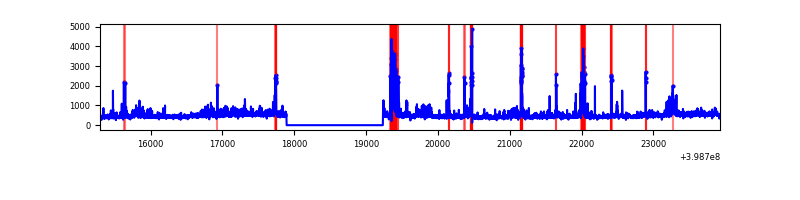 |
| C | 8631 | 7289 | 30 | 30 | 0.35% | 0.41% | 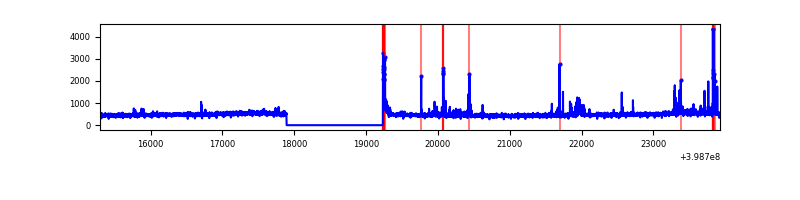 |
| D | 8631 | 7289 | 1180 | 1180 | 13.67% | 16.19% | 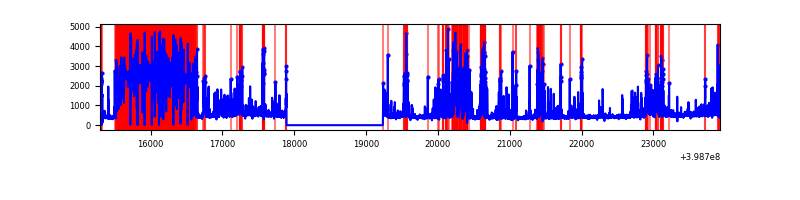 |
Top three noisy pixels from each quadrant. If the there are fewer than three noisy pixels in the level2.evt file, extra rows are filled as -1
| Pixel properties | Quadrant properties | ||||||
|---|---|---|---|---|---|---|---|
| Quadrant | DetID | PixID | Counts | Sigma | Mean | Median | Sigma |
| A | 10 | 83 | 254752 | 1562.15 | 809 | 792 | 162.6 |
| A | 9 | 143 | 35700 | 214.72 | 809 | 792 | 162.6 |
| A | 15 | 222 | 20602 | 121.85 | 809 | 792 | 162.6 |
| B | 5 | 172 | 397689 | 2606.81 | 796 | 773 | 152.3 |
| B | 0 | 213 | 307224 | 2012.66 | 796 | 773 | 152.3 |
| B | 0 | 189 | 63767 | 413.72 | 796 | 773 | 152.3 |
| C | 15 | 214 | 297312 | 1596.33 | 798 | 800 | 185.7 |
| C | 1 | 23 | 111765 | 597.4 | 798 | 800 | 185.7 |
| C | 14 | 254 | 78047 | 415.87 | 798 | 800 | 185.7 |
| D | 2 | 249 | 3478137 | 20006.15 | 708 | 688 | 173.8 |
| D | 13 | 249 | 641327 | 3685.67 | 708 | 688 | 173.8 |
| D | 2 | 250 | 36606 | 206.64 | 708 | 688 | 173.8 |
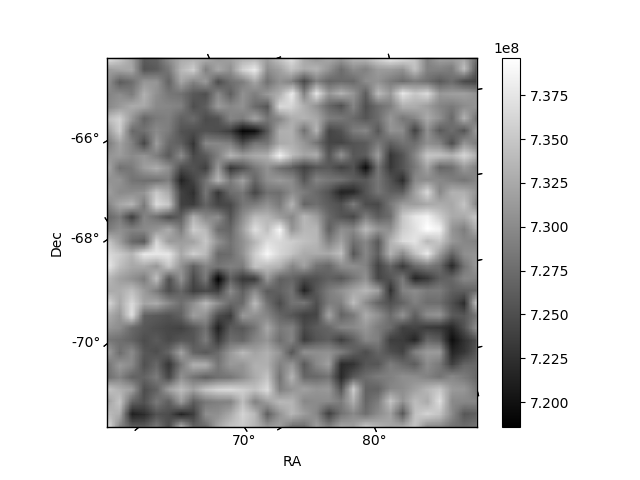
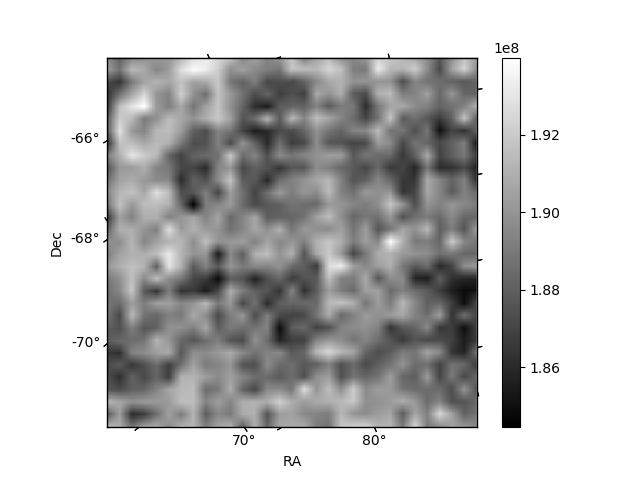
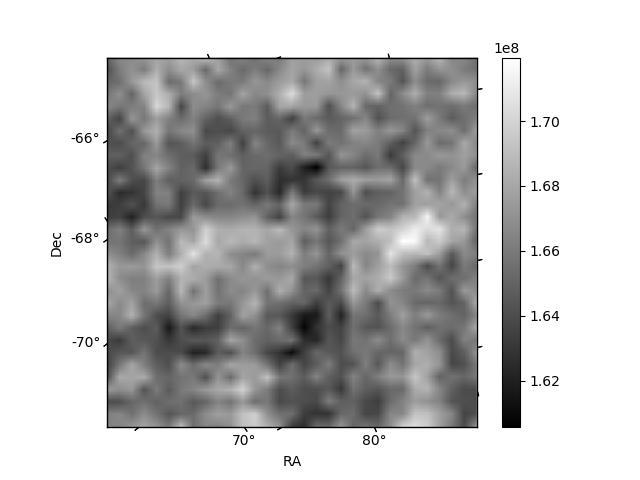
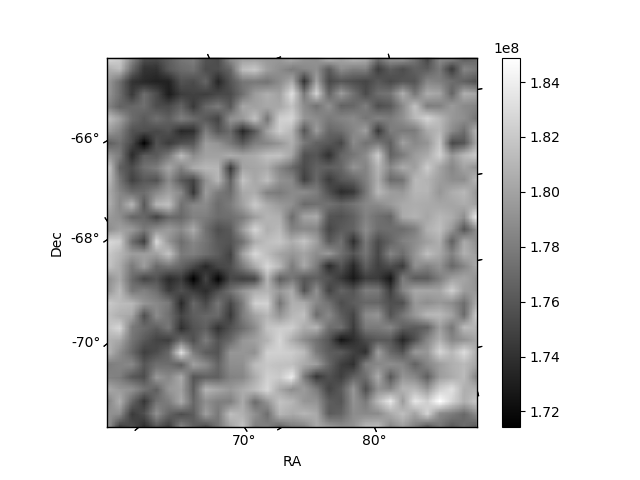
Histogram calculated using DETX and DETY for each event in the final _common_clean file
| Quadrant A | 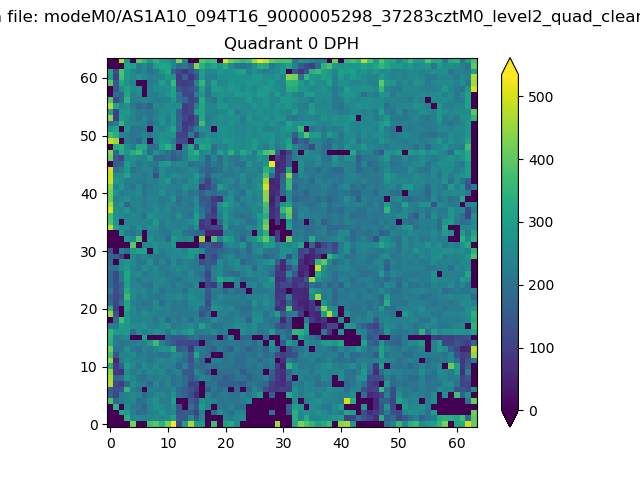 |
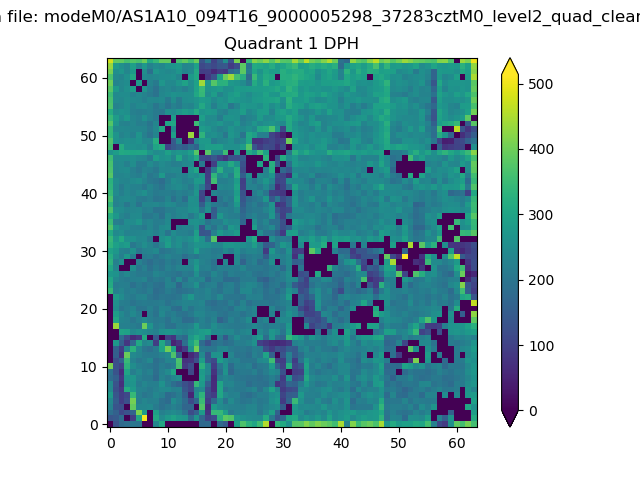 |
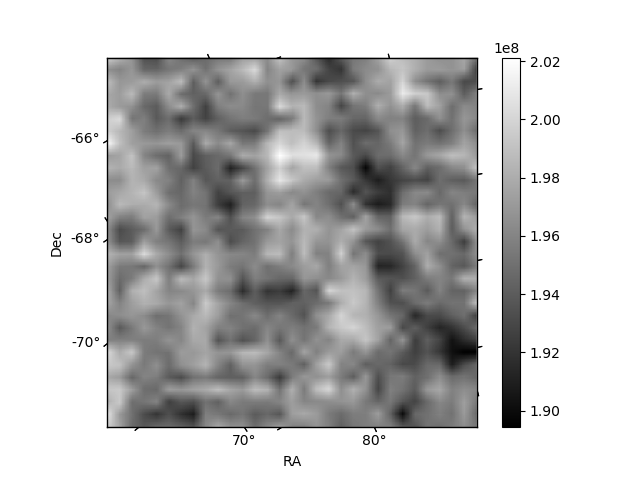
Quadrant B |
|---|---|---|---|
| Quadrant D | 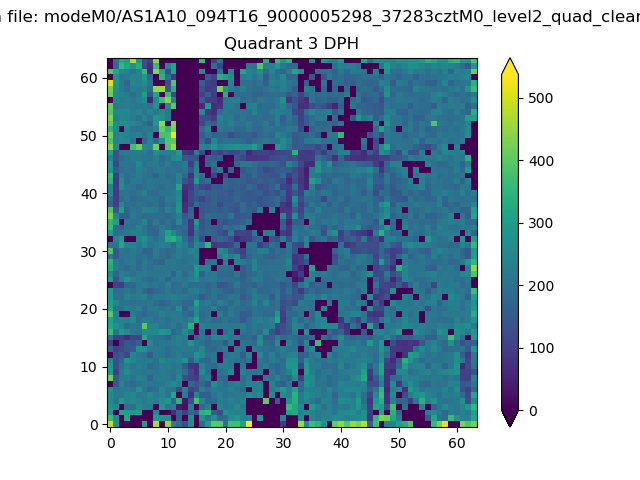 |
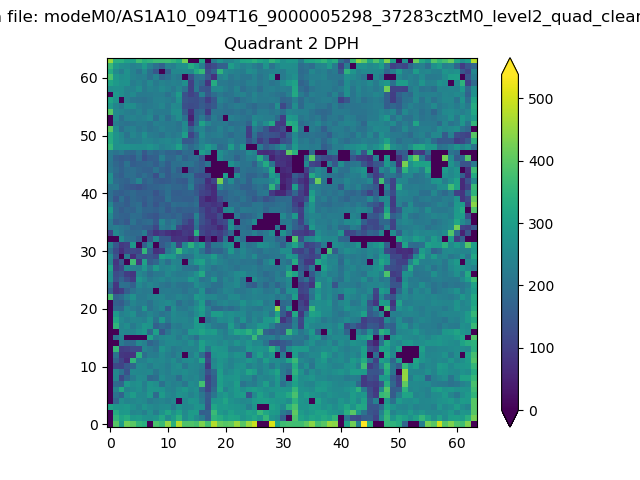 |
Quadrant C |
| Plot type | Count rate plots | Images |
|---|---|---|
| Comparison with Poisson distribution Blue bars denote a histogram of data divided into 1 sec bins. Red curve is a Poisson curve with rate = median count rate of data. |
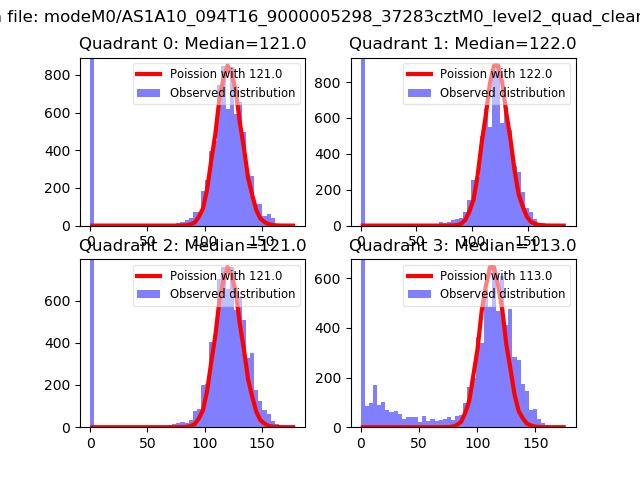 |
 |
| Quadrant-wise count rates Data is divided into 100 sec bins |
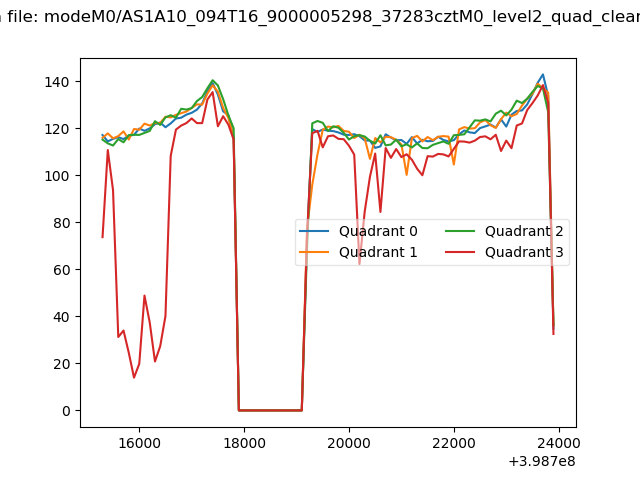 |
|
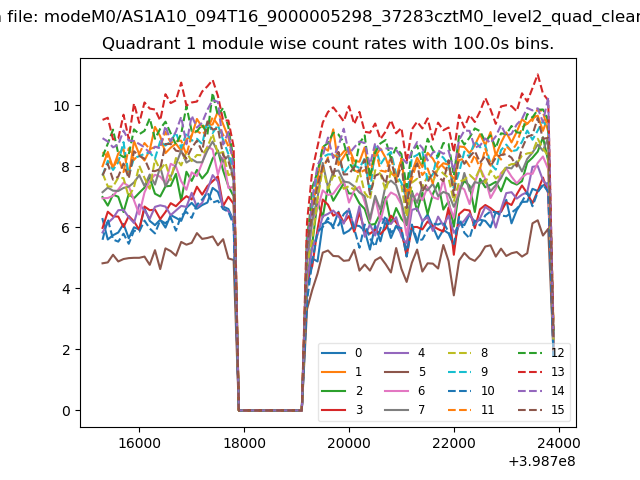
| Module-wise count rates for Quadrant A Data is divided into 100 sec bins |
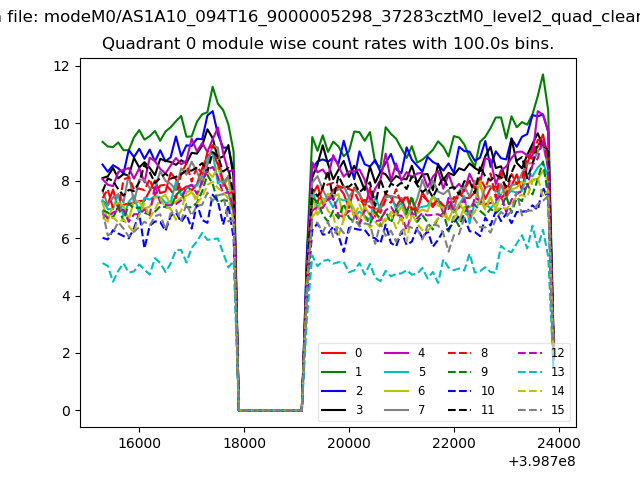 |
 |
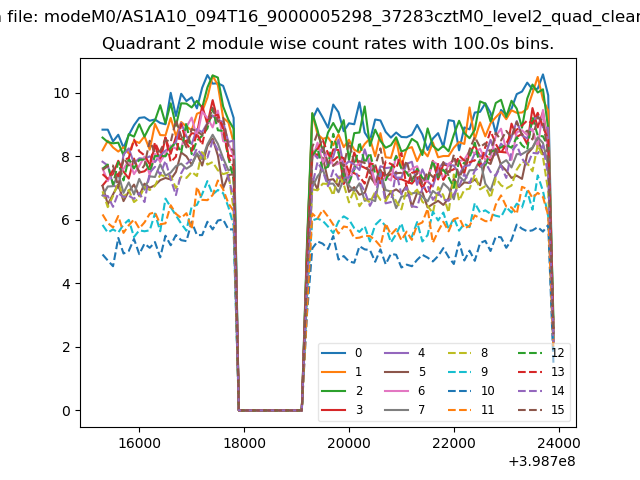
| Module-wise count rates for Quadrant B Data is divided into 100 sec bins |
 |
 |
| Module-wise count rates for Quadrant C Data is divided into 100 sec bins |
 |
 |
| Module-wise count rates for Quadrant D Data is divided into 100 sec bins |
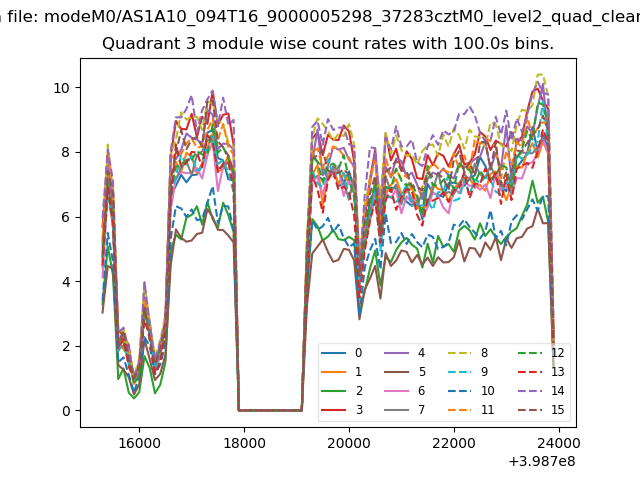 |
 |
| Parameter | Plot |
|---|---|
| CZT HV Monitor | 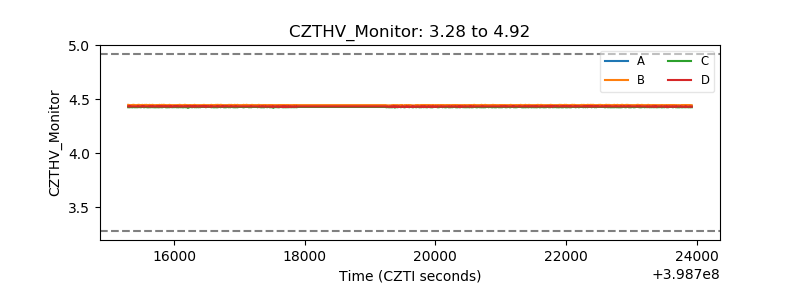 |
| D_VDD | 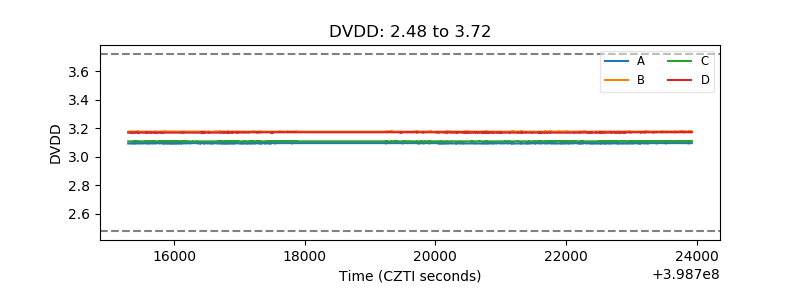 |
| Temperature 1 | 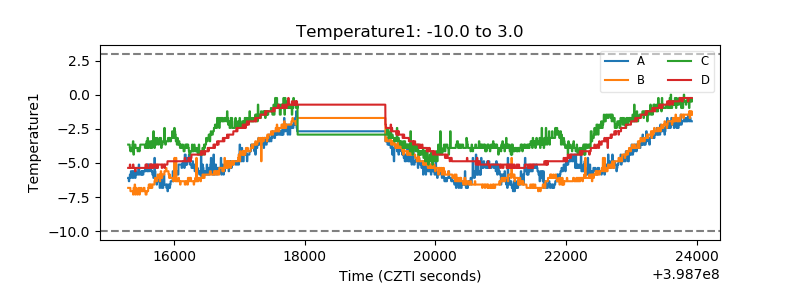 |
| Veto HV Monitor | 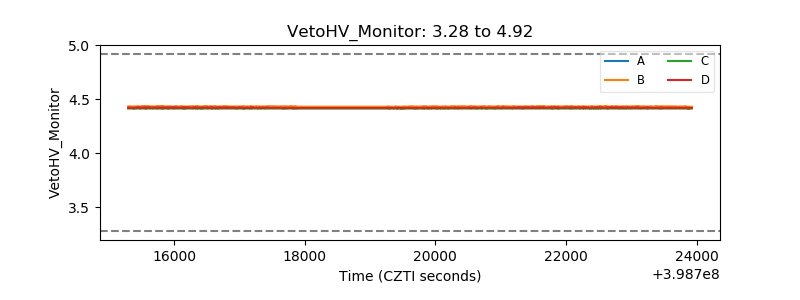 |
| Veto LLD | 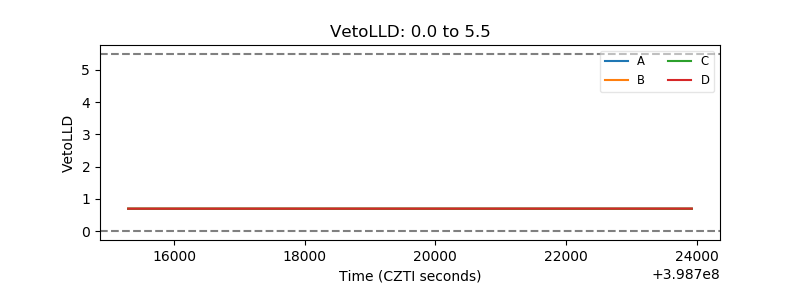 |
| Alpha Counter | 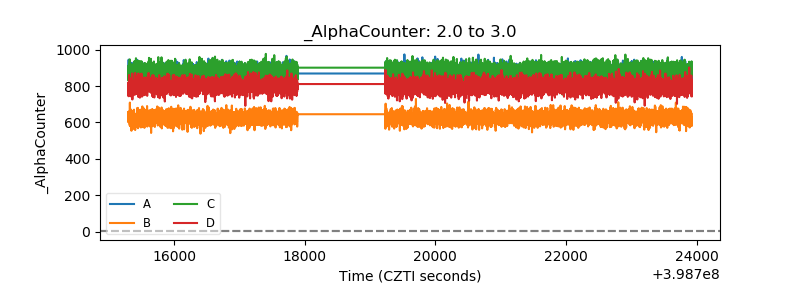 |
| _CPM_Rate | 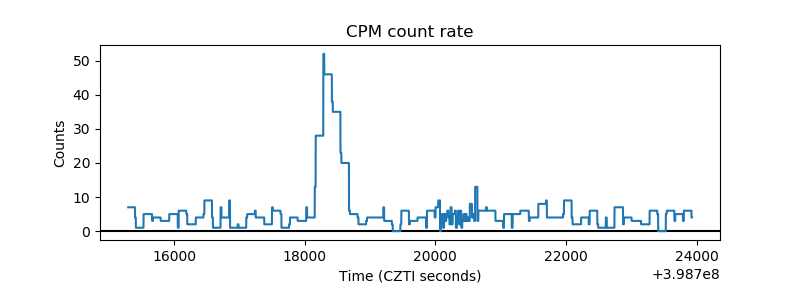 |
| CZT Counter | 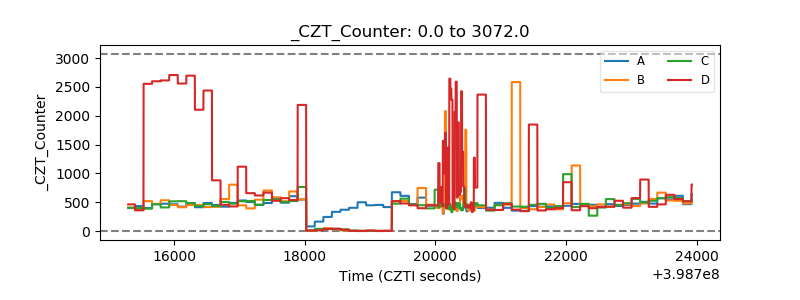 |
| +2.5 Volts monitor | 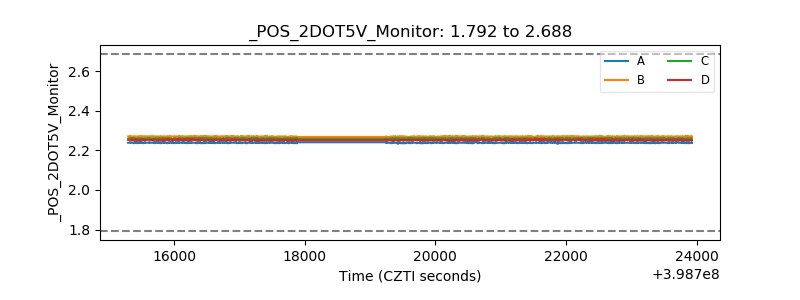 |
| +5 Volts monitor | 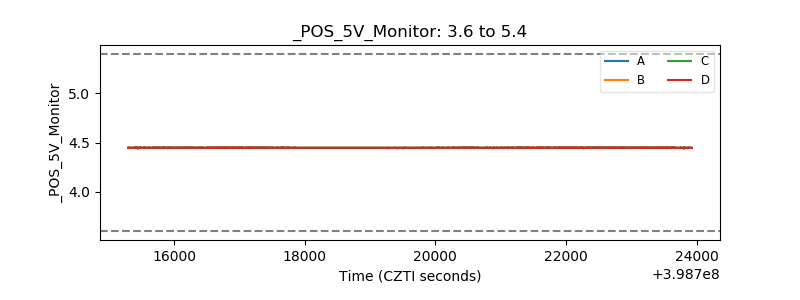 |
| _ROLL_ROT | 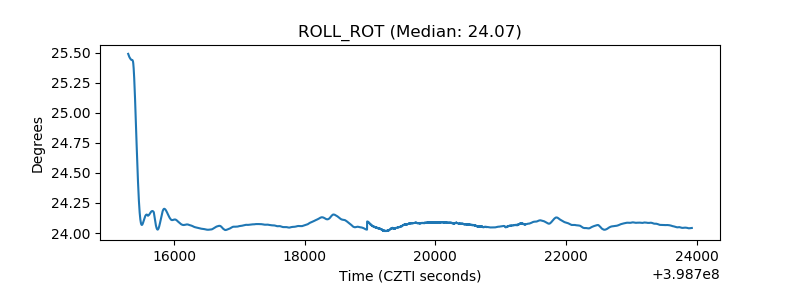 |
| _Roll_DEC | 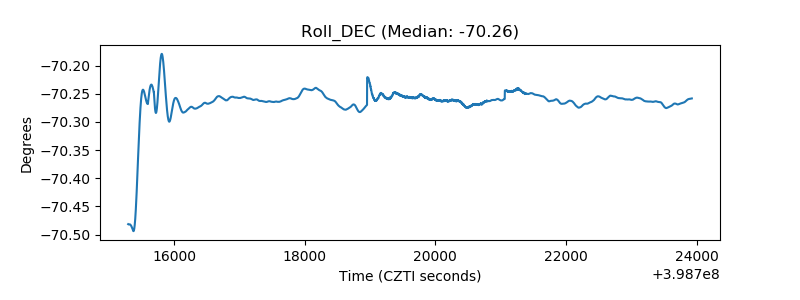 |
| _Roll_RA | 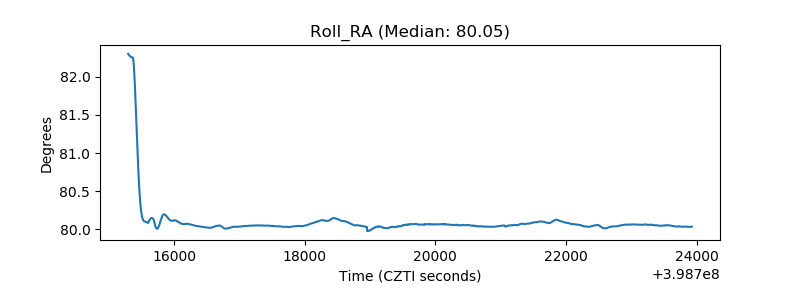 |
| Veto Counter | 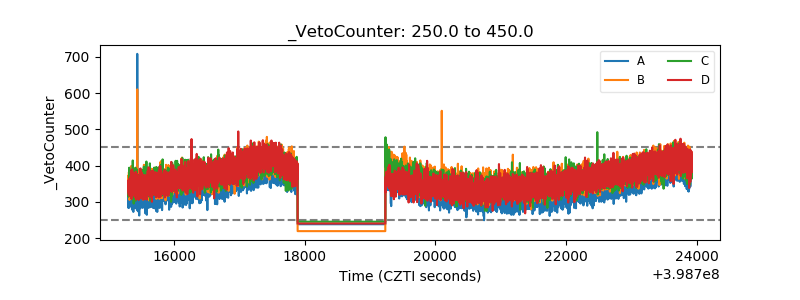 |