| Param | Original file | Final file |
|---|---|---|
| Filename | modeM0/AS1A10_094T19_9000005300cztM0_level2.fits | modeM0/AS1A10_094T19_9000005300cztM0_level2_quad_clean.evt |
| Size (bytes) | 42,413,760 | 35,694,720 |
| Size | 40.4 MB | 34.0 MB |
| Events in quadrant A | 250,846 | 195,688 |
| Events in quadrant B | 238,412 | 190,703 |
| Events in quadrant C | 247,880 | 189,872 |
| Events in quadrant D | 215,418 | 171,553 |
| Mode SS | |||
|---|---|---|---|
| Quadrant | BADHDUFLAG | Total packets | Discarded packets |
| A | 0 | 96 | 0 |
| B | 0 | 96 | 0 |
| C | 0 | 96 | 0 |
| D | 0 | 96 | 0 |
| Mode M9 | |||
|---|---|---|---|
| Quadrant | BADHDUFLAG | Total packets | Discarded packets |
| A | 0 | 12 | 0 |
| B | 0 | 12 | 0 |
| C | 0 | 12 | 0 |
| D | 0 | 12 | 0 |
| Mode M0 | |||
|---|---|---|---|
| Quadrant | BADHDUFLAG | Total packets | Discarded packets |
| A | 0 | 9949 | 0 |
| B | 0 | 10964 | 0 |
| C | 0 | 10118 | 0 |
| D | 0 | 10736 | 0 |
| Quadrant | Total seconds | Saturated seconds | Saturation percentage |
|---|---|---|---|
| A | 4723 | 18 | 0.381114% |
| B | 4723 | 66 | 1.397417% |
| C | 4723 | 24 | 0.508152% |
| D | 4723 | 67 | 1.418590% |
Noise dominated data is calculated using 1-second bins in cleaned event files. If a bin has >2000 counts, and if more than 50% of those come from <1% of pixels, then it is considered to be noise-dominated and hence unusable.
| Quadrant | # 1 sec bins | Bins with >0 counts | Bins with >2000 counts | High rate bins dominated by noise | Noise dominated (total time) | Noise dominated (detector-on time) | Marked lightcurve |
|---|---|---|---|---|---|---|---|
| A | 4722 | 4722 | 0 | 0 | 0.00% | 0.00% |  |
| B | 4722 | 4722 | 0 | 0 | 0.00% | 0.00% |  |
| C | 4722 | 4722 | 0 | 0 | 0.00% | 0.00% |  |
| D | 4722 | 4721 | 0 | 0 | 0.00% | 0.00% |  |
Top three noisy pixels from each quadrant. If the there are fewer than three noisy pixels in the level2.evt file, extra rows are filled as -1
| Pixel properties | Quadrant properties | ||||||
|---|---|---|---|---|---|---|---|
| Quadrant | DetID | PixID | Counts | Sigma | Mean | Median | Sigma |
| A | 7 | 110 | 224 | 8.82 | 65 | 61 | 18.5 |
| A | 0 | 29 | 206 | 7.85 | 65 | 61 | 18.5 |
| A | 14 | 95 | 204 | 7.74 | 65 | 61 | 18.5 |
| B | 3 | 80 | 204 | 9.9 | 63 | 60 | 14.5 |
| B | 2 | 9 | 198 | 9.49 | 63 | 60 | 14.5 |
| B | 3 | 17 | 177 | 8.04 | 63 | 60 | 14.5 |
| C | 1 | 81 | 221 | 8.51 | 65 | 61 | 18.8 |
| C | 3 | 187 | 193 | 7.02 | 65 | 61 | 18.8 |
| C | 1 | 80 | 193 | 7.02 | 65 | 61 | 18.8 |
| D | 4 | 160 | 175 | 6.46 | 61 | 56 | 18.4 |
| D | 1 | 3 | 171 | 6.24 | 61 | 56 | 18.4 |
| D | 7 | 3 | 170 | 6.19 | 61 | 56 | 18.4 |
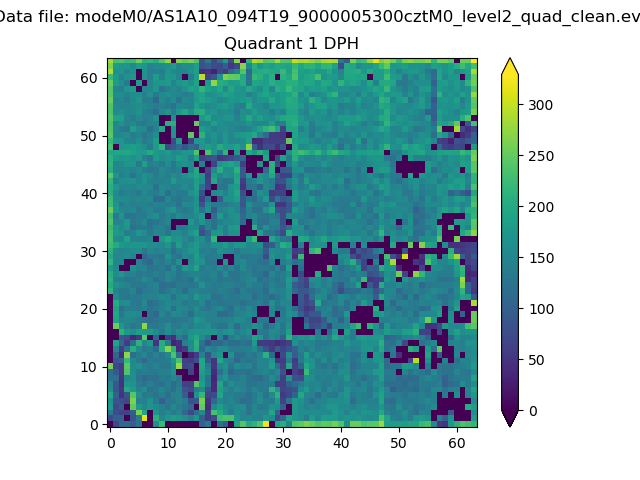
Histogram calculated using DETX and DETY for each event in the final _common_clean file
| Quadrant A |  |
 |
Quadrant B |
|---|---|---|---|
| Quadrant D | 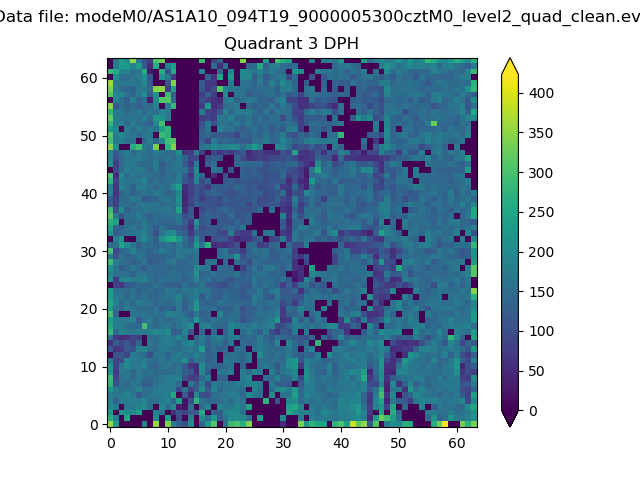 |
 |
Quadrant C |
| Plot type | Count rate plots | Images |
|---|---|---|
| Comparison with Poisson distribution Blue bars denote a histogram of data divided into 1 sec bins. Red curve is a Poisson curve with rate = median count rate of data. |
 |
 |
| Quadrant-wise count rates Data is divided into 100 sec bins |
 |
|
| Module-wise count rates for Quadrant A Data is divided into 100 sec bins |
 |
 |
| Module-wise count rates for Quadrant B Data is divided into 100 sec bins |
 |
 |
| Module-wise count rates for Quadrant C Data is divided into 100 sec bins |
 |
 |
| Module-wise count rates for Quadrant D Data is divided into 100 sec bins |
 |
 |
| Parameter | Plot |
|---|---|
| CZT HV Monitor |  |
| D_VDD |  |
| Temperature 1 |  |
| Veto HV Monitor |  |
| Veto LLD |  |
| Alpha Counter |  |
| _CPM_Rate |  |
| CZT Counter |  |
| +2.5 Volts monitor |  |
| +5 Volts monitor |  |
| _ROLL_ROT |  |
| _Roll_DEC |  |
| _Roll_RA |  |
| Veto Counter |  |