| Param | Original file | Final file |
|---|---|---|
| Filename | modeM0/AS1A10_094T19_9000005300_37283cztM0_level2.evt | modeM0/AS1A10_094T19_9000005300_37283cztM0_level2_quad_clean.evt |
| Size (bytes) | 331,485,120 | 85,544,640 |
| Size | 316.1 MB | 81.6 MB |
| Events in quadrant A | 2,281,624 | 569,918 |
| Events in quadrant B | 2,607,808 | 570,710 |
| Events in quadrant C | 2,390,104 | 572,180 |
| Events in quadrant D | 2,437,109 | 545,722 |
| Mode SS | |||
|---|---|---|---|
| Quadrant | BADHDUFLAG | Total packets | Discarded packets |
| A | 0 | 96 | 0 |
| B | 0 | 96 | 0 |
| C | 0 | 96 | 0 |
| D | 0 | 96 | 0 |
| Mode M9 | |||
|---|---|---|---|
| Quadrant | BADHDUFLAG | Total packets | Discarded packets |
| A | 0 | 12 | 0 |
| B | 0 | 12 | 0 |
| C | 0 | 12 | 0 |
| D | 0 | 12 | 0 |
| Mode M0 | |||
|---|---|---|---|
| Quadrant | BADHDUFLAG | Total packets | Discarded packets |
| A | 0 | 9950 | 1 |
| B | 0 | 10965 | 1 |
| C | 0 | 10119 | 1 |
| D | 0 | 10737 | 1 |
| Quadrant | Total seconds | Saturated seconds | Saturation percentage |
|---|---|---|---|
| A | 4723 | 18 | 0.381114% |
| B | 4723 | 66 | 1.397417% |
| C | 4723 | 24 | 0.508152% |
| D | 4723 | 67 | 1.418590% |
Noise dominated data is calculated using 1-second bins in cleaned event files. If a bin has >2000 counts, and if more than 50% of those come from <1% of pixels, then it is considered to be noise-dominated and hence unusable.
| Quadrant | # 1 sec bins | Bins with >0 counts | Bins with >2000 counts | High rate bins dominated by noise | Noise dominated (total time) | Noise dominated (detector-on time) | Marked lightcurve |
|---|---|---|---|---|---|---|---|
| A | 4723 | 4723 | 7 | 7 | 0.15% | 0.15% | 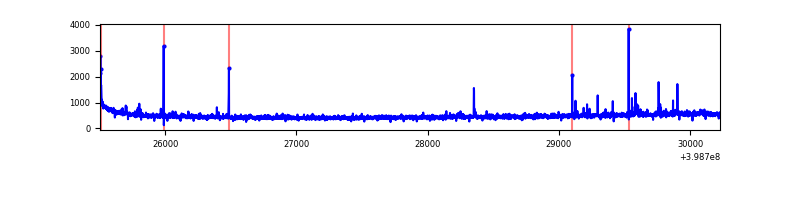 |
| B | 4723 | 4723 | 27 | 27 | 0.57% | 0.57% | 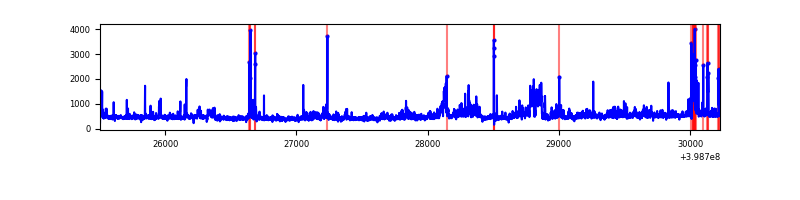 |
| C | 4723 | 4723 | 24 | 24 | 0.51% | 0.51% | 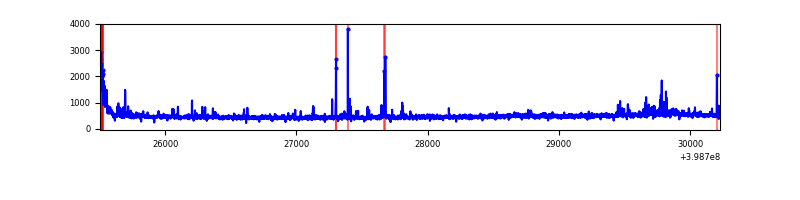 |
| D | 4723 | 4723 | 56 | 56 | 1.19% | 1.19% | 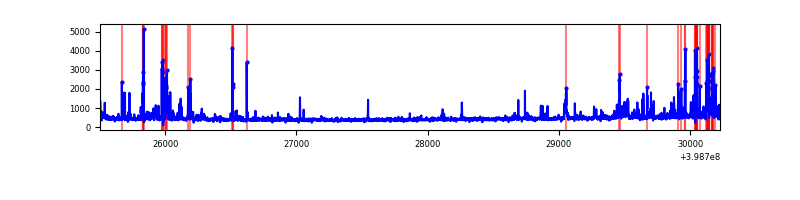 |
Top three noisy pixels from each quadrant. If the there are fewer than three noisy pixels in the level2.evt file, extra rows are filled as -1
| Pixel properties | Quadrant properties | ||||||
|---|---|---|---|---|---|---|---|
| Quadrant | DetID | PixID | Counts | Sigma | Mean | Median | Sigma |
| A | 10 | 83 | 190937 | 1802.69 | 520 | 509 | 105.6 |
| A | 9 | 143 | 29813 | 277.41 | 520 | 509 | 105.6 |
| A | 13 | 248 | 17460 | 160.47 | 520 | 509 | 105.6 |
| B | 5 | 200 | 206147 | 2075.04 | 514 | 501 | 99.1 |
| B | 0 | 213 | 187579 | 1887.68 | 514 | 501 | 99.1 |
| B | 5 | 172 | 148194 | 1490.28 | 514 | 501 | 99.1 |
| C | 15 | 214 | 195522 | 1630.73 | 510 | 513 | 119.6 |
| C | 1 | 23 | 81918 | 680.74 | 510 | 513 | 119.6 |
| C | 0 | 10 | 74026 | 614.74 | 510 | 513 | 119.6 |
| D | 13 | 249 | 183448 | 1481.48 | 508 | 494 | 123.5 |
| D | 12 | 233 | 72766 | 585.22 | 508 | 494 | 123.5 |
| D | 2 | 249 | 72321 | 581.62 | 508 | 494 | 123.5 |
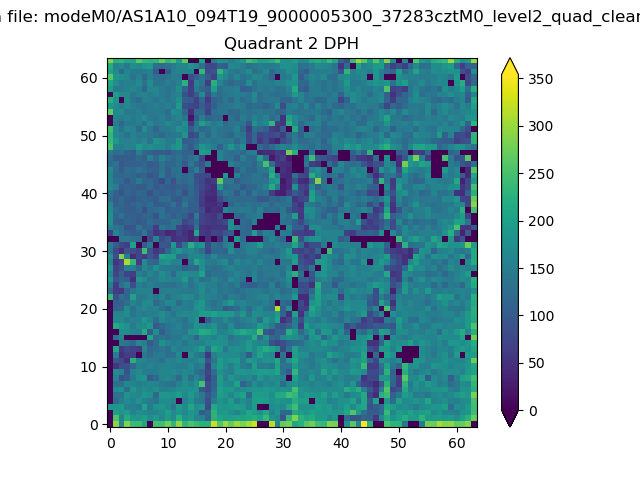
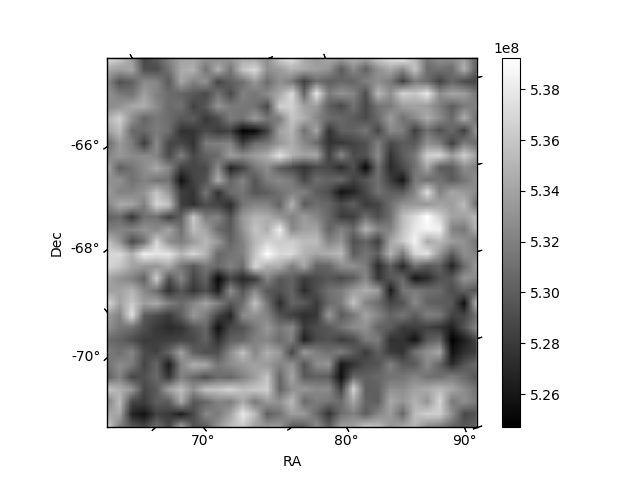
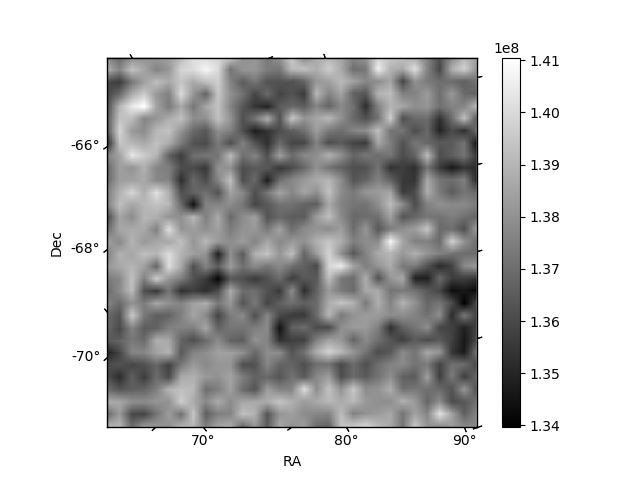
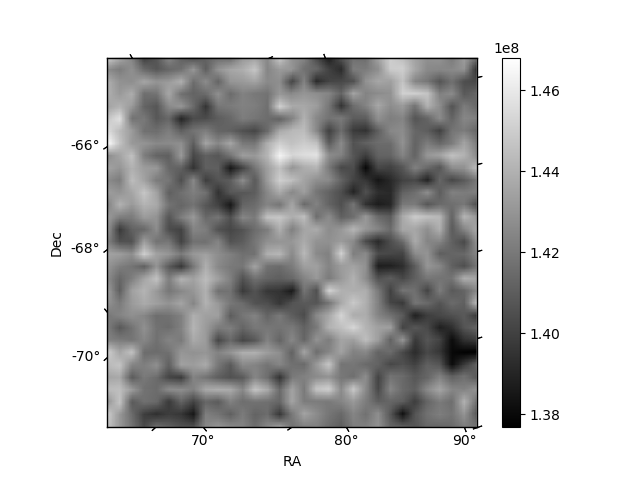
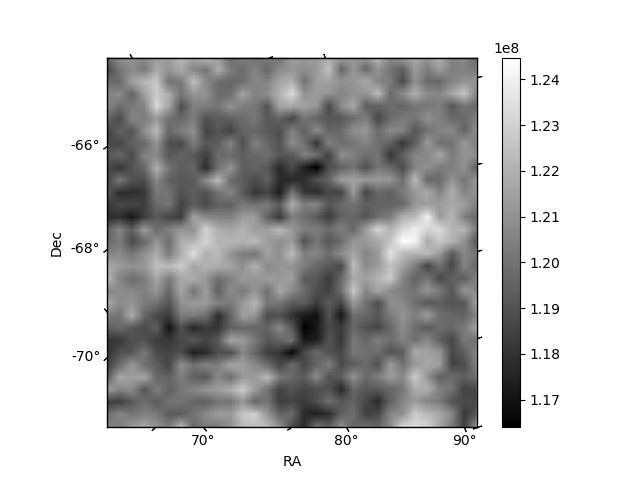
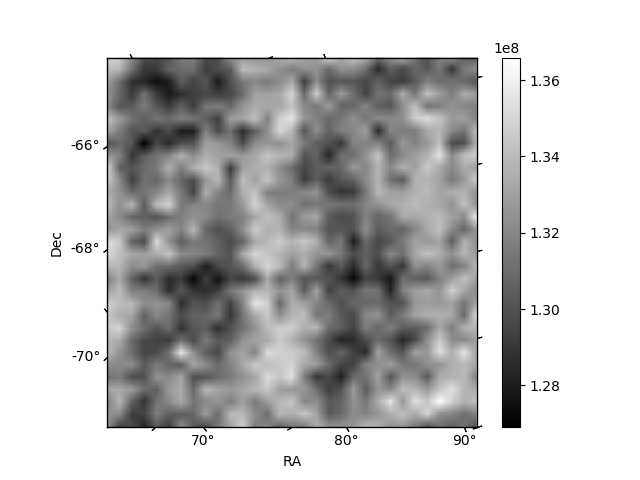
Histogram calculated using DETX and DETY for each event in the final _common_clean file
| Quadrant A | 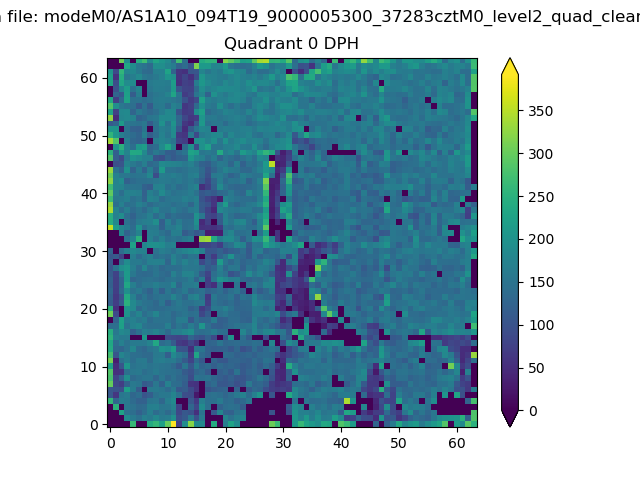 |
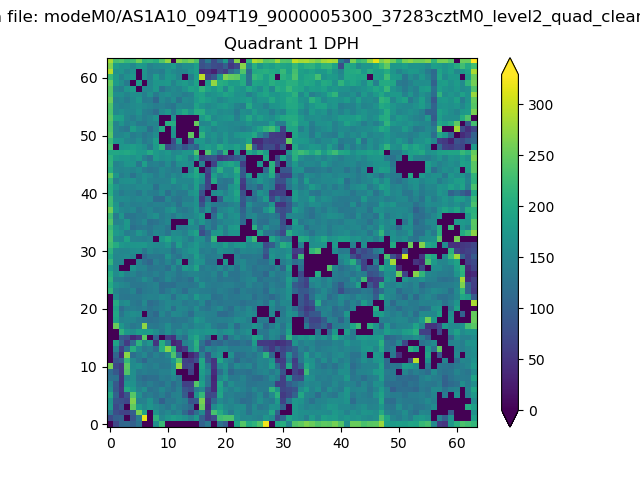 |
Quadrant B |
|---|---|---|---|
| Quadrant D | 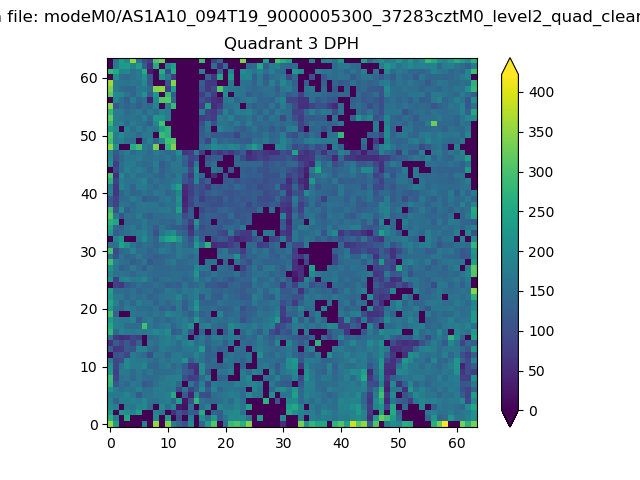 |
 |
Quadrant C |
| Plot type | Count rate plots | Images |
|---|---|---|
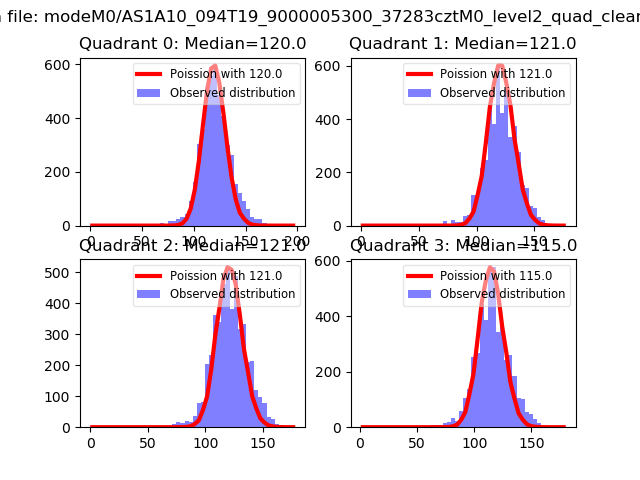
| Comparison with Poisson distribution Blue bars denote a histogram of data divided into 1 sec bins. Red curve is a Poisson curve with rate = median count rate of data. |
 |
 |
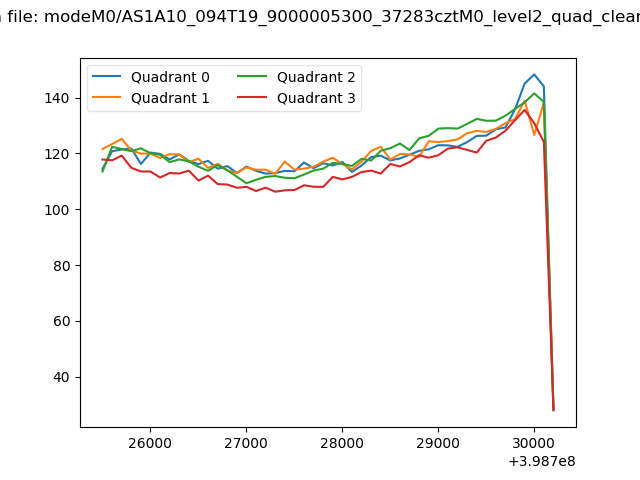
| Quadrant-wise count rates Data is divided into 100 sec bins |
 |
|
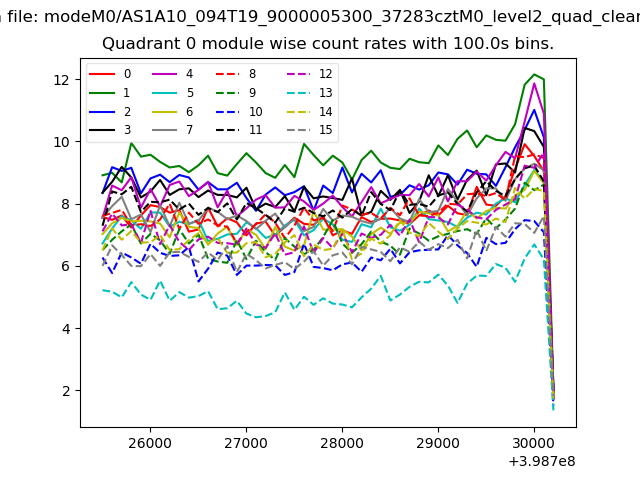
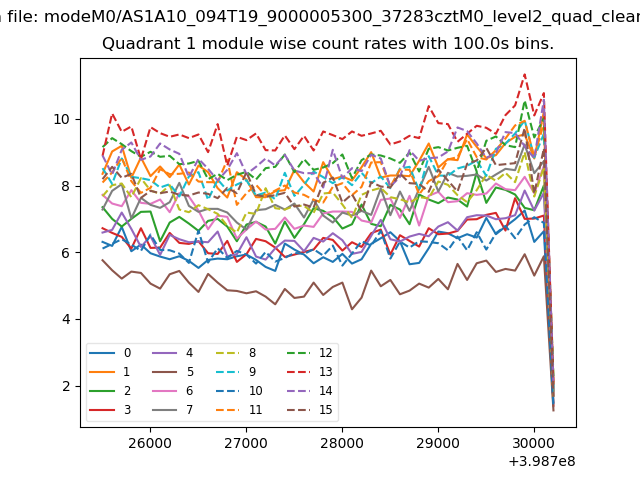
| Module-wise count rates for Quadrant A Data is divided into 100 sec bins |
 |
 |
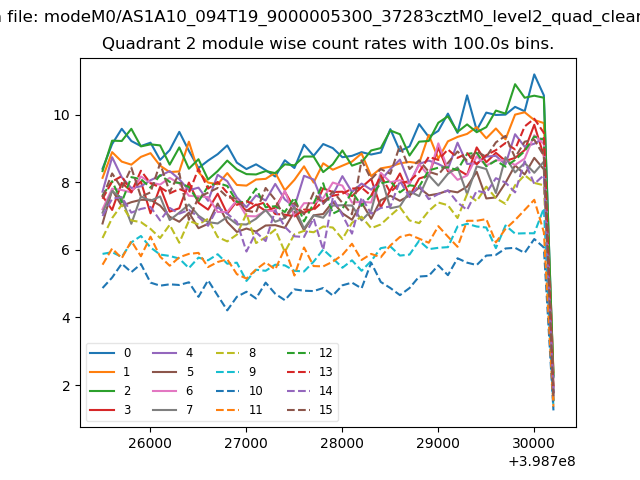
| Module-wise count rates for Quadrant B Data is divided into 100 sec bins |
 |
 |
| Module-wise count rates for Quadrant C Data is divided into 100 sec bins |
 |
 |
| Module-wise count rates for Quadrant D Data is divided into 100 sec bins |
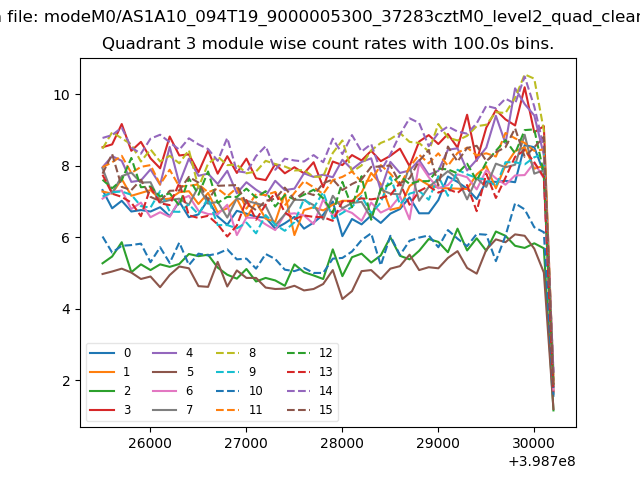 |
 |
| Parameter | Plot |
|---|---|
| CZT HV Monitor | 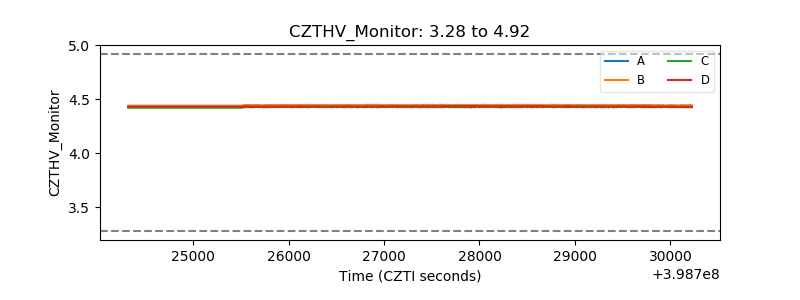 |
| D_VDD | 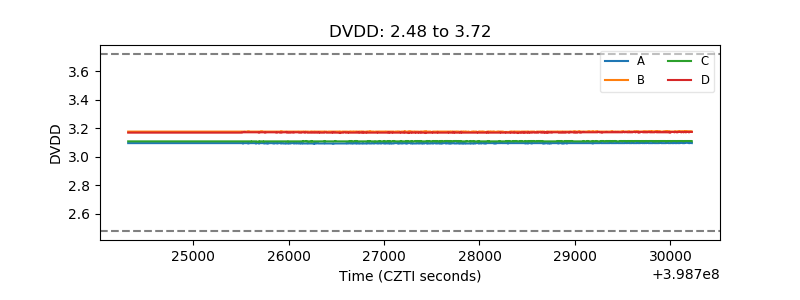 |
| Temperature 1 | 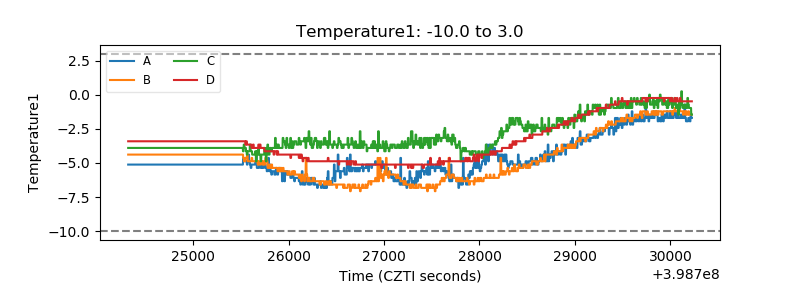 |
| Veto HV Monitor | 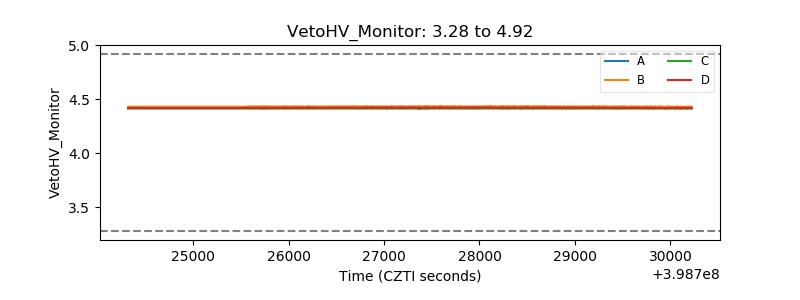 |
| Veto LLD | 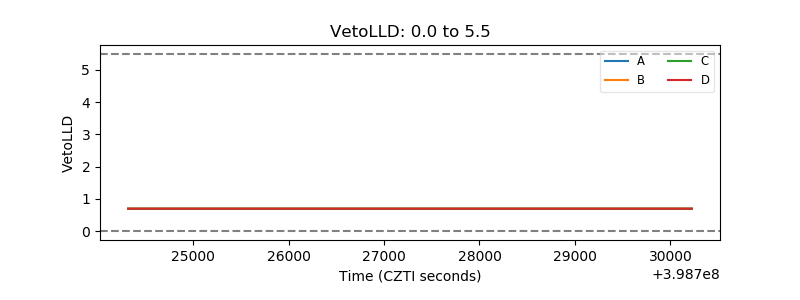 |
| Alpha Counter | 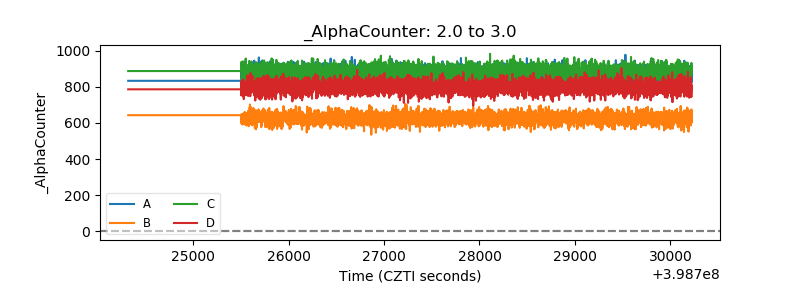 |
| _CPM_Rate | 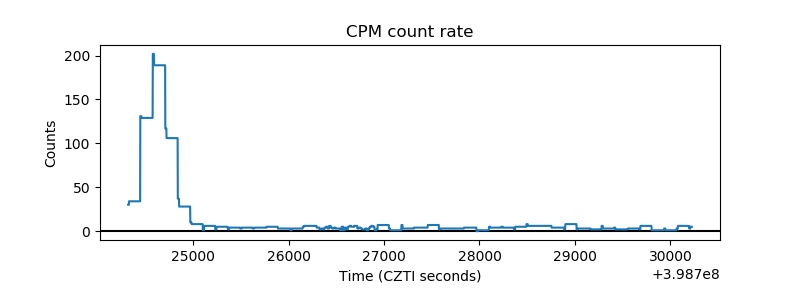 |
| CZT Counter | 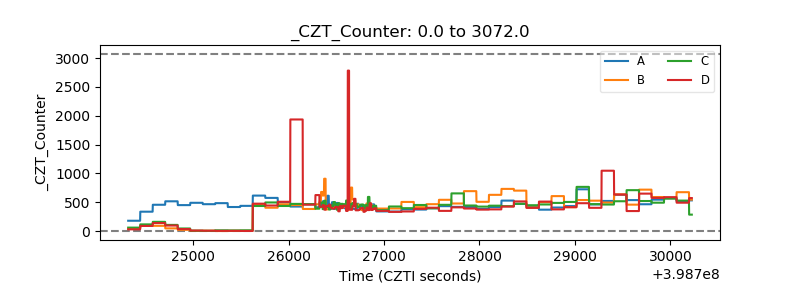 |
| +2.5 Volts monitor | 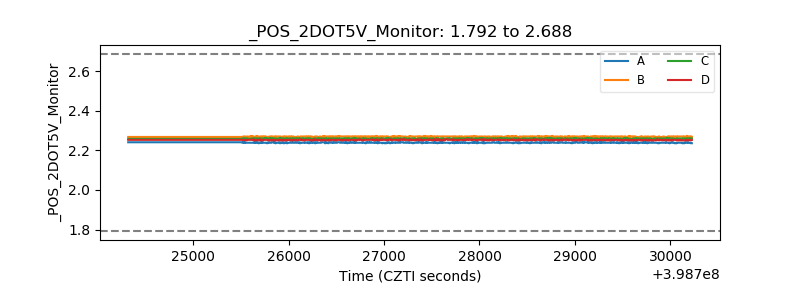 |
| +5 Volts monitor | 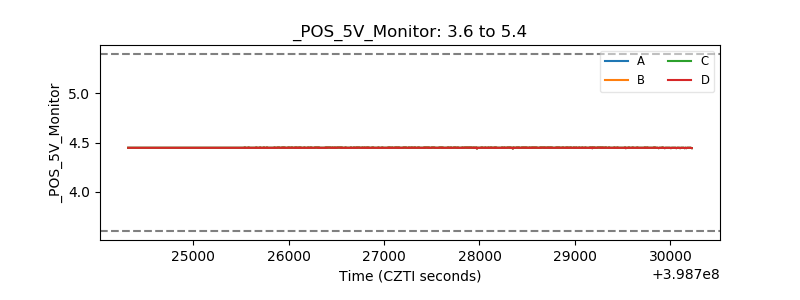 |
| _ROLL_ROT | 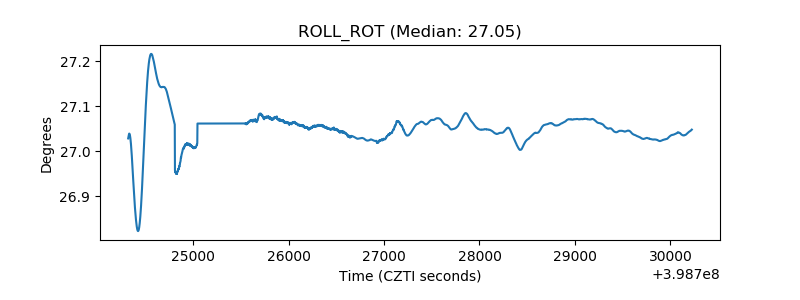 |
| _Roll_DEC | 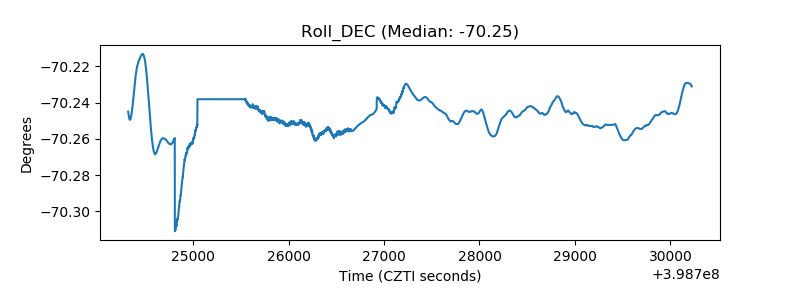 |
| _Roll_RA | 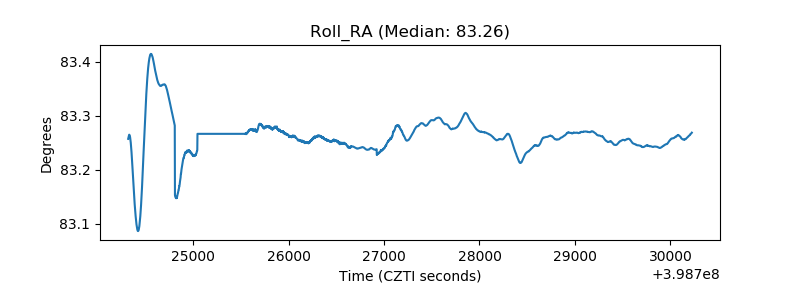 |
| Veto Counter | 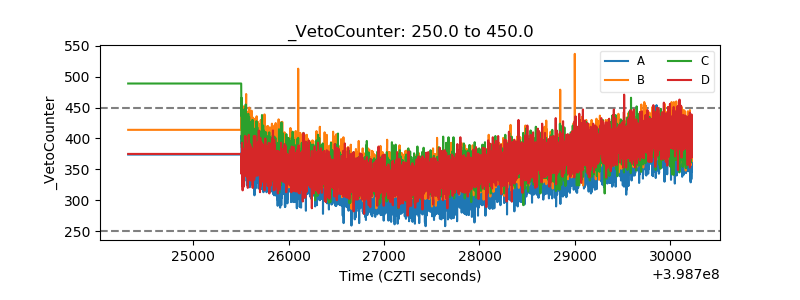 |