| Param | Original file | Final file |
|---|---|---|
| Filename | modeM0/AS1A10_103T07_9000005302_37286cztM0_level2.evt | modeM0/AS1A10_103T07_9000005302_37286cztM0_level2_quad_clean.evt |
| Size (bytes) | 491,417,280 | 59,935,680 |
| Size | 468.7 MB | 57.2 MB |
| Events in quadrant A | 2,758,726 | 380,561 |
| Events in quadrant B | 2,807,212 | 387,787 |
| Events in quadrant C | 3,146,333 | 386,173 |
| Events in quadrant D | 5,798,877 | 276,963 |
| Mode M0 | |||
|---|---|---|---|
| Quadrant | BADHDUFLAG | Total packets | Discarded packets |
| A | 0 | 11613 | 3 |
| B | 0 | 11880 | 2 |
| C | 0 | 12514 | 2 |
| D | 0 | 21032 | 2 |
| Mode M9 | |||
|---|---|---|---|
| Quadrant | BADHDUFLAG | Total packets | Discarded packets |
| A | 0 | 33 | 0 |
| B | 0 | 33 | 0 |
| C | 0 | 33 | 0 |
| D | 0 | 33 | 0 |
| Mode SS | |||
|---|---|---|---|
| Quadrant | BADHDUFLAG | Total packets | Discarded packets |
| A | 0 | 116 | 0 |
| B | 0 | 116 | 0 |
| C | 0 | 116 | 0 |
| D | 0 | 116 | 0 |
| Quadrant | Total seconds | Saturated seconds | Saturation percentage |
|---|---|---|---|
| A | 5459 | 12 | 0.219820% |
| B | 5459 | 64 | 1.172376% |
| C | 5459 | 146 | 2.674483% |
| D | 5459 | 1251 | 22.916285% |
Noise dominated data is calculated using 1-second bins in cleaned event files. If a bin has >2000 counts, and if more than 50% of those come from <1% of pixels, then it is considered to be noise-dominated and hence unusable.
| Quadrant | # 1 sec bins | Bins with >0 counts | Bins with >2000 counts | High rate bins dominated by noise | Noise dominated (total time) | Noise dominated (detector-on time) | Marked lightcurve |
|---|---|---|---|---|---|---|---|
| A | 8866 | 5461 | 8 | 8 | 0.09% | 0.15% | 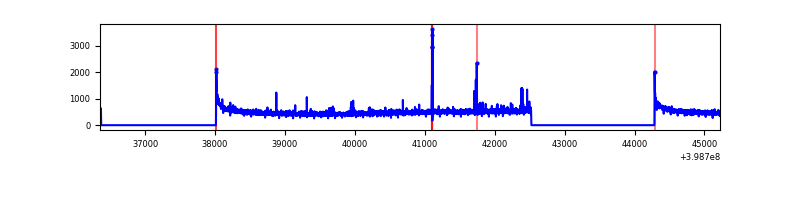 |
| B | 8866 | 5461 | 46 | 46 | 0.52% | 0.84% | 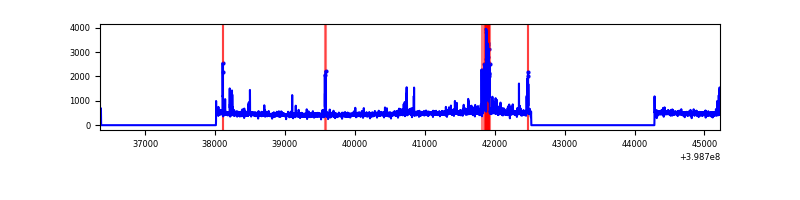 |
| C | 8866 | 5460 | 130 | 130 | 1.47% | 2.38% | 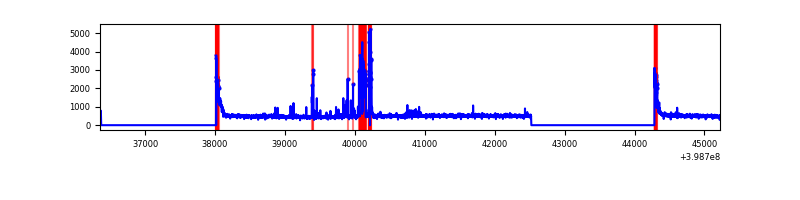 |
| D | 8866 | 5459 | 1118 | 1118 | 12.61% | 20.48% | 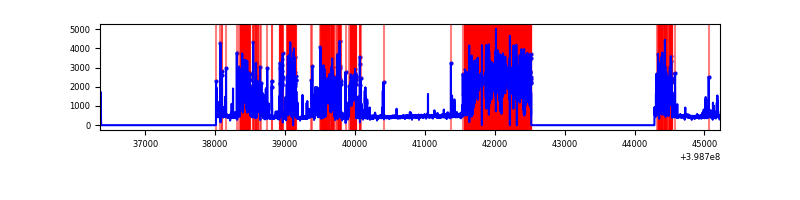 |
Top three noisy pixels from each quadrant. If the there are fewer than three noisy pixels in the level2.evt file, extra rows are filled as -1
| Pixel properties | Quadrant properties | ||||||
|---|---|---|---|---|---|---|---|
| Quadrant | DetID | PixID | Counts | Sigma | Mean | Median | Sigma |
| A | 10 | 83 | 265473 | 2094.0 | 623 | 613 | 126.5 |
| A | 9 | 143 | 32114 | 249.05 | 623 | 613 | 126.5 |
| A | 13 | 248 | 19310 | 147.82 | 623 | 613 | 126.5 |
| B | 5 | 200 | 144399 | 1192.65 | 624 | 607 | 120.6 |
| B | 5 | 172 | 75394 | 620.3 | 624 | 607 | 120.6 |
| B | 0 | 213 | 61722 | 506.9 | 624 | 607 | 120.6 |
| C | 1 | 23 | 300762 | 2130.25 | 610 | 616 | 140.9 |
| C | 15 | 214 | 231314 | 1637.35 | 610 | 616 | 140.9 |
| C | 0 | 10 | 196010 | 1386.79 | 610 | 616 | 140.9 |
| D | 10 | 253 | 1653325 | 12822.91 | 526 | 513 | 128.9 |
| D | 2 | 249 | 1477347 | 11457.64 | 526 | 513 | 128.9 |
| D | 13 | 249 | 405860 | 3144.78 | 526 | 513 | 128.9 |
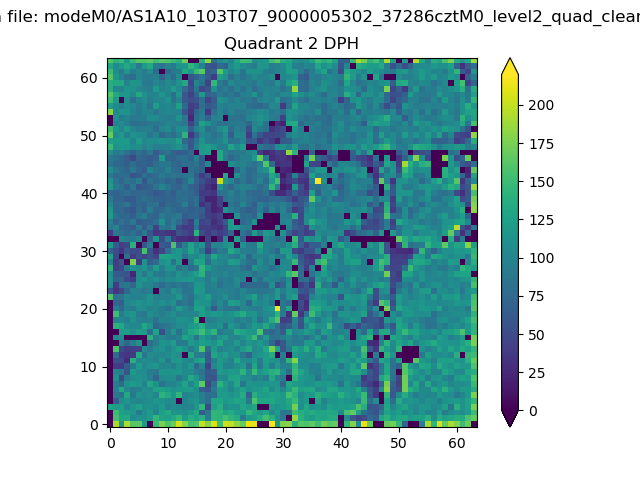
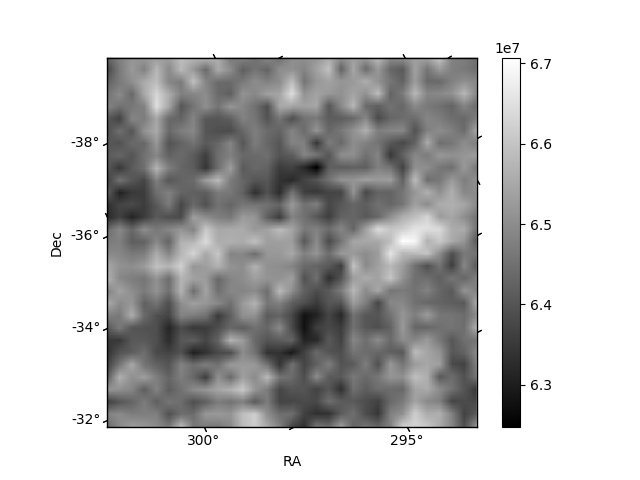
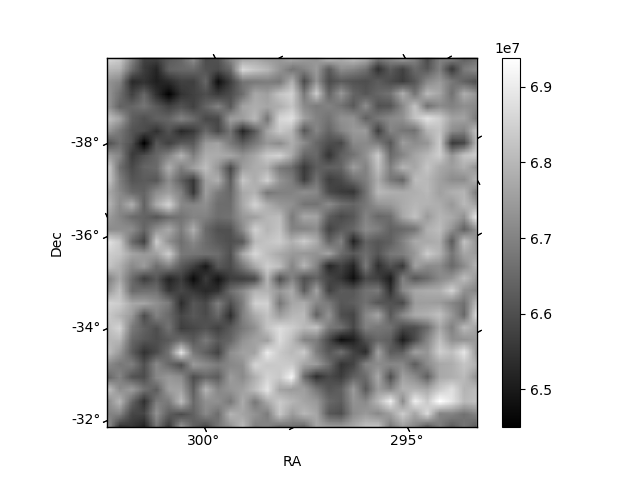
Histogram calculated using DETX and DETY for each event in the final _common_clean file
| Quadrant A | 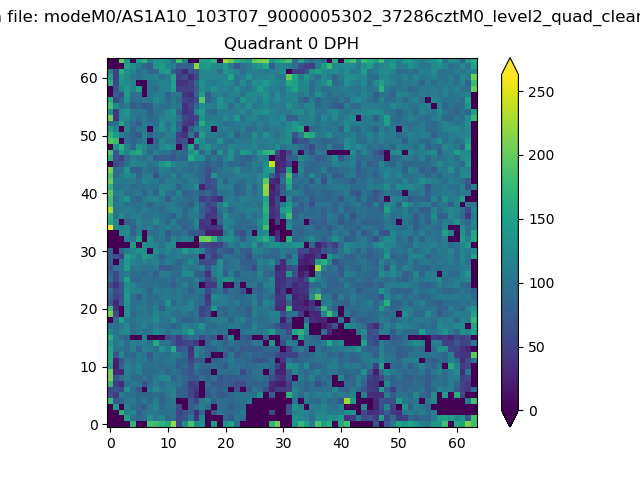 |
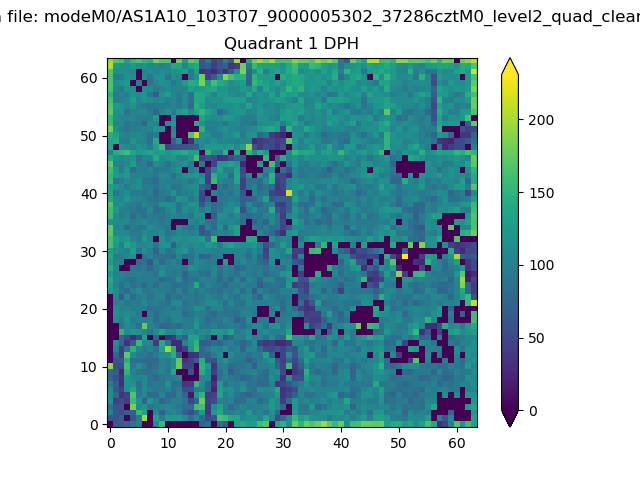 |
Quadrant B |
|---|---|---|---|
| Quadrant D | 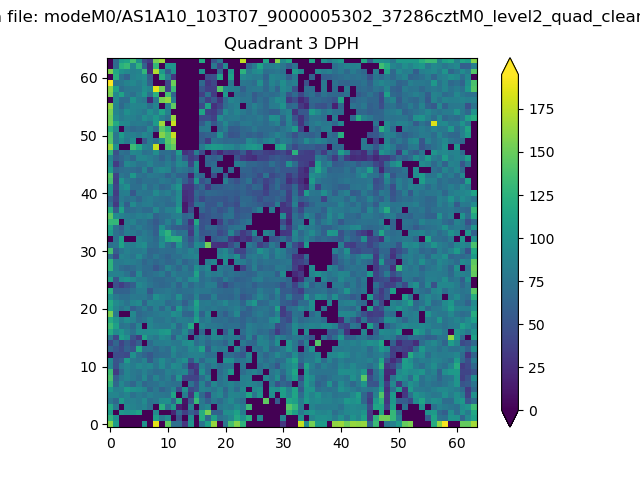 |
 |
Quadrant C |
| Plot type | Count rate plots | Images |
|---|---|---|
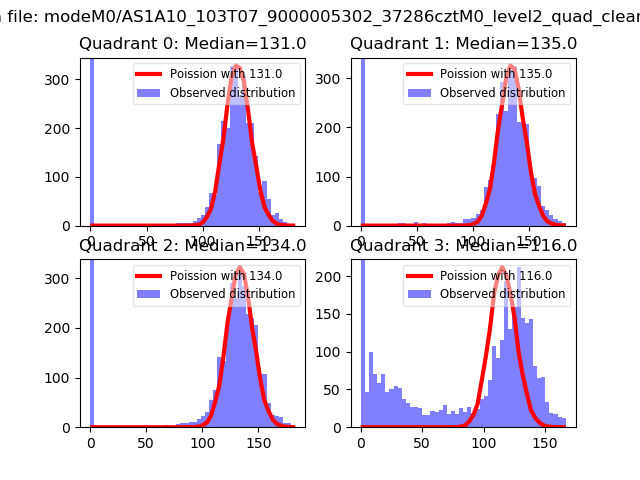
| Comparison with Poisson distribution Blue bars denote a histogram of data divided into 1 sec bins. Red curve is a Poisson curve with rate = median count rate of data. |
 |
 |
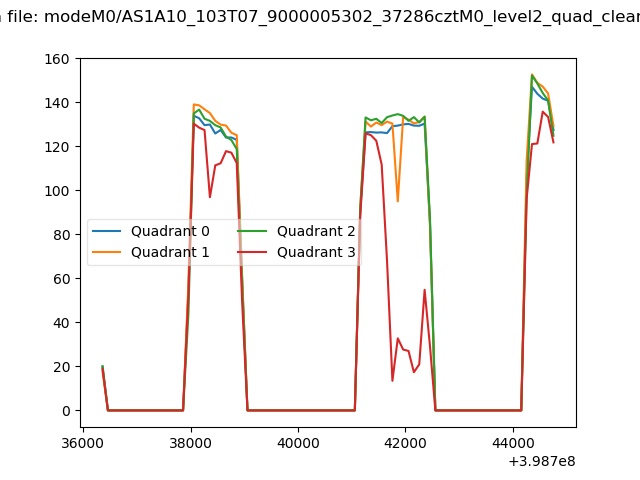
| Quadrant-wise count rates Data is divided into 100 sec bins |
 |
|
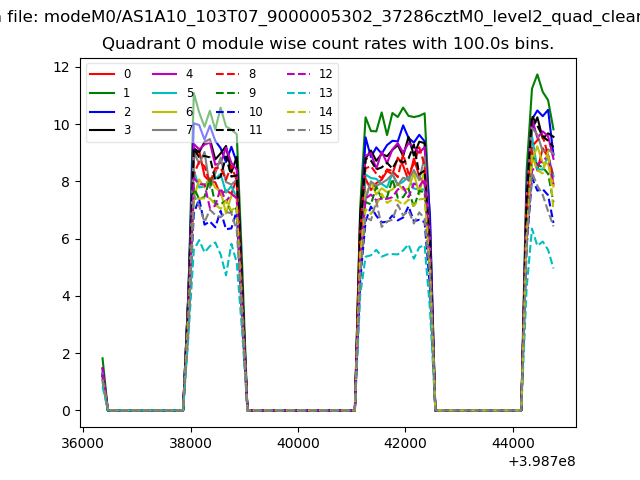
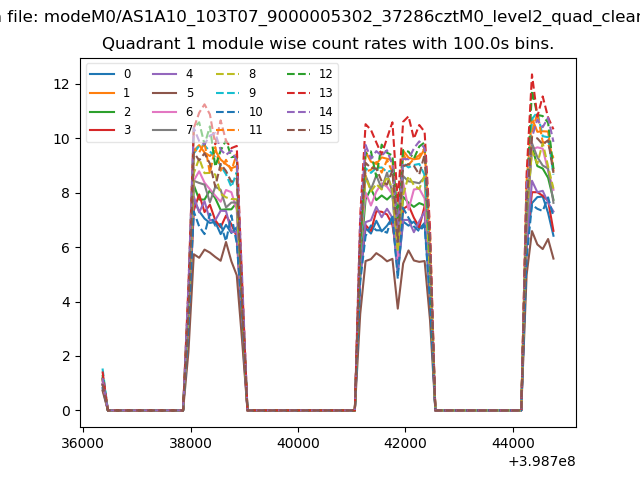
| Module-wise count rates for Quadrant A Data is divided into 100 sec bins |
 |
 |
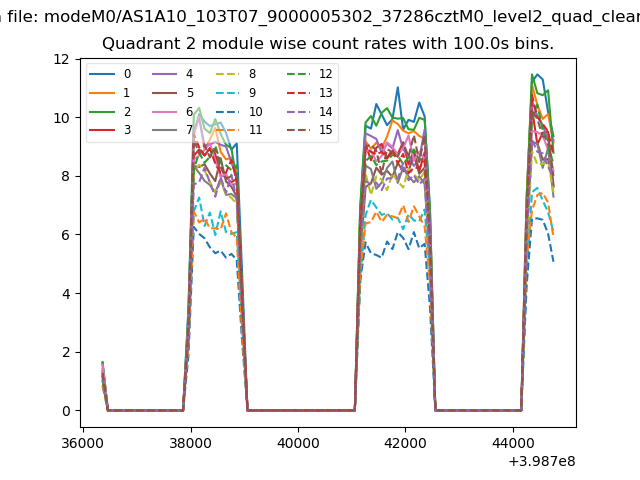
| Module-wise count rates for Quadrant B Data is divided into 100 sec bins |
 |
 |
| Module-wise count rates for Quadrant C Data is divided into 100 sec bins |
 |
 |
| Module-wise count rates for Quadrant D Data is divided into 100 sec bins |
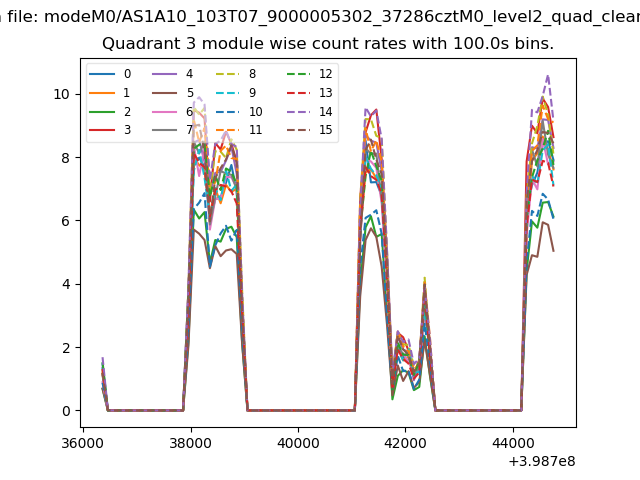 |
 |
| Parameter | Plot |
|---|---|
| CZT HV Monitor | 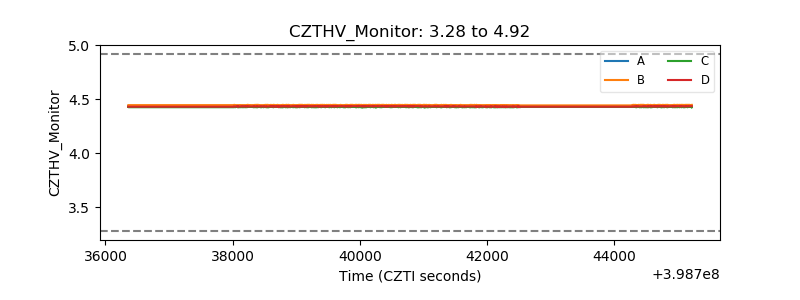 |
| D_VDD | 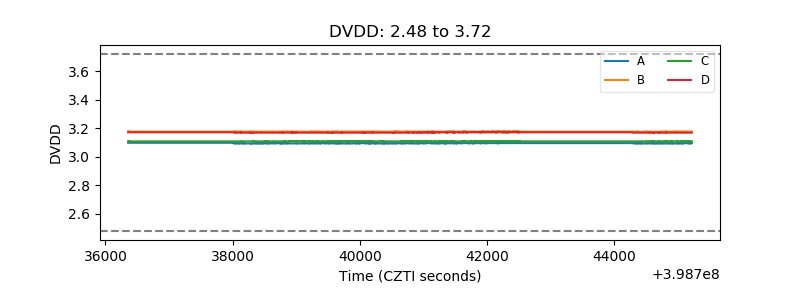 |
| Temperature 1 | 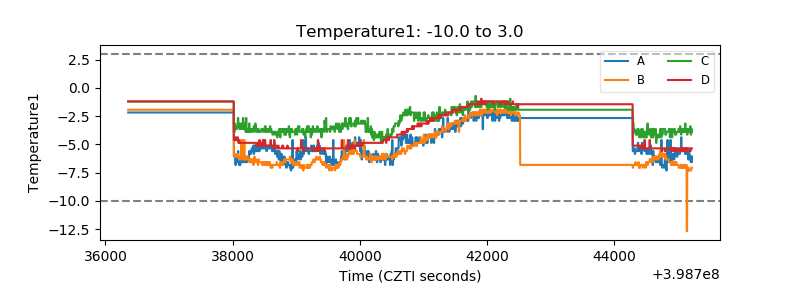 |
| Veto HV Monitor | 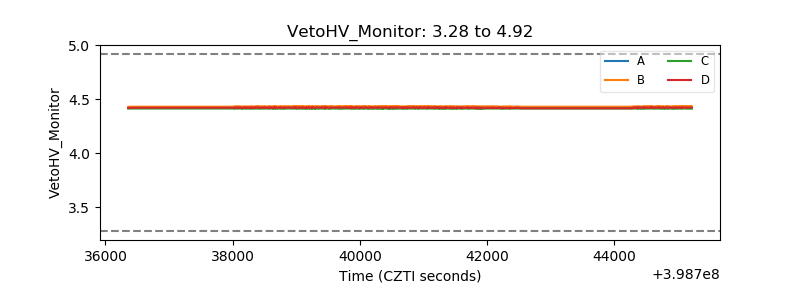 |
| Veto LLD |  |
| Alpha Counter | 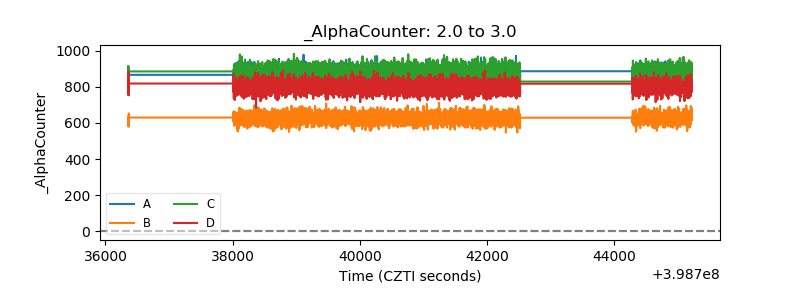 |
| _CPM_Rate | 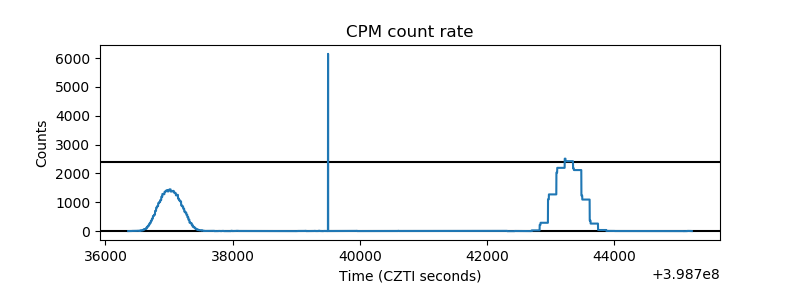 |
| CZT Counter | 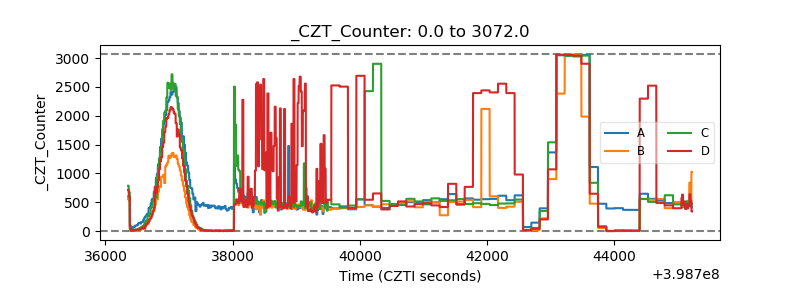 |
| +2.5 Volts monitor | 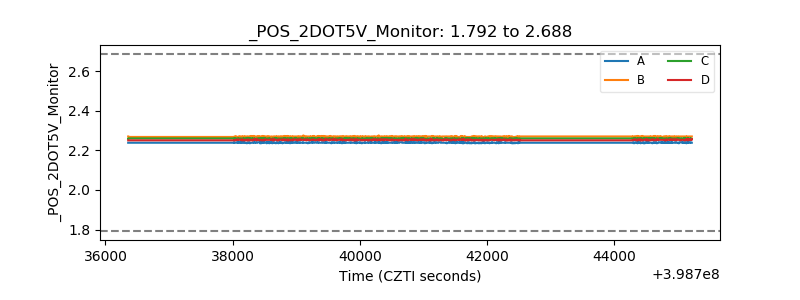 |
| +5 Volts monitor |  |
| _ROLL_ROT | 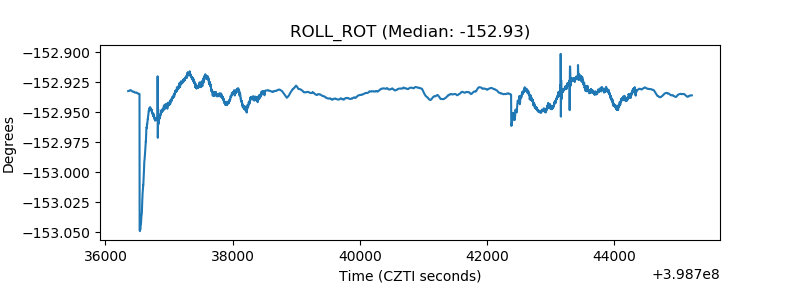 |
| _Roll_DEC | 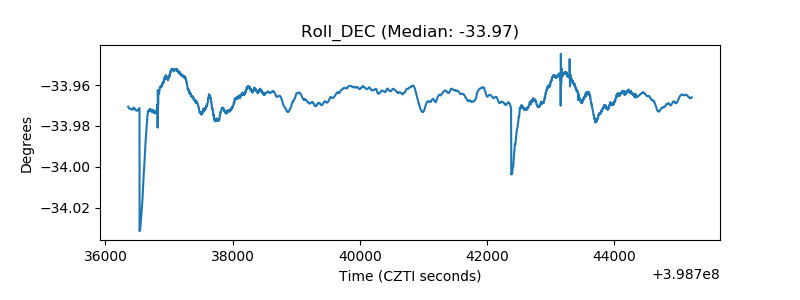 |
| _Roll_RA | 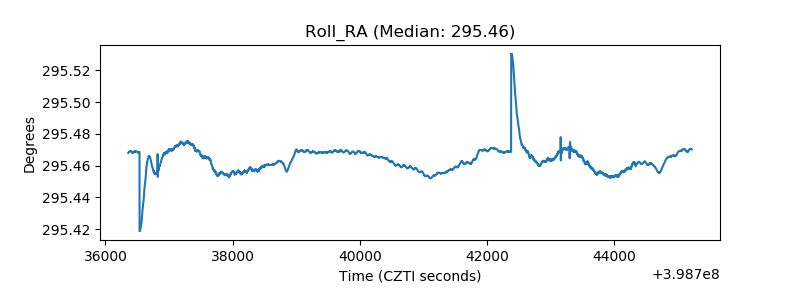 |
| Veto Counter | 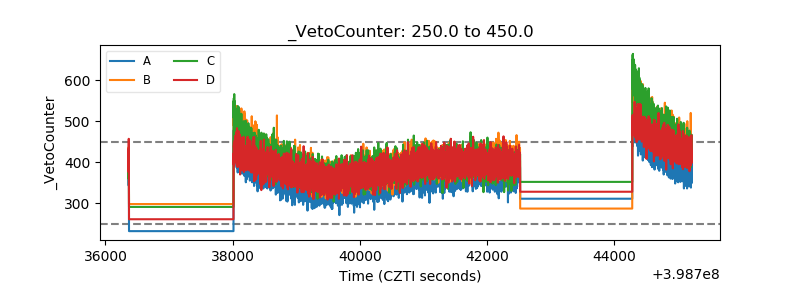 |