| Param | Original file | Final file |
|---|---|---|
| Filename | modeM0/AS1A10_103T07_9000005302_37287cztM0_level2.evt | modeM0/AS1A10_103T07_9000005302_37287cztM0_level2_quad_clean.evt |
| Size (bytes) | 490,708,800 | 52,565,760 |
| Size | 468.0 MB | 50.1 MB |
| Events in quadrant A | 2,919,537 | 311,489 |
| Events in quadrant B | 2,779,361 | 324,409 |
| Events in quadrant C | 3,480,777 | 310,896 |
| Events in quadrant D | 5,323,352 | 274,142 |
| Mode M0 | |||
|---|---|---|---|
| Quadrant | BADHDUFLAG | Total packets | Discarded packets |
| A | 0 | 11869 | 3 |
| B | 0 | 11502 | 2 |
| C | 0 | 13370 | 2 |
| D | 0 | 19457 | 2 |
| Mode M9 | |||
|---|---|---|---|
| Quadrant | BADHDUFLAG | Total packets | Discarded packets |
| A | 0 | 30 | 0 |
| B | 0 | 30 | 0 |
| C | 0 | 30 | 0 |
| D | 0 | 31 | 0 |
| Mode SS | |||
|---|---|---|---|
| Quadrant | BADHDUFLAG | Total packets | Discarded packets |
| A | 0 | 108 | 0 |
| B | 0 | 108 | 0 |
| C | 0 | 108 | 0 |
| D | 0 | 108 | 0 |
| Quadrant | Total seconds | Saturated seconds | Saturation percentage |
|---|---|---|---|
| A | 5281 | 52 | 0.984662% |
| B | 5281 | 37 | 0.700625% |
| C | 5281 | 237 | 4.487786% |
| D | 5281 | 600 | 11.361485% |
Noise dominated data is calculated using 1-second bins in cleaned event files. If a bin has >2000 counts, and if more than 50% of those come from <1% of pixels, then it is considered to be noise-dominated and hence unusable.
| Quadrant | # 1 sec bins | Bins with >0 counts | Bins with >2000 counts | High rate bins dominated by noise | Noise dominated (total time) | Noise dominated (detector-on time) | Marked lightcurve |
|---|---|---|---|---|---|---|---|
| A | 7192 | 5282 | 34 | 34 | 0.47% | 0.64% | 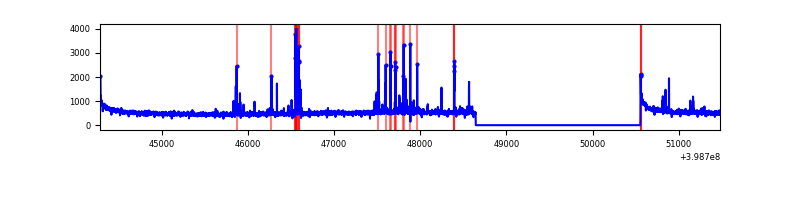 |
| B | 7192 | 5282 | 15 | 15 | 0.21% | 0.28% | 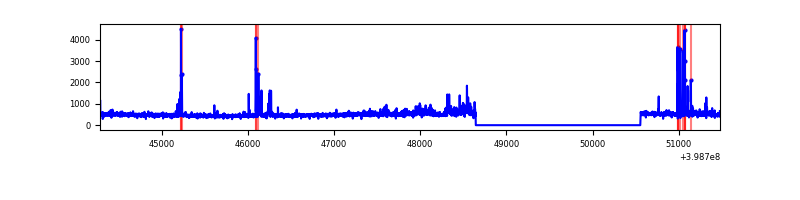 |
| C | 7192 | 5282 | 211 | 211 | 2.93% | 3.99% | 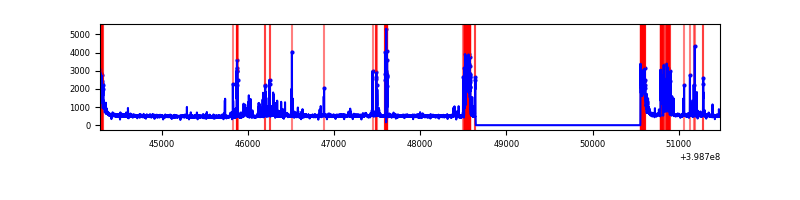 |
| D | 7192 | 5282 | 606 | 606 | 8.43% | 11.47% | 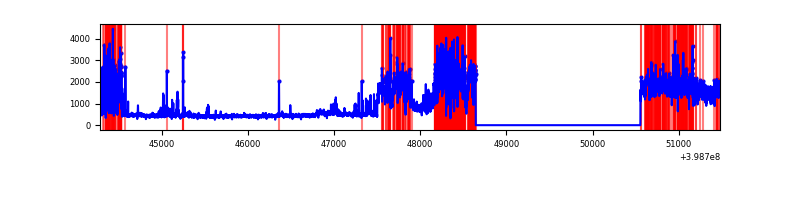 |
Top three noisy pixels from each quadrant. If the there are fewer than three noisy pixels in the level2.evt file, extra rows are filled as -1
| Pixel properties | Quadrant properties | ||||||
|---|---|---|---|---|---|---|---|
| Quadrant | DetID | PixID | Counts | Sigma | Mean | Median | Sigma |
| A | 10 | 83 | 258763 | 2070.15 | 624 | 612 | 124.7 |
| A | 7 | 16 | 127138 | 1014.63 | 624 | 612 | 124.7 |
| A | 9 | 143 | 54240 | 430.05 | 624 | 612 | 124.7 |
| B | 5 | 172 | 129594 | 1083.05 | 629 | 613 | 119.1 |
| B | 0 | 213 | 113624 | 948.95 | 629 | 613 | 119.1 |
| B | 0 | 230 | 22384 | 182.81 | 629 | 613 | 119.1 |
| C | 1 | 23 | 634493 | 4501.36 | 611 | 617 | 140.8 |
| C | 15 | 214 | 222925 | 1578.68 | 611 | 617 | 140.8 |
| C | 0 | 10 | 184719 | 1307.37 | 611 | 617 | 140.8 |
| D | 1 | 52 | 2077710 | 14216.37 | 595 | 580 | 146.1 |
| D | 2 | 249 | 363105 | 2481.21 | 595 | 580 | 146.1 |
| D | 10 | 253 | 248685 | 1698.09 | 595 | 580 | 146.1 |
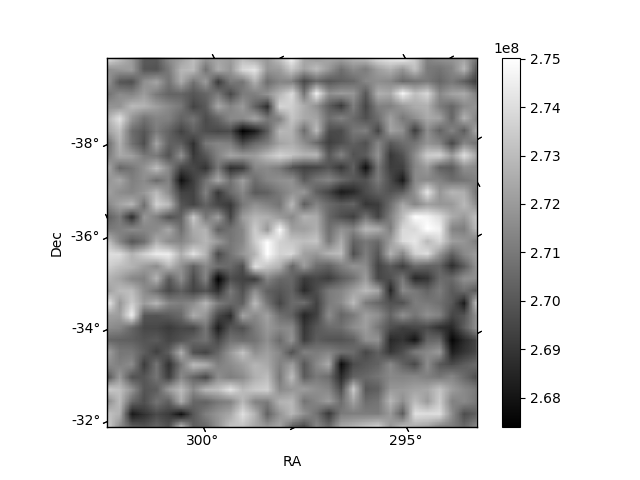
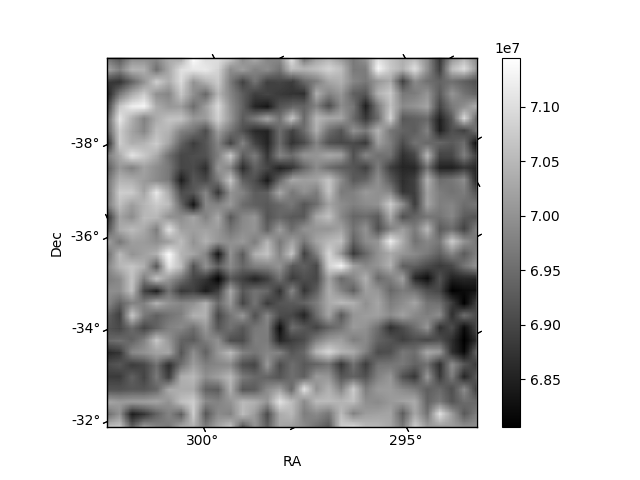
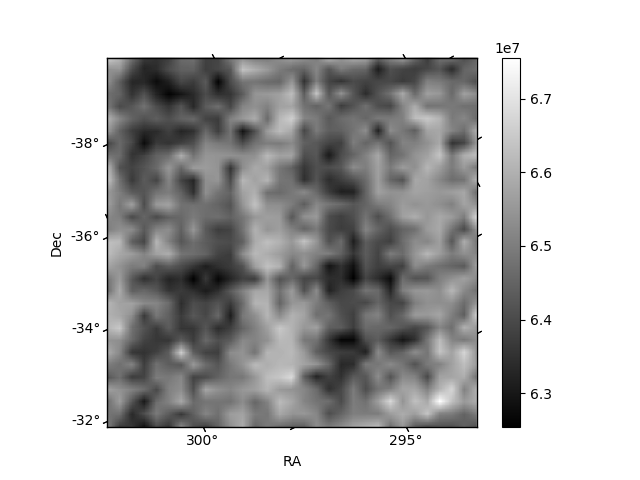
Histogram calculated using DETX and DETY for each event in the final _common_clean file
| Quadrant A | 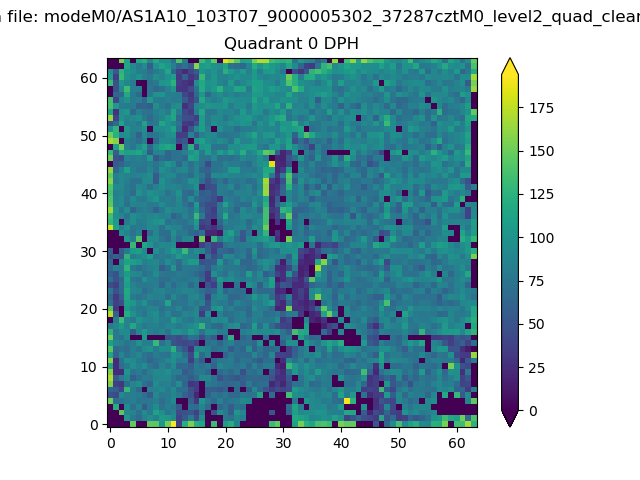 |
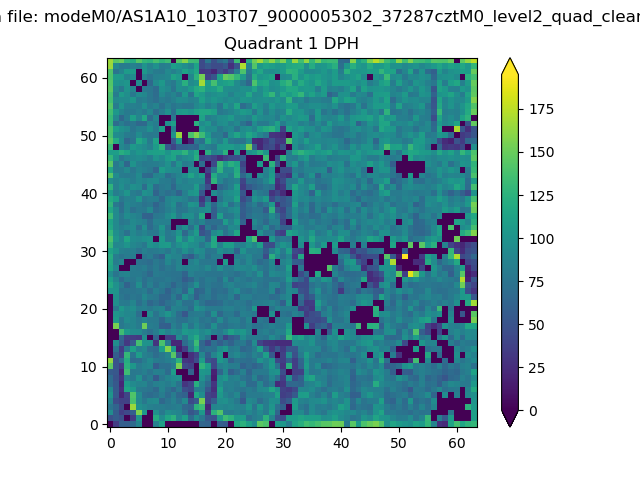 |
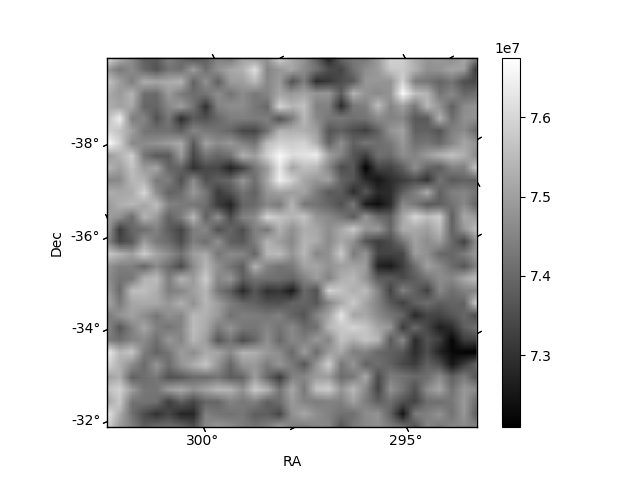
Quadrant B |
|---|---|---|---|
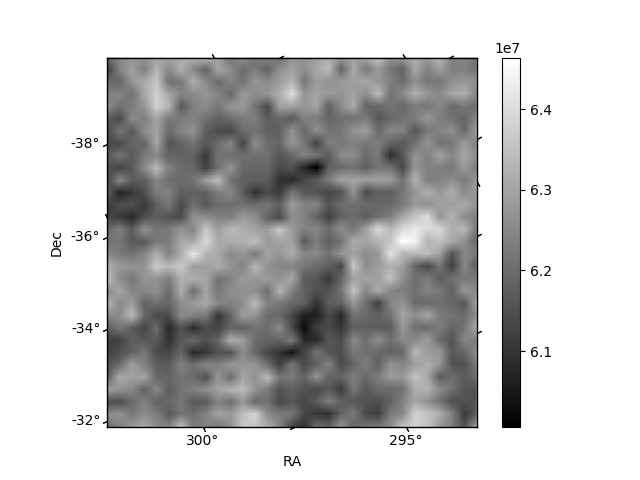
| Quadrant D | 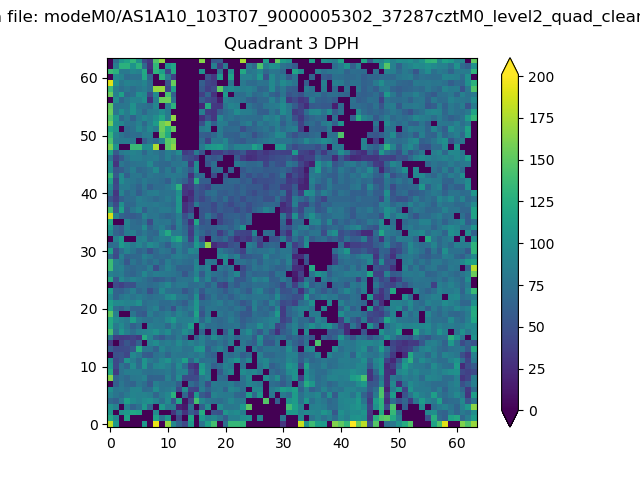 |
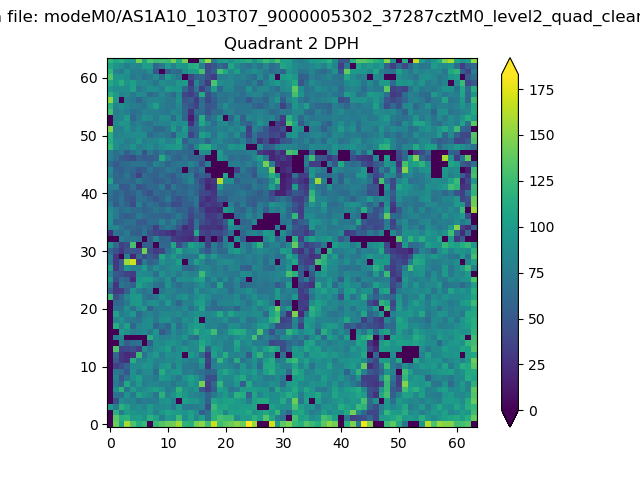 |
Quadrant C |
| Plot type | Count rate plots | Images |
|---|---|---|
| Comparison with Poisson distribution Blue bars denote a histogram of data divided into 1 sec bins. Red curve is a Poisson curve with rate = median count rate of data. |
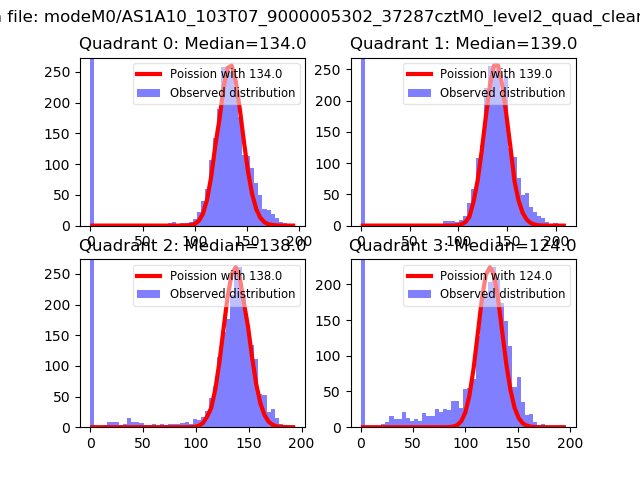 |
 |
| Quadrant-wise count rates Data is divided into 100 sec bins |
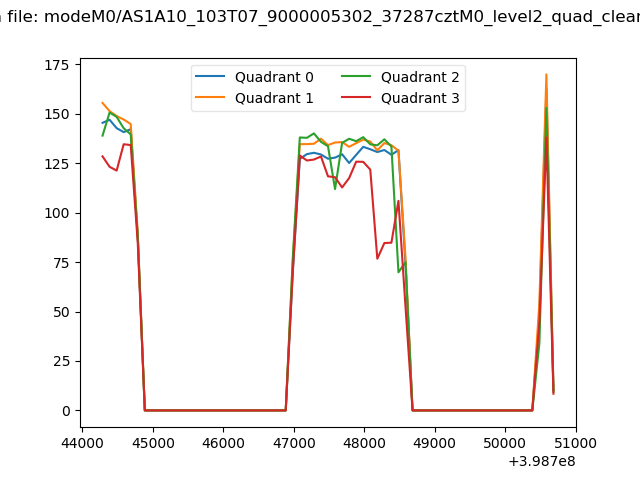 |
|
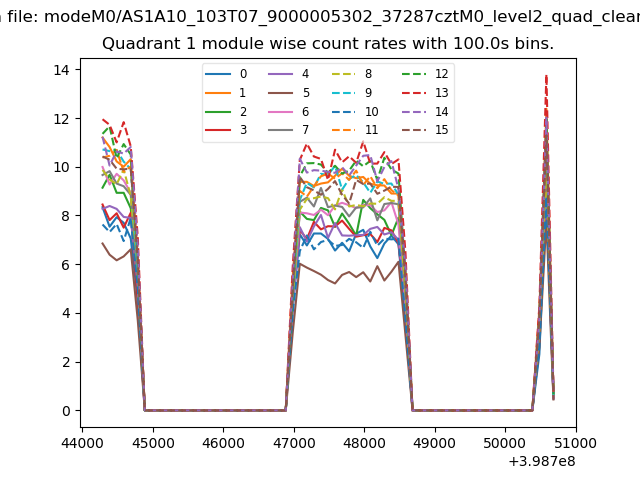
| Module-wise count rates for Quadrant A Data is divided into 100 sec bins |
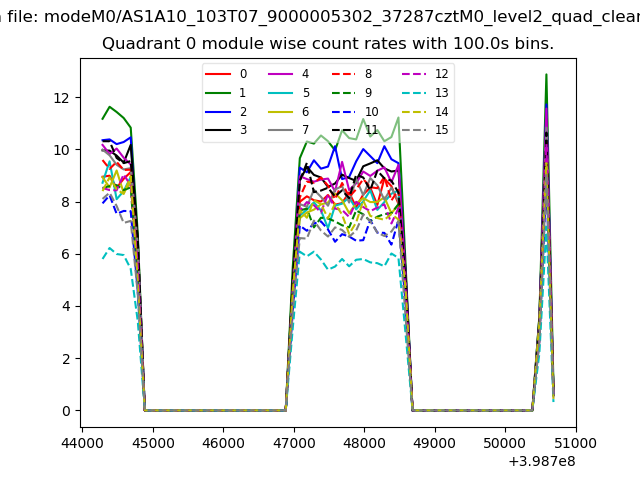 |
 |
| Module-wise count rates for Quadrant B Data is divided into 100 sec bins |
 |
 |
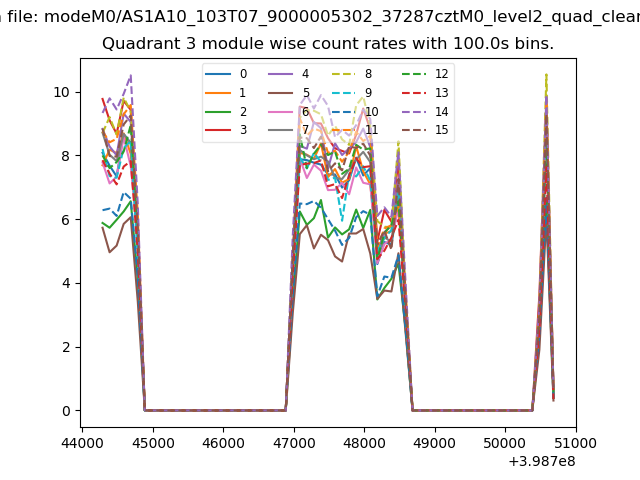
| Module-wise count rates for Quadrant C Data is divided into 100 sec bins |
 |
 |
| Module-wise count rates for Quadrant D Data is divided into 100 sec bins |
 |
 |
| Parameter | Plot |
|---|---|
| CZT HV Monitor | 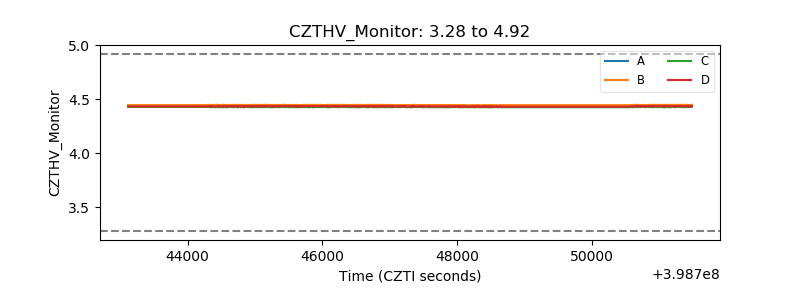 |
| D_VDD | 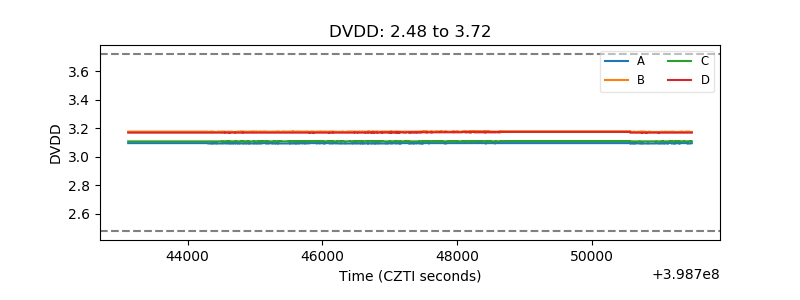 |
| Temperature 1 | 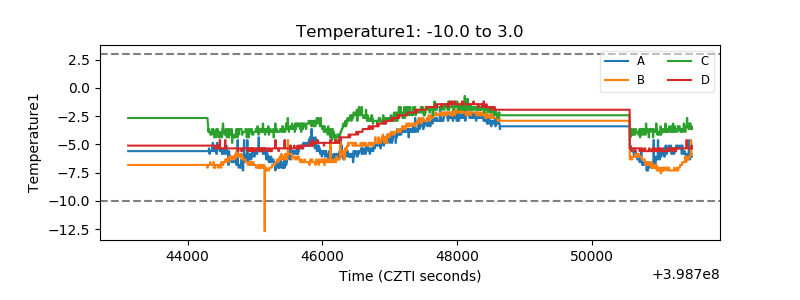 |
| Veto HV Monitor | 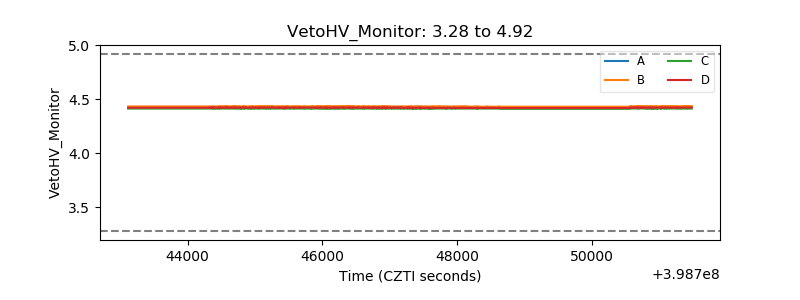 |
| Veto LLD | 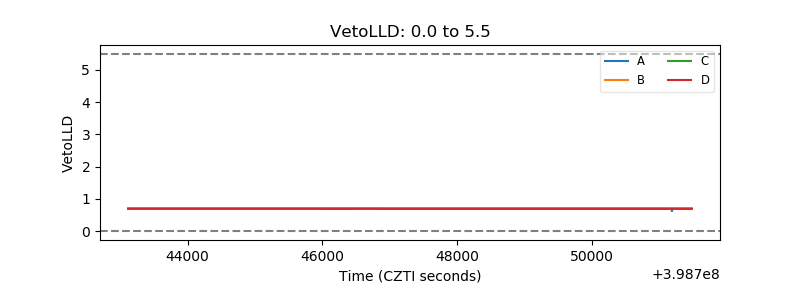 |
| Alpha Counter | 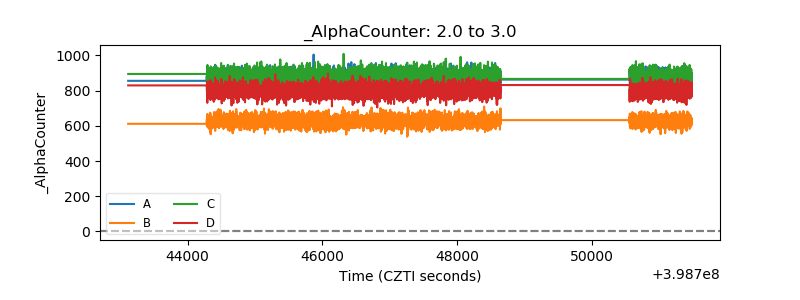 |
| _CPM_Rate | 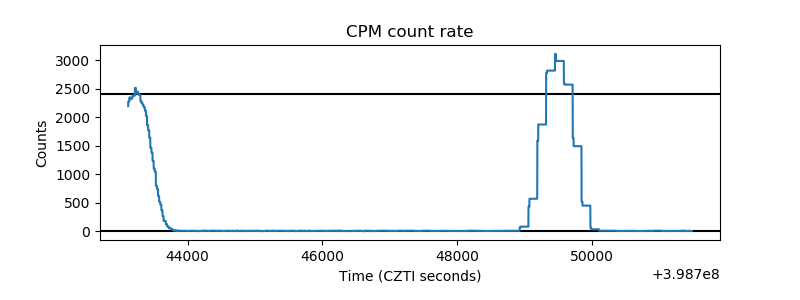 |
| CZT Counter | 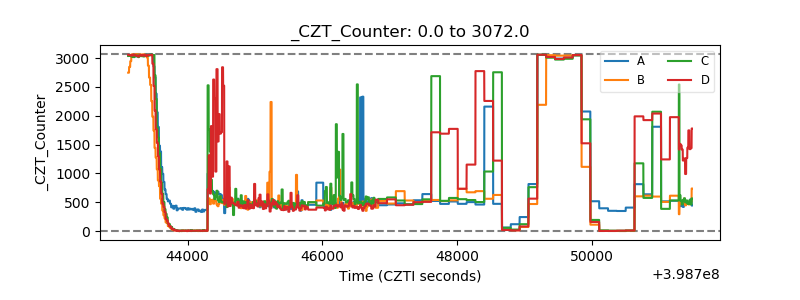 |
| +2.5 Volts monitor | 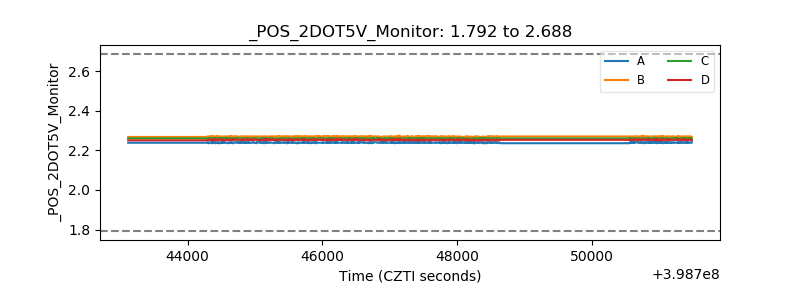 |
| +5 Volts monitor | 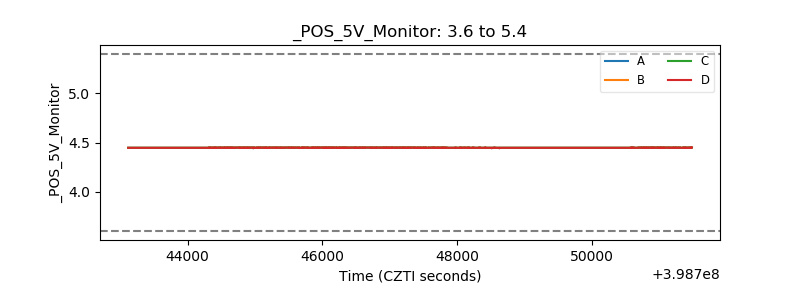 |
| _ROLL_ROT | 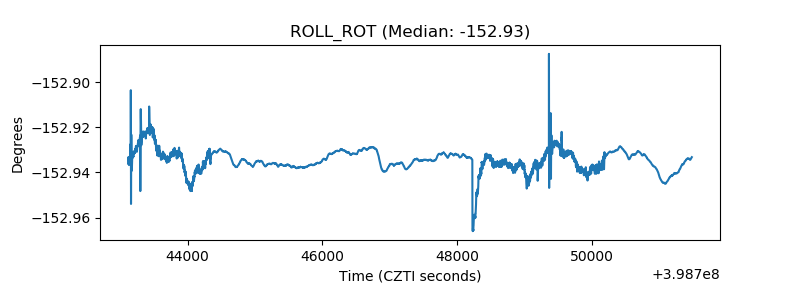 |
| _Roll_DEC | 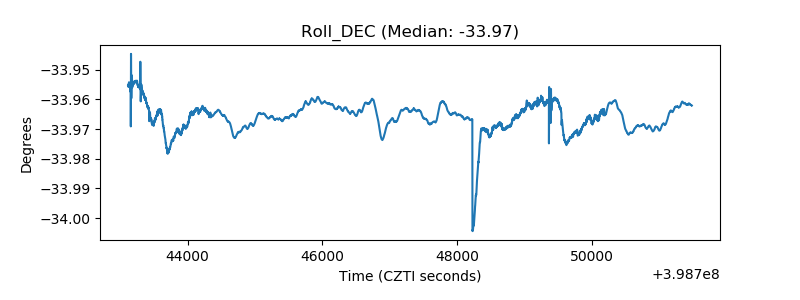 |
| _Roll_RA | 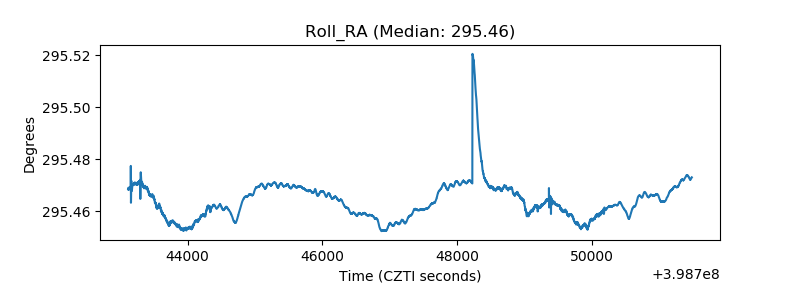 |
| Veto Counter | 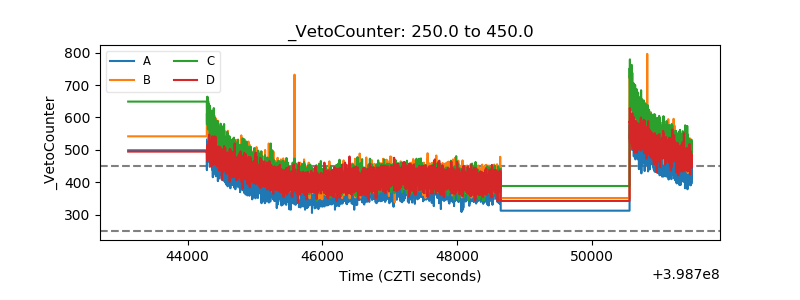 |