| Param | Original file | Final file |
|---|---|---|
| Filename | modeM0/AS1A10_103T07_9000005302_37288cztM0_level2.evt | modeM0/AS1A10_103T07_9000005302_37288cztM0_level2_quad_clean.evt |
| Size (bytes) | 444,876,480 | 50,117,760 |
| Size | 424.3 MB | 47.8 MB |
| Events in quadrant A | 2,862,400 | 285,129 |
| Events in quadrant B | 2,713,916 | 295,608 |
| Events in quadrant C | 3,422,970 | 295,428 |
| Events in quadrant D | 4,122,611 | 278,193 |
| Mode M0 | |||
|---|---|---|---|
| Quadrant | BADHDUFLAG | Total packets | Discarded packets |
| A | 0 | 11483 | 3 |
| B | 0 | 10999 | 2 |
| C | 0 | 13067 | 2 |
| D | 0 | 15577 | 2 |
| Mode M9 | |||
|---|---|---|---|
| Quadrant | BADHDUFLAG | Total packets | Discarded packets |
| A | 0 | 29 | 0 |
| B | 0 | 29 | 0 |
| C | 0 | 29 | 0 |
| D | 0 | 30 | 0 |
| Mode SS | |||
|---|---|---|---|
| Quadrant | BADHDUFLAG | Total packets | Discarded packets |
| A | 0 | 106 | 0 |
| B | 0 | 106 | 0 |
| C | 0 | 106 | 0 |
| D | 0 | 106 | 0 |
| Quadrant | Total seconds | Saturated seconds | Saturation percentage |
|---|---|---|---|
| A | 5174 | 21 | 0.405876% |
| B | 5174 | 33 | 0.637804% |
| C | 5174 | 229 | 4.425976% |
| D | 5174 | 196 | 3.788172% |
Noise dominated data is calculated using 1-second bins in cleaned event files. If a bin has >2000 counts, and if more than 50% of those come from <1% of pixels, then it is considered to be noise-dominated and hence unusable.
| Quadrant | # 1 sec bins | Bins with >0 counts | Bins with >2000 counts | High rate bins dominated by noise | Noise dominated (total time) | Noise dominated (detector-on time) | Marked lightcurve |
|---|---|---|---|---|---|---|---|
| A | 7177 | 5175 | 11 | 11 | 0.15% | 0.21% | 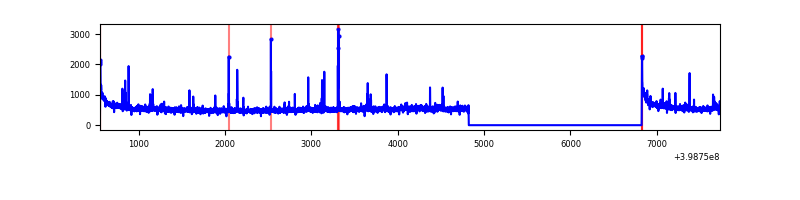 |
| B | 7177 | 5175 | 19 | 19 | 0.26% | 0.37% | 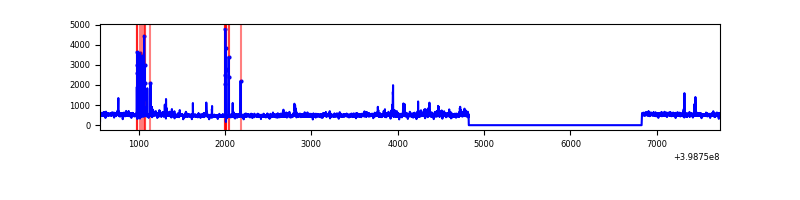 |
| C | 7177 | 5175 | 195 | 195 | 2.72% | 3.77% | 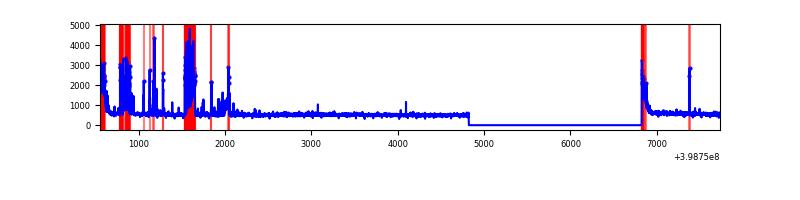 |
| D | 7177 | 5175 | 263 | 263 | 3.66% | 5.08% | 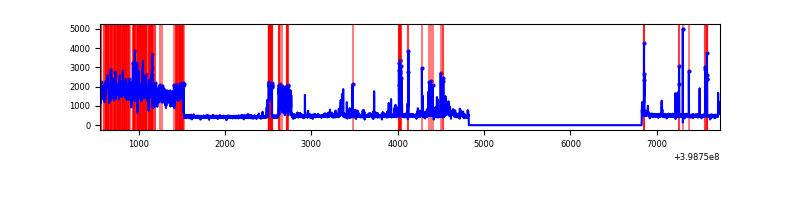 |
Top three noisy pixels from each quadrant. If the there are fewer than three noisy pixels in the level2.evt file, extra rows are filled as -1
| Pixel properties | Quadrant properties | ||||||
|---|---|---|---|---|---|---|---|
| Quadrant | DetID | PixID | Counts | Sigma | Mean | Median | Sigma |
| A | 10 | 83 | 261258 | 2049.49 | 639 | 628 | 127.2 |
| A | 9 | 143 | 80912 | 631.32 | 639 | 628 | 127.2 |
| A | 15 | 223 | 12931 | 96.75 | 639 | 628 | 127.2 |
| B | 5 | 172 | 98824 | 814.45 | 642 | 626 | 120.6 |
| B | 0 | 213 | 38832 | 316.88 | 642 | 626 | 120.6 |
| B | 12 | 111 | 14472 | 114.84 | 642 | 626 | 120.6 |
| C | 1 | 23 | 579355 | 4015.82 | 624 | 630 | 144.1 |
| C | 15 | 214 | 217154 | 1502.47 | 624 | 630 | 144.1 |
| C | 0 | 10 | 176430 | 1219.89 | 624 | 630 | 144.1 |
| D | 1 | 52 | 1361011 | 9050.48 | 622 | 604 | 150.3 |
| D | 13 | 249 | 155391 | 1029.76 | 622 | 604 | 150.3 |
| D | 2 | 249 | 106459 | 704.23 | 622 | 604 | 150.3 |
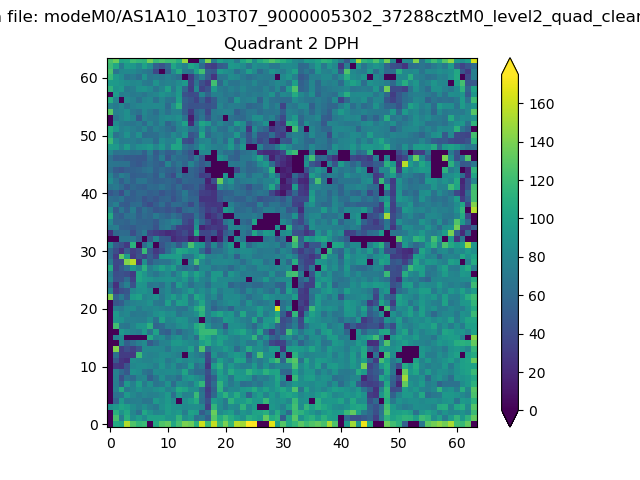
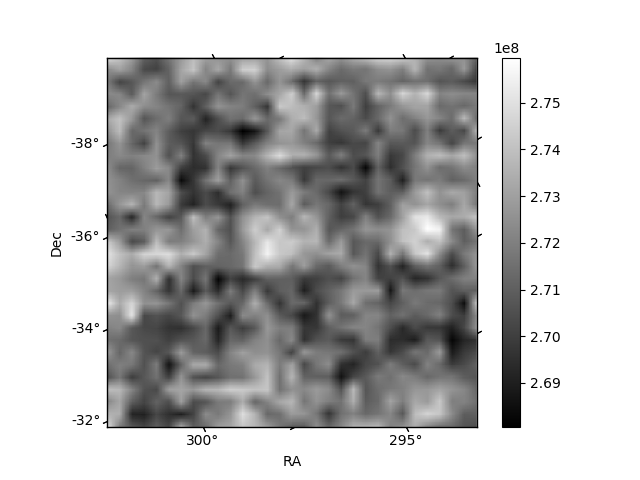
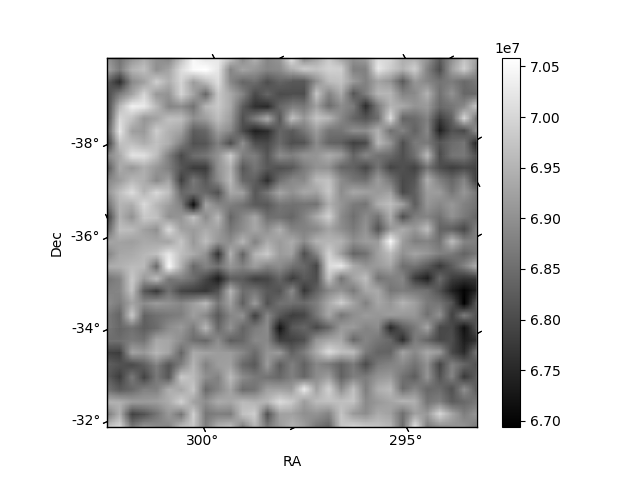
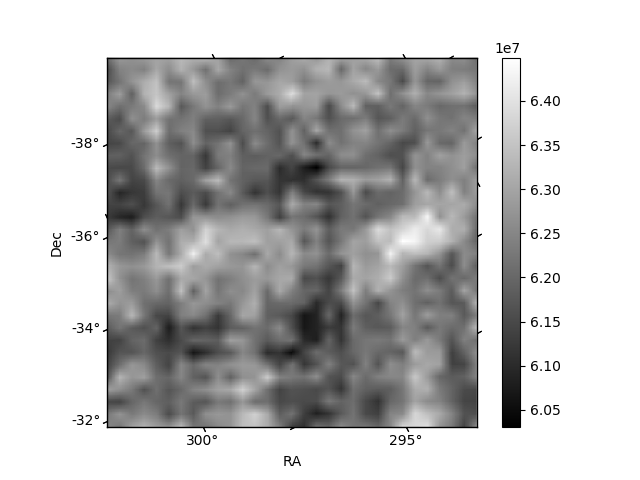
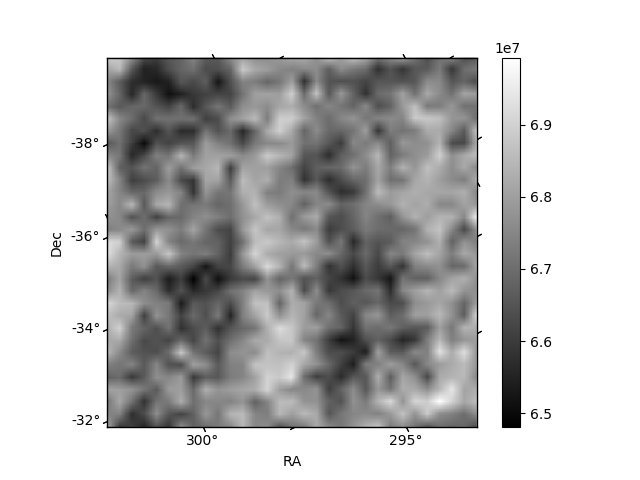
Histogram calculated using DETX and DETY for each event in the final _common_clean file
| Quadrant A | 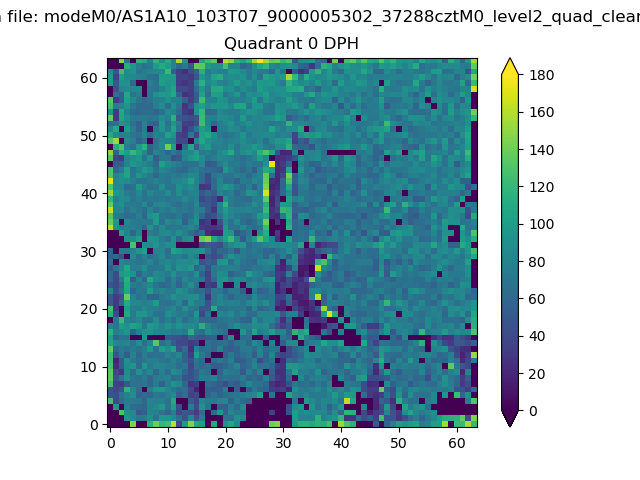 |
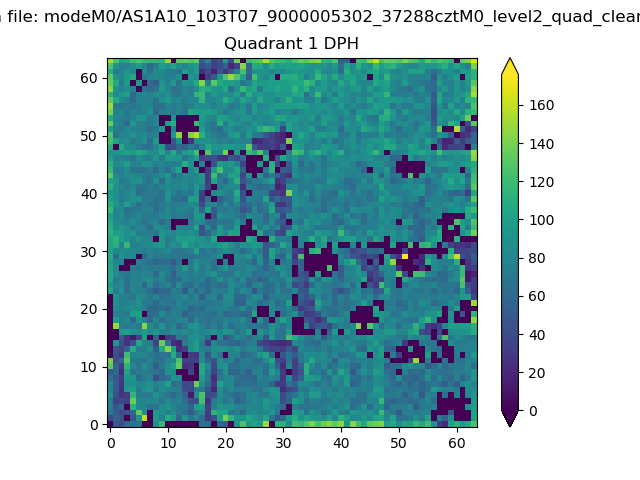 |
Quadrant B |
|---|---|---|---|
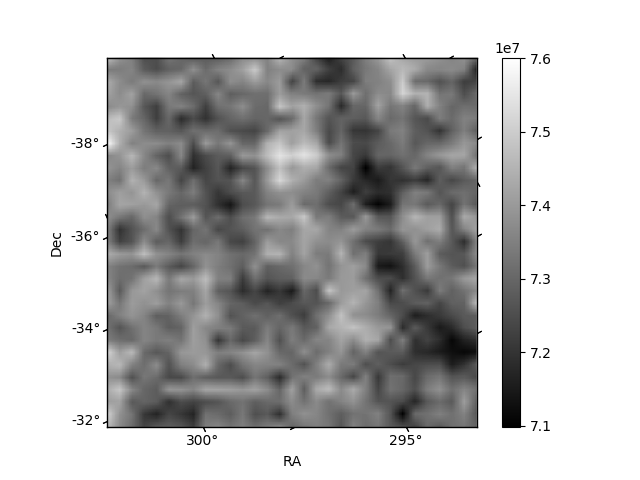
| Quadrant D | 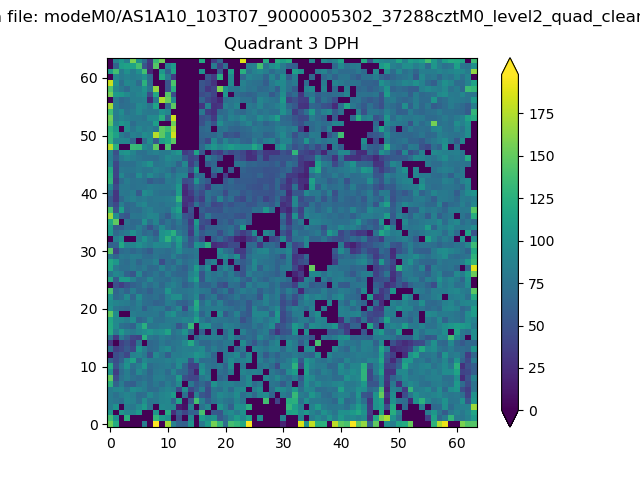 |
 |
Quadrant C |
| Plot type | Count rate plots | Images |
|---|---|---|
| Comparison with Poisson distribution Blue bars denote a histogram of data divided into 1 sec bins. Red curve is a Poisson curve with rate = median count rate of data. |
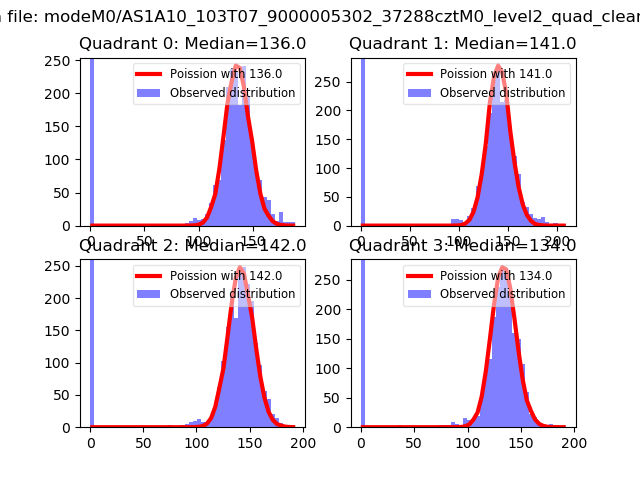 |
 |
| Quadrant-wise count rates Data is divided into 100 sec bins |
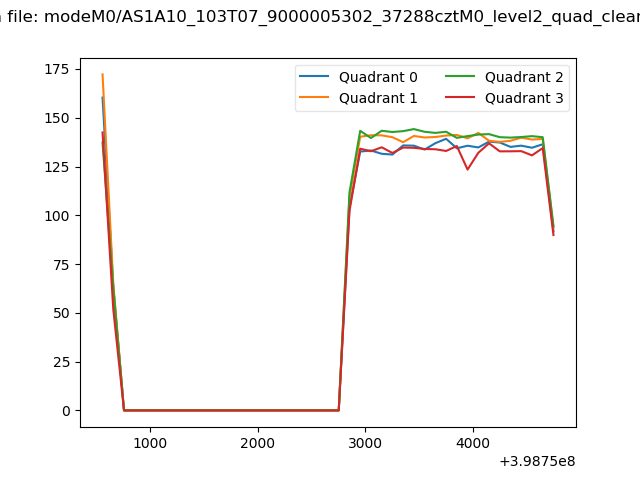 |
|
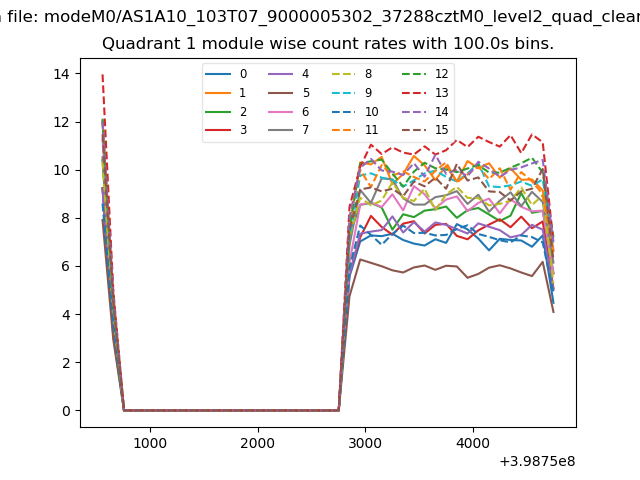
| Module-wise count rates for Quadrant A Data is divided into 100 sec bins |
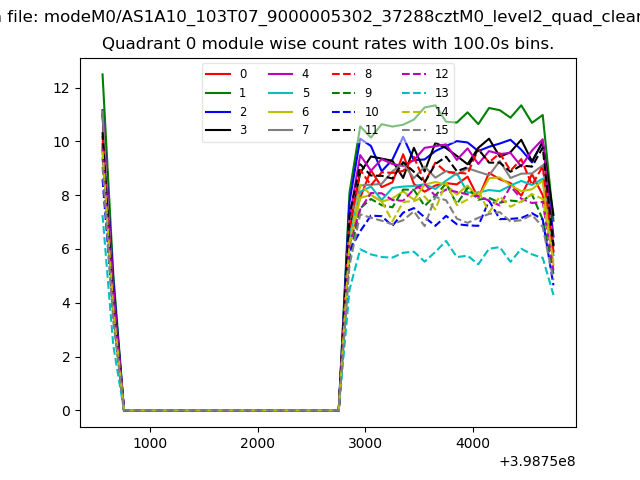 |
 |
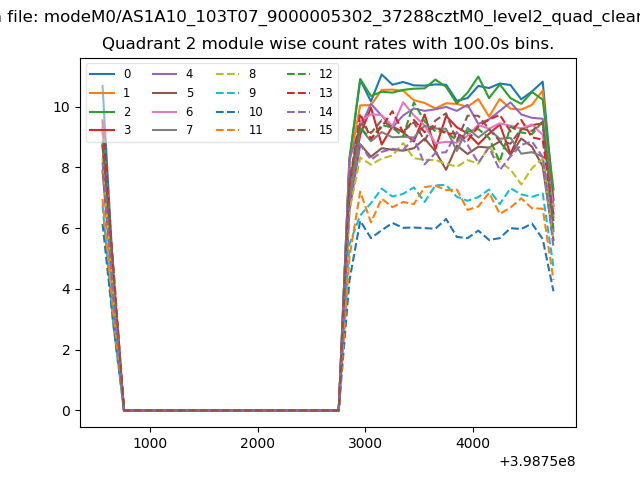
| Module-wise count rates for Quadrant B Data is divided into 100 sec bins |
 |
 |
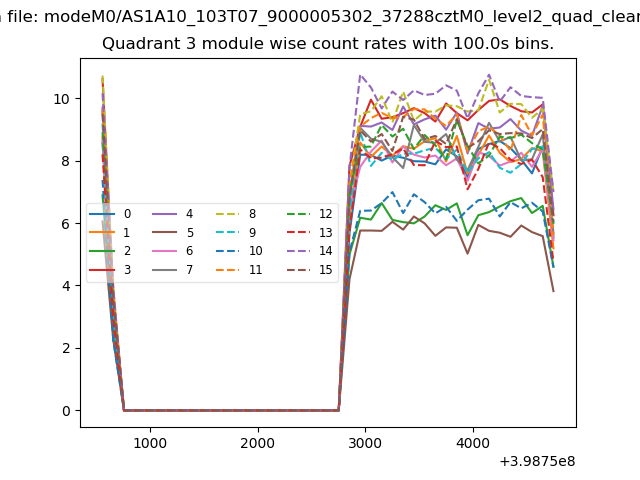
| Module-wise count rates for Quadrant C Data is divided into 100 sec bins |
 |
 |
| Module-wise count rates for Quadrant D Data is divided into 100 sec bins |
 |
 |
| Parameter | Plot |
|---|---|
| CZT HV Monitor | 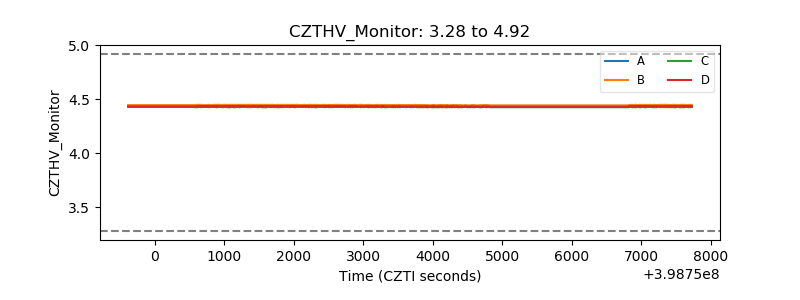 |
| D_VDD |  |
| Temperature 1 | 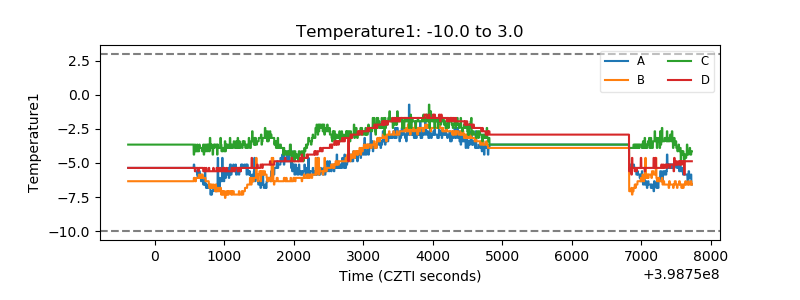 |
| Veto HV Monitor | 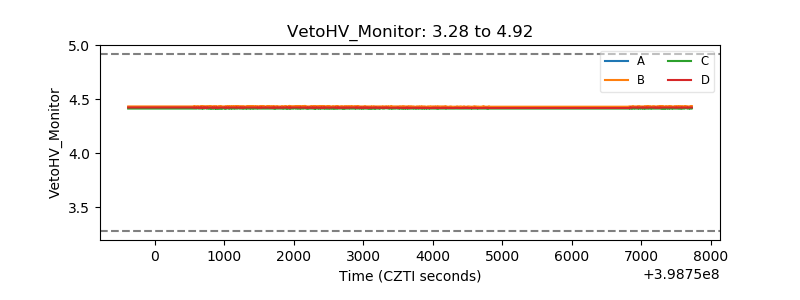 |
| Veto LLD | 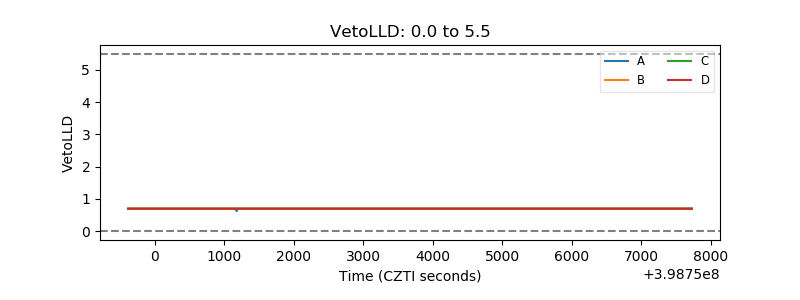 |
| Alpha Counter | 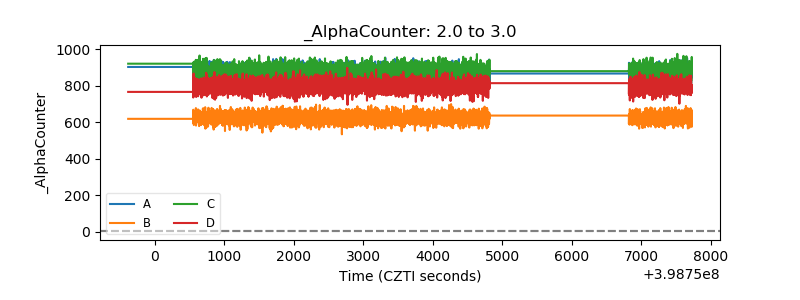 |
| _CPM_Rate | 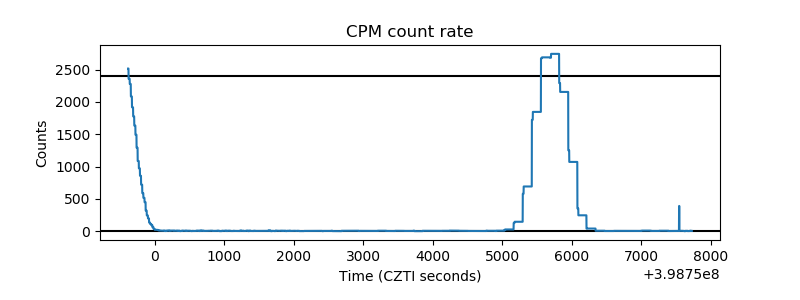 |
| CZT Counter | 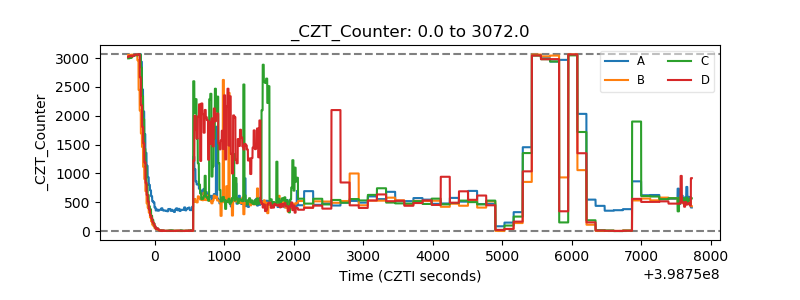 |
| +2.5 Volts monitor | 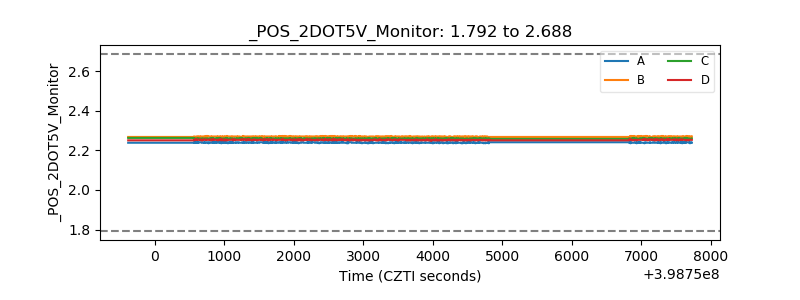 |
| +5 Volts monitor | 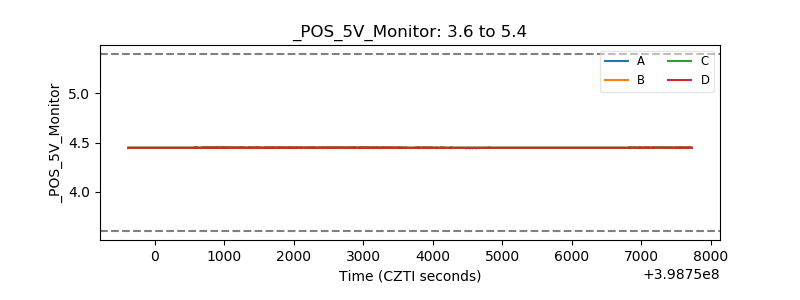 |
| _ROLL_ROT | 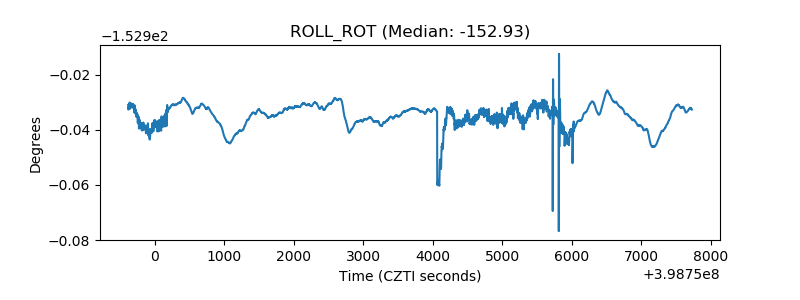 |
| _Roll_DEC | 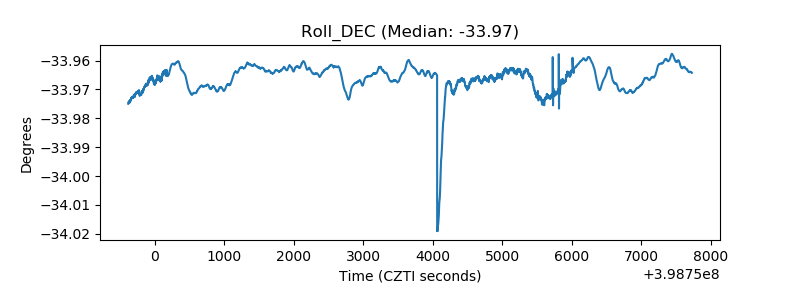 |
| _Roll_RA | 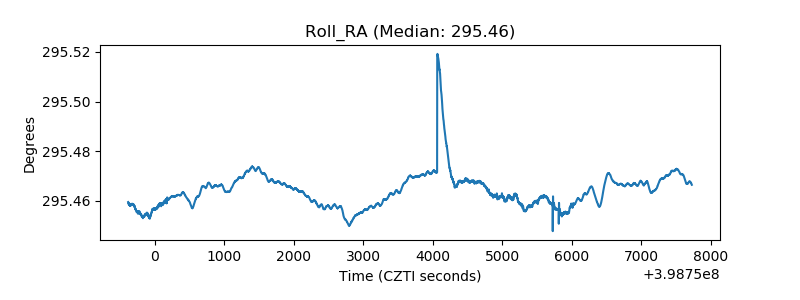 |
| Veto Counter | 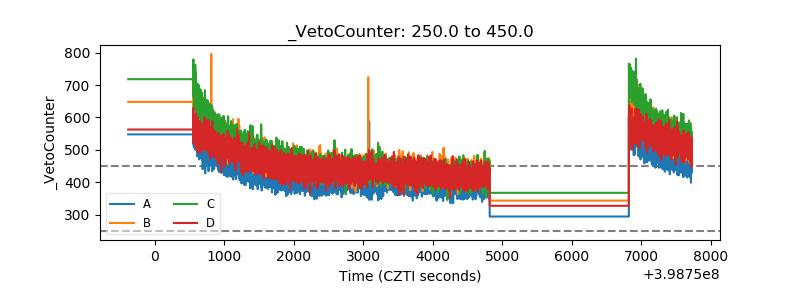 |