| Param | Original file | Final file |
|---|---|---|
| Filename | modeM0/AS1A10_103T07_9000005302_37291cztM0_level2.evt | modeM0/AS1A10_103T07_9000005302_37291cztM0_level2_quad_clean.evt |
| Size (bytes) | 360,475,200 | 64,785,600 |
| Size | 343.8 MB | 61.8 MB |
| Events in quadrant A | 2,550,915 | 407,673 |
| Events in quadrant B | 2,475,730 | 417,540 |
| Events in quadrant C | 3,141,759 | 404,172 |
| Events in quadrant D | 2,425,900 | 399,389 |
| Mode M0 | |||
|---|---|---|---|
| Quadrant | BADHDUFLAG | Total packets | Discarded packets |
| A | 0 | 11087 | 693 |
| B | 0 | 10982 | 771 |
| C | 0 | 13333 | 1324 |
| D | 0 | 11154 | 934 |
| Mode M9 | |||
|---|---|---|---|
| Quadrant | BADHDUFLAG | Total packets | Discarded packets |
| A | 0 | 40 | 2 |
| B | 0 | 41 | 3 |
| C | 0 | 40 | 2 |
| D | 0 | 40 | 2 |
| Mode SS | |||
|---|---|---|---|
| Quadrant | BADHDUFLAG | Total packets | Discarded packets |
| A | 0 | 105 | 5 |
| B | 0 | 105 | 9 |
| C | 0 | 106 | 6 |
| D | 0 | 105 | 9 |
| Quadrant | Total seconds | Saturated seconds | Saturation percentage |
|---|---|---|---|
| A | 4764 | 26 | 0.545760% |
| B | 4744 | 19 | 0.400506% |
| C | 4682 | 225 | 4.805639% |
| D | 4744 | 12 | 0.252951% |
Noise dominated data is calculated using 1-second bins in cleaned event files. If a bin has >2000 counts, and if more than 50% of those come from <1% of pixels, then it is considered to be noise-dominated and hence unusable.
| Quadrant | # 1 sec bins | Bins with >0 counts | Bins with >2000 counts | High rate bins dominated by noise | Noise dominated (total time) | Noise dominated (detector-on time) | Marked lightcurve |
|---|---|---|---|---|---|---|---|
| A | 9762 | 4868 | 7 | 7 | 0.07% | 0.14% | 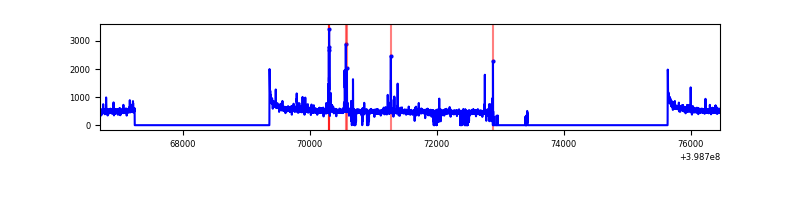 |
| B | 9762 | 4856 | 10 | 10 | 0.10% | 0.21% | 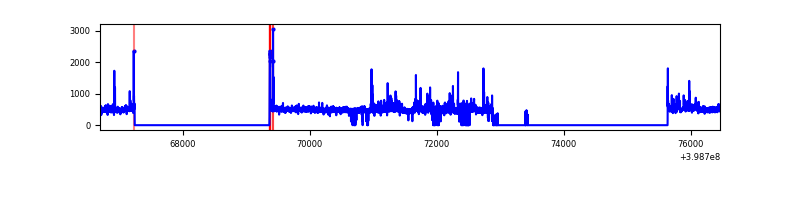 |
| C | 9762 | 4800 | 221 | 221 | 2.26% | 4.60% | 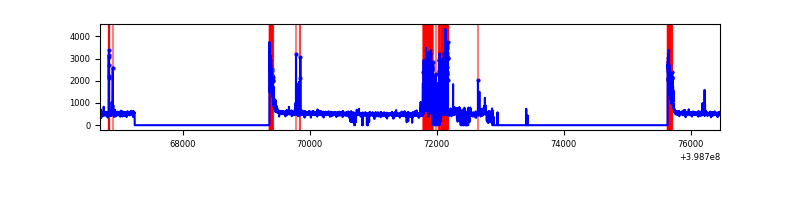 |
| D | 9762 | 4857 | 7 | 7 | 0.07% | 0.14% | 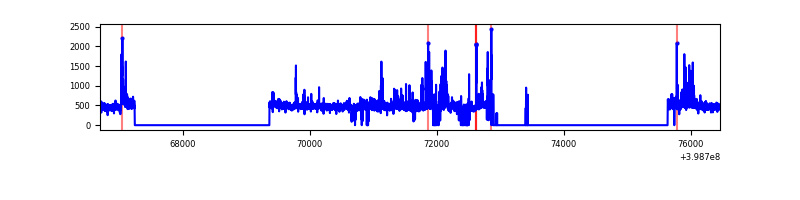 |
Top three noisy pixels from each quadrant. If the there are fewer than three noisy pixels in the level2.evt file, extra rows are filled as -1
| Pixel properties | Quadrant properties | ||||||
|---|---|---|---|---|---|---|---|
| Quadrant | DetID | PixID | Counts | Sigma | Mean | Median | Sigma |
| A | 10 | 83 | 248376 | 2191.3 | 566 | 556 | 113.1 |
| A | 9 | 143 | 74450 | 653.39 | 566 | 556 | 113.1 |
| A | 13 | 248 | 10530 | 88.19 | 566 | 556 | 113.1 |
| B | 0 | 213 | 120493 | 1112.7 | 561 | 547 | 107.8 |
| B | 5 | 172 | 93841 | 865.46 | 561 | 547 | 107.8 |
| B | 0 | 221 | 40103 | 366.95 | 561 | 547 | 107.8 |
| C | 1 | 23 | 549625 | 4384.05 | 536 | 540 | 125.2 |
| C | 0 | 10 | 266873 | 2126.48 | 536 | 540 | 125.2 |
| C | 15 | 214 | 198763 | 1582.67 | 536 | 540 | 125.2 |
| D | 2 | 249 | 128472 | 953.68 | 552 | 538 | 134.1 |
| D | 13 | 249 | 71911 | 532.05 | 552 | 538 | 134.1 |
| D | 2 | 250 | 47556 | 350.49 | 552 | 538 | 134.1 |
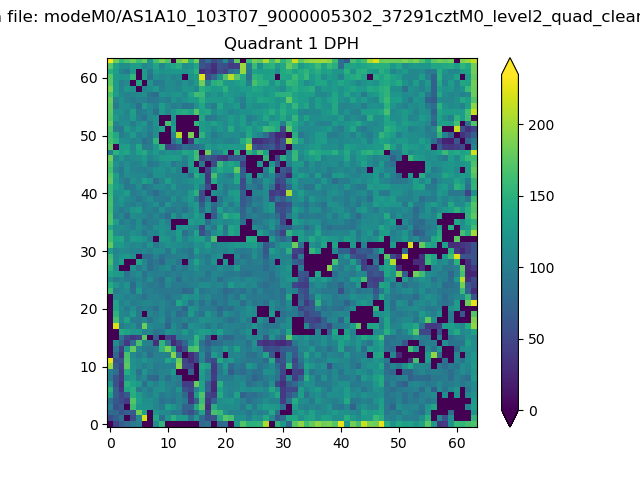
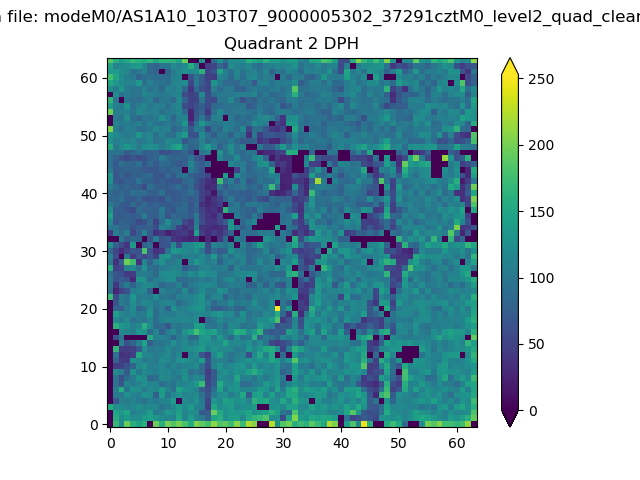
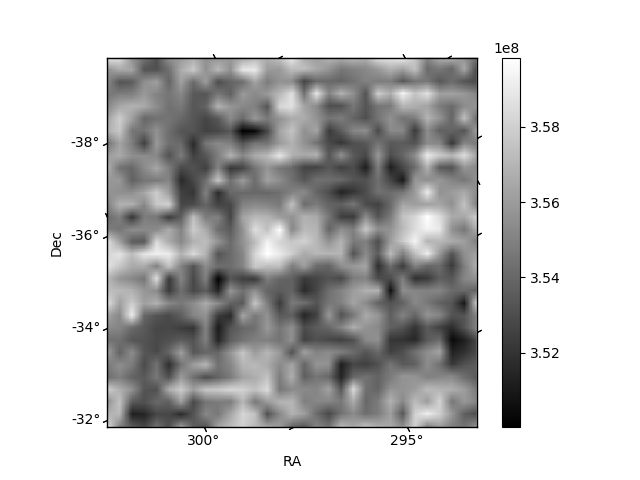
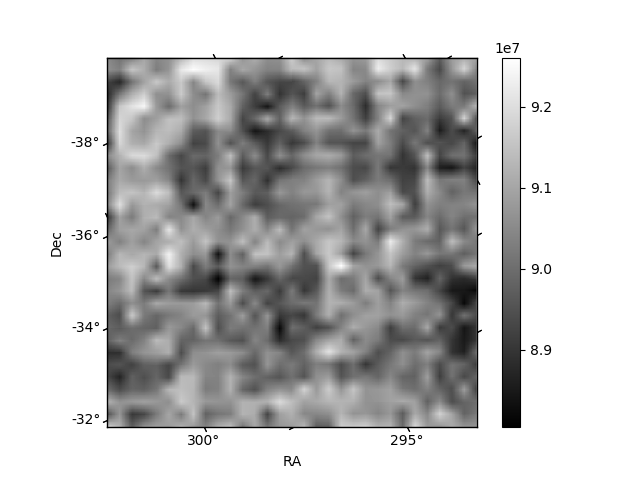
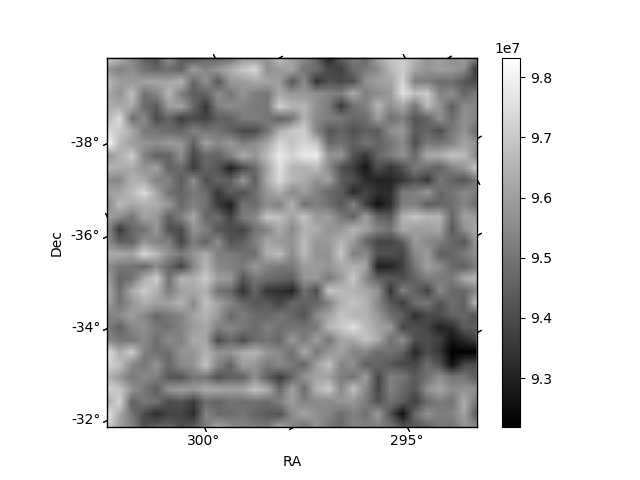
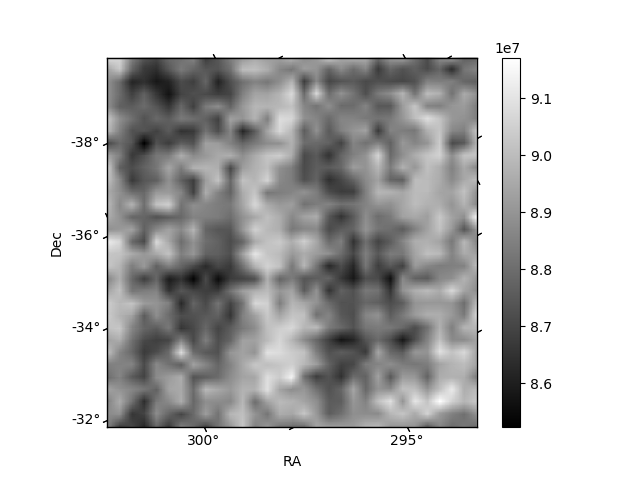
Histogram calculated using DETX and DETY for each event in the final _common_clean file
| Quadrant A |  |
 |
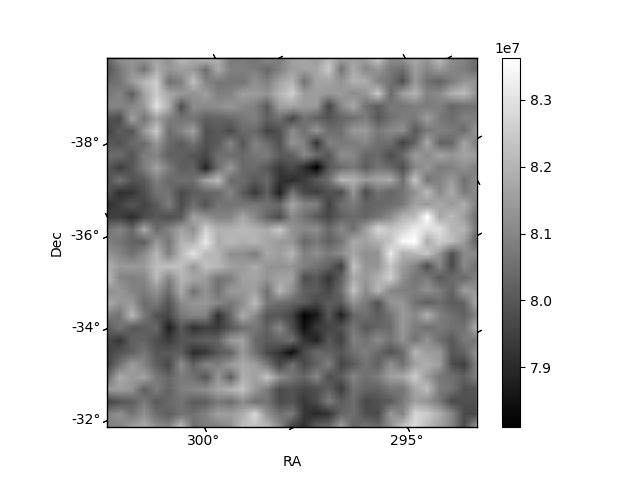
Quadrant B |
|---|---|---|---|
| Quadrant D | 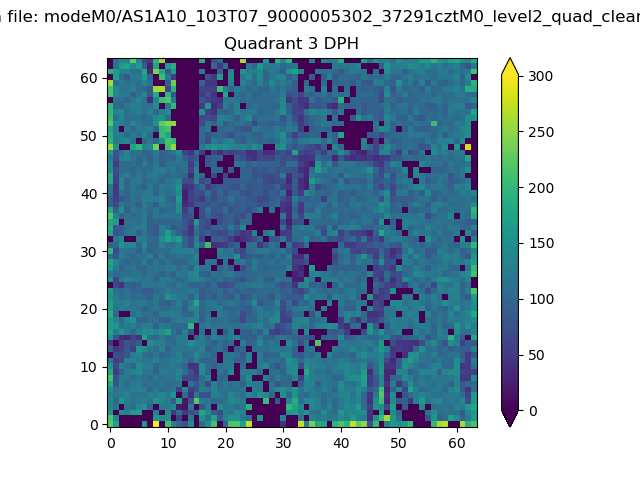 |
 |
Quadrant C |
| Plot type | Count rate plots | Images |
|---|---|---|
| Comparison with Poisson distribution Blue bars denote a histogram of data divided into 1 sec bins. Red curve is a Poisson curve with rate = median count rate of data. |
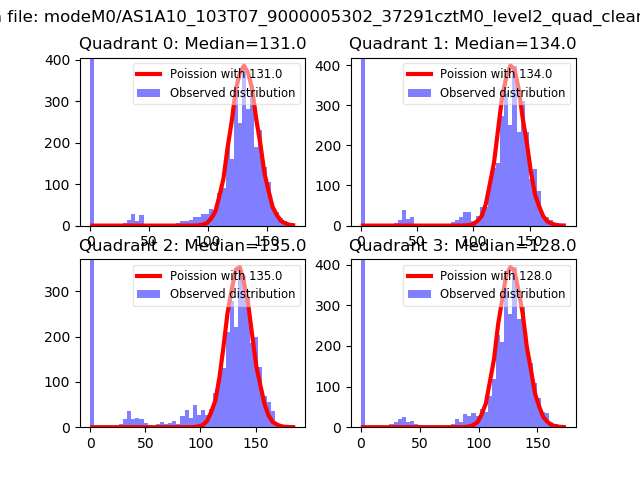 |
 |
| Quadrant-wise count rates Data is divided into 100 sec bins |
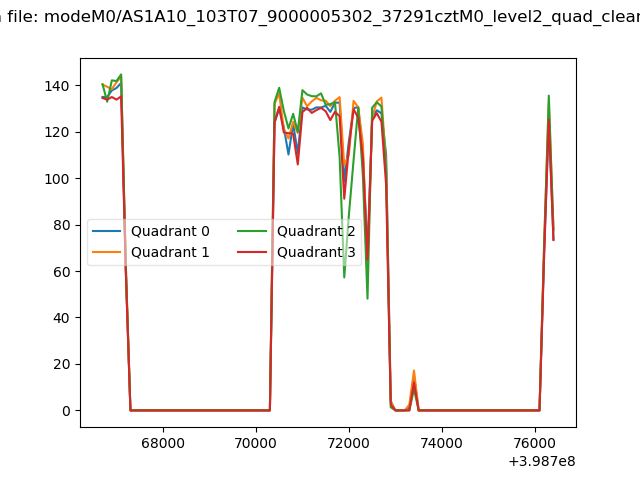 |
|
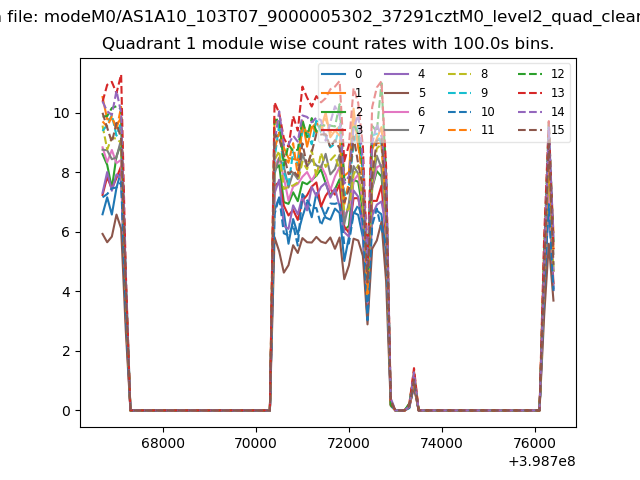
| Module-wise count rates for Quadrant A Data is divided into 100 sec bins |
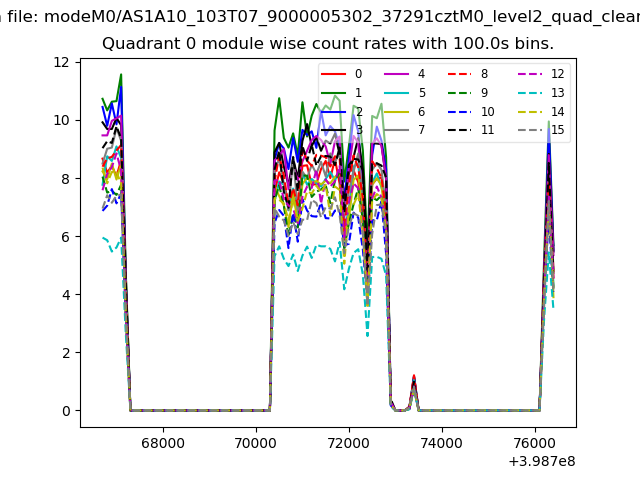 |
 |
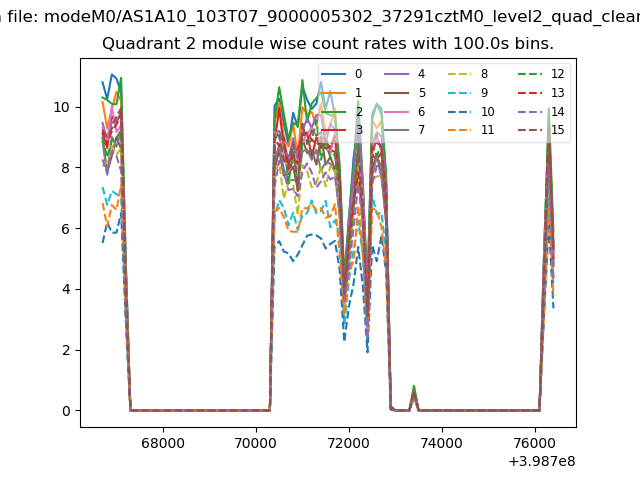
| Module-wise count rates for Quadrant B Data is divided into 100 sec bins |
 |
 |
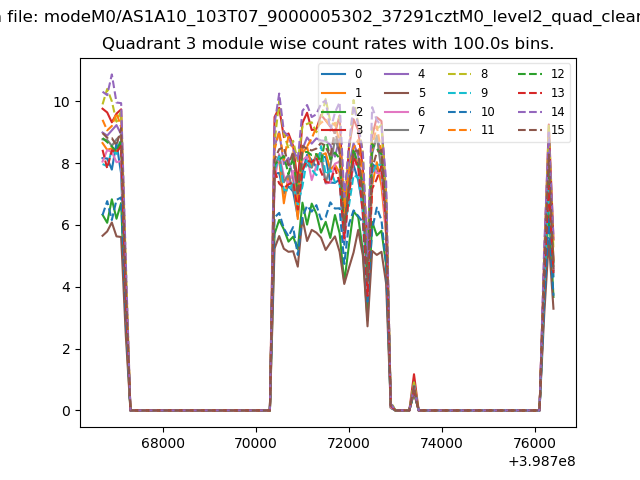
| Module-wise count rates for Quadrant C Data is divided into 100 sec bins |
 |
 |
| Module-wise count rates for Quadrant D Data is divided into 100 sec bins |
 |
 |
| Parameter | Plot |
|---|---|
| CZT HV Monitor | 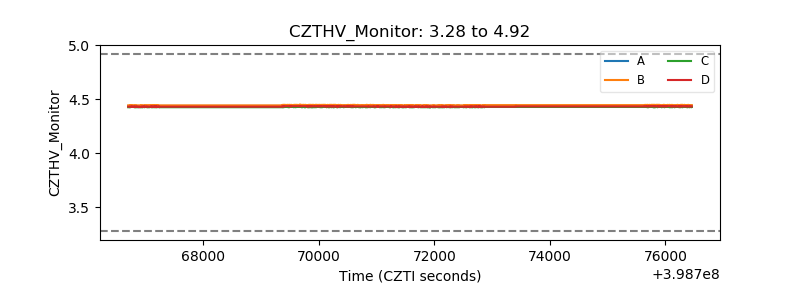 |
| D_VDD | 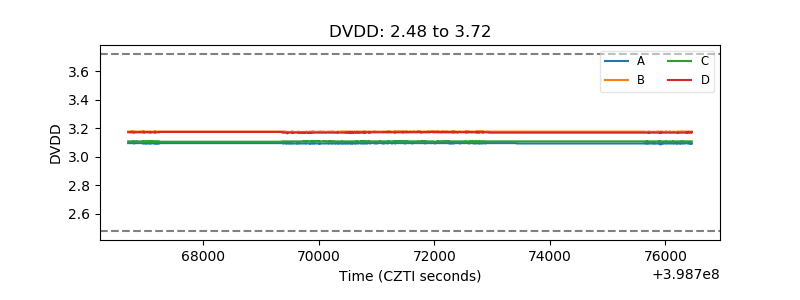 |
| Temperature 1 | 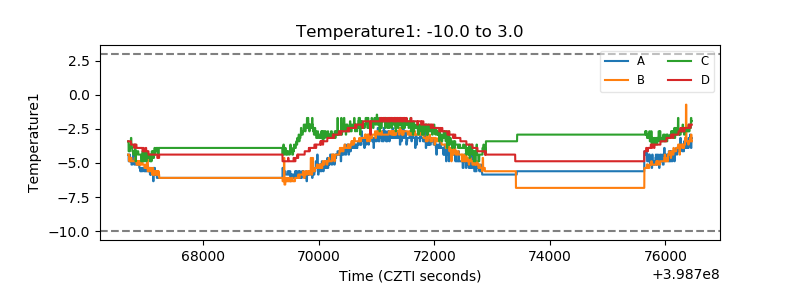 |
| Veto HV Monitor | 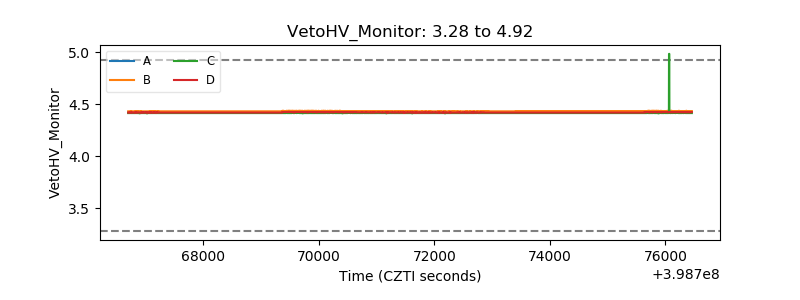 |
| Veto LLD | 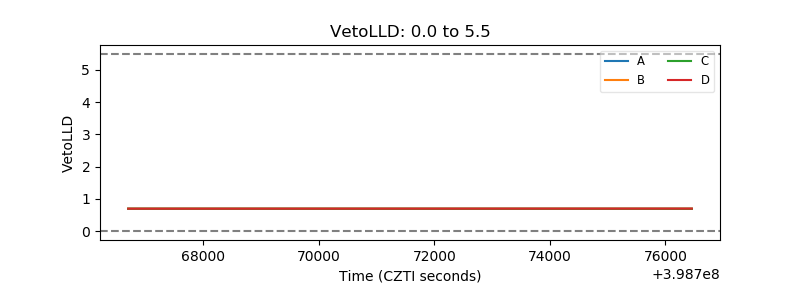 |
| Alpha Counter | 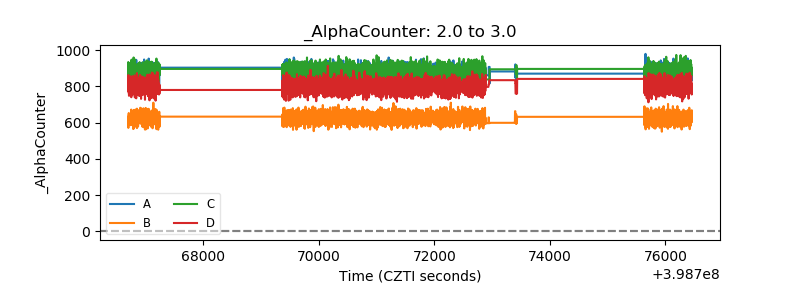 |
| _CPM_Rate | 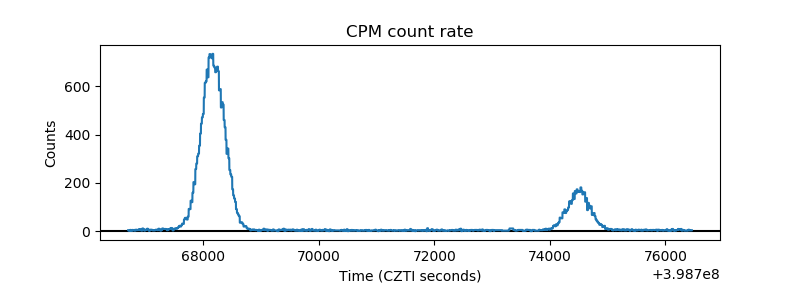 |
| CZT Counter | 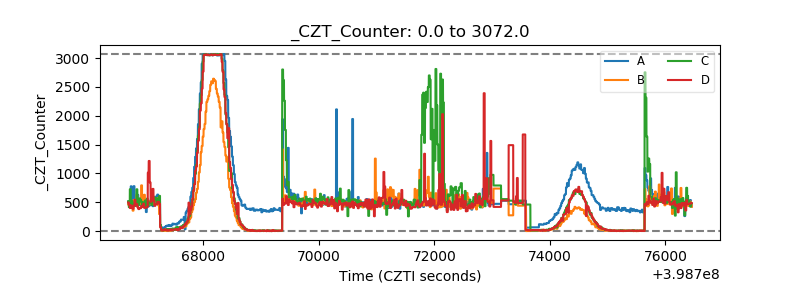 |
| +2.5 Volts monitor | 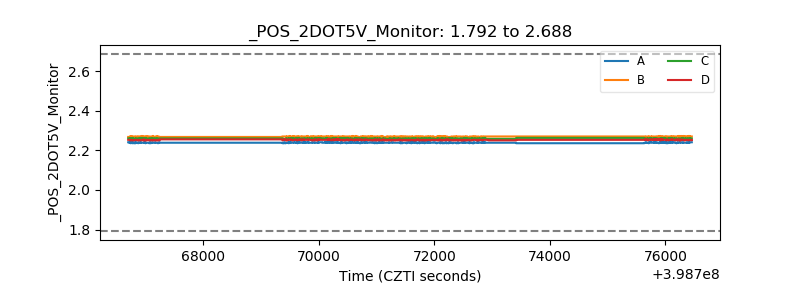 |
| +5 Volts monitor | 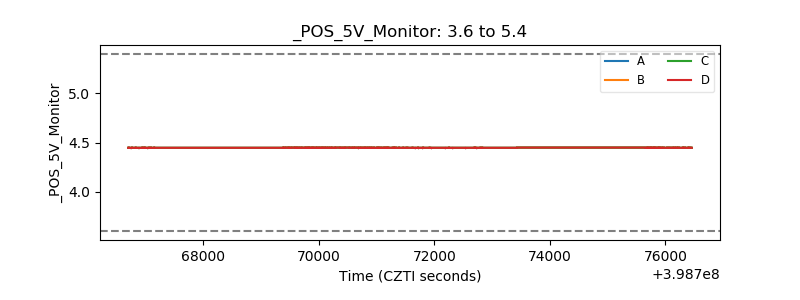 |
| _ROLL_ROT | 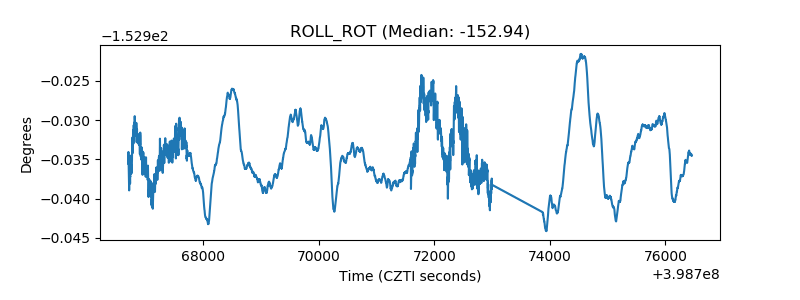 |
| _Roll_DEC | 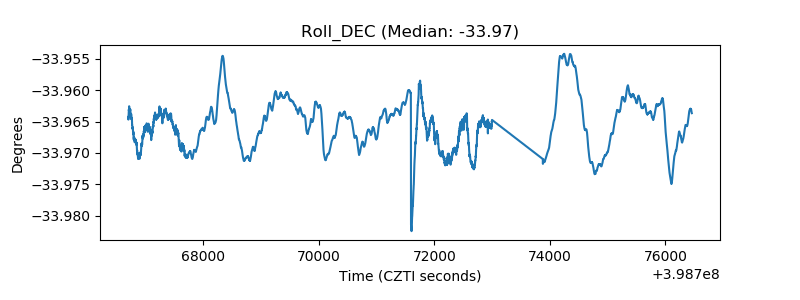 |
| _Roll_RA | 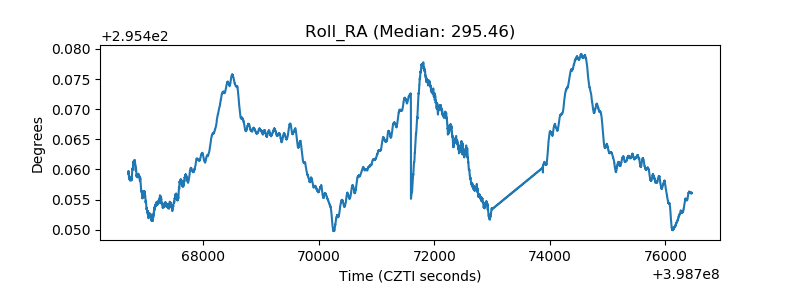 |
| Veto Counter | 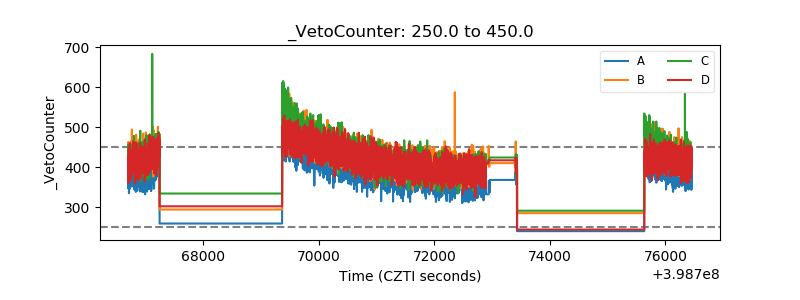 |