| Param | Original file | Final file |
|---|---|---|
| Filename | modeM0/AS1A10_103T07_9000005302_37292cztM0_level2.evt | modeM0/AS1A10_103T07_9000005302_37292cztM0_level2_quad_clean.evt |
| Size (bytes) | 383,031,360 | 83,969,280 |
| Size | 365.3 MB | 80.1 MB |
| Events in quadrant A | 2,677,102 | 540,509 |
| Events in quadrant B | 2,657,110 | 550,693 |
| Events in quadrant C | 2,877,884 | 556,806 |
| Events in quadrant D | 3,027,828 | 524,029 |
| Mode M0 | |||
|---|---|---|---|
| Quadrant | BADHDUFLAG | Total packets | Discarded packets |
| A | 0 | 11280 | 3 |
| B | 0 | 11266 | 2 |
| C | 0 | 11764 | 2 |
| D | 0 | 12620 | 2 |
| Mode M9 | |||
|---|---|---|---|
| Quadrant | BADHDUFLAG | Total packets | Discarded packets |
| A | 0 | 33 | 0 |
| B | 0 | 33 | 0 |
| C | 0 | 33 | 0 |
| D | 0 | 34 | 0 |
| Mode SS | |||
|---|---|---|---|
| Quadrant | BADHDUFLAG | Total packets | Discarded packets |
| A | 0 | 108 | 0 |
| B | 0 | 108 | 0 |
| C | 0 | 108 | 0 |
| D | 0 | 108 | 0 |
| Quadrant | Total seconds | Saturated seconds | Saturation percentage |
|---|---|---|---|
| A | 5294 | 10 | 0.188893% |
| B | 5294 | 34 | 0.642236% |
| C | 5294 | 81 | 1.530034% |
| D | 5294 | 104 | 1.964488% |
Noise dominated data is calculated using 1-second bins in cleaned event files. If a bin has >2000 counts, and if more than 50% of those come from <1% of pixels, then it is considered to be noise-dominated and hence unusable.
| Quadrant | # 1 sec bins | Bins with >0 counts | Bins with >2000 counts | High rate bins dominated by noise | Noise dominated (total time) | Noise dominated (detector-on time) | Marked lightcurve |
|---|---|---|---|---|---|---|---|
| A | 7116 | 5295 | 2 | 2 | 0.03% | 0.04% | 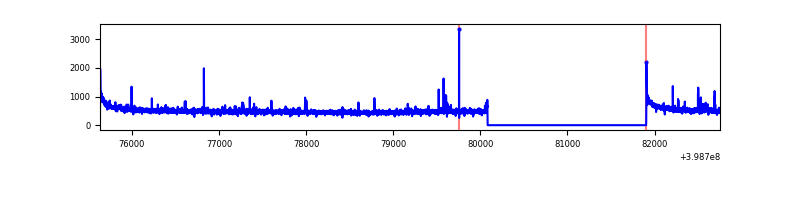 |
| B | 7116 | 5295 | 10 | 10 | 0.14% | 0.19% | 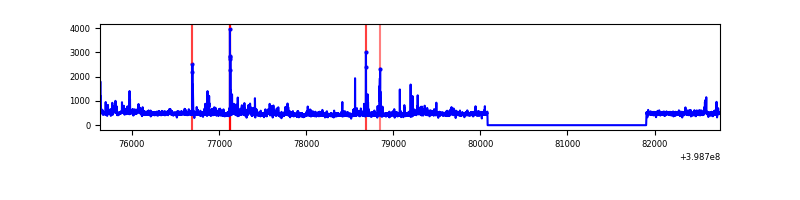 |
| C | 7116 | 5295 | 64 | 64 | 0.90% | 1.21% | 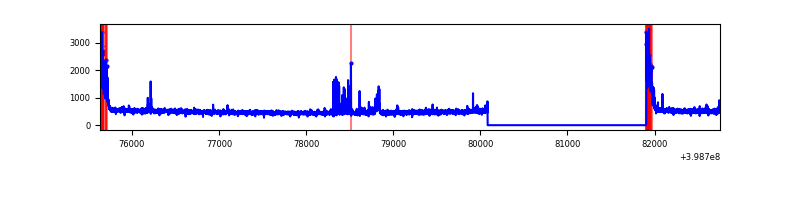 |
| D | 7116 | 5295 | 83 | 83 | 1.17% | 1.57% | 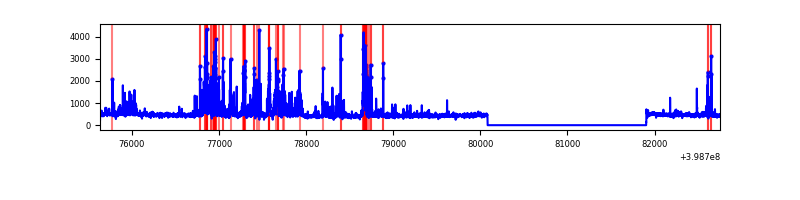 |
Top three noisy pixels from each quadrant. If the there are fewer than three noisy pixels in the level2.evt file, extra rows are filled as -1
| Pixel properties | Quadrant properties | ||||||
|---|---|---|---|---|---|---|---|
| Quadrant | DetID | PixID | Counts | Sigma | Mean | Median | Sigma |
| A | 10 | 83 | 263157 | 2166.31 | 603 | 594 | 121.2 |
| A | 9 | 143 | 36624 | 297.27 | 603 | 594 | 121.2 |
| A | 13 | 248 | 11839 | 92.78 | 603 | 594 | 121.2 |
| B | 0 | 213 | 123810 | 1061.33 | 599 | 583 | 116.1 |
| B | 5 | 172 | 62786 | 535.74 | 599 | 583 | 116.1 |
| B | 0 | 221 | 55597 | 473.83 | 599 | 583 | 116.1 |
| C | 0 | 10 | 261857 | 1902.11 | 586 | 593 | 137.4 |
| C | 15 | 214 | 223229 | 1620.88 | 586 | 593 | 137.4 |
| C | 1 | 23 | 92467 | 668.88 | 586 | 593 | 137.4 |
| D | 2 | 249 | 474033 | 3349.72 | 586 | 571 | 141.3 |
| D | 10 | 199 | 95343 | 670.5 | 586 | 571 | 141.3 |
| D | 13 | 249 | 79737 | 560.09 | 586 | 571 | 141.3 |
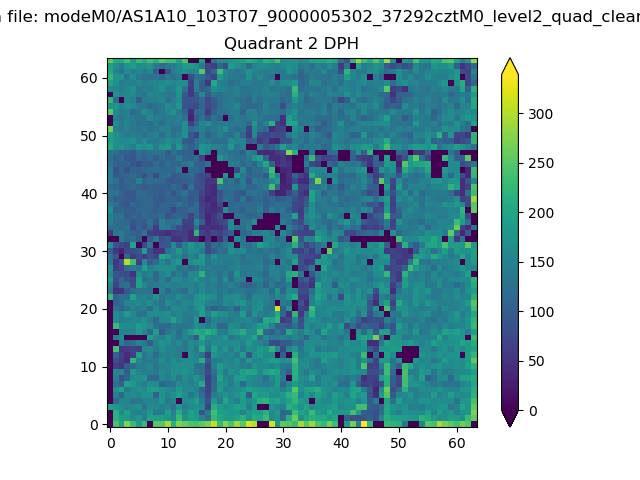
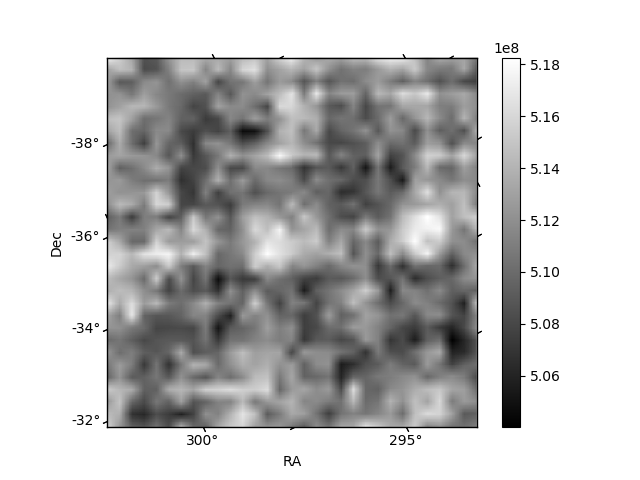
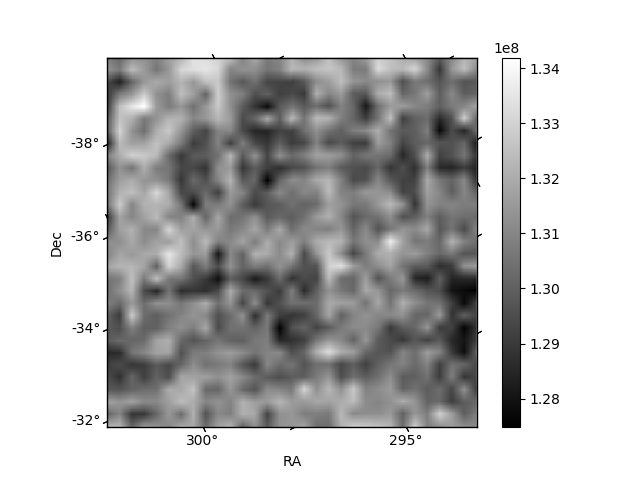
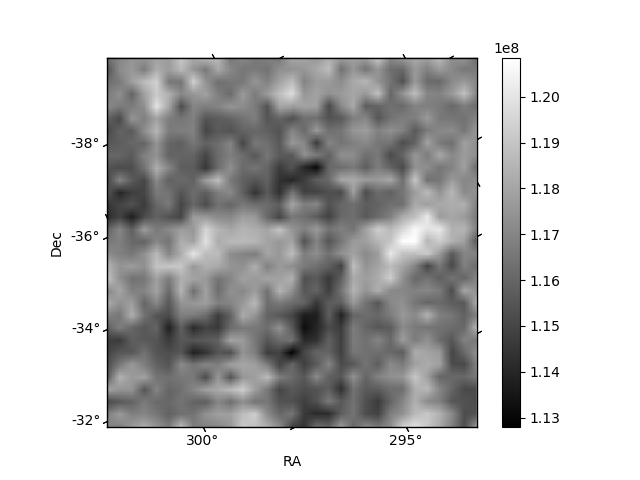
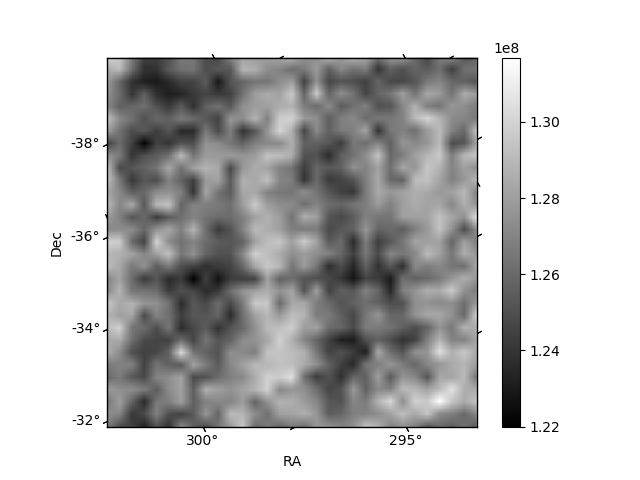
Histogram calculated using DETX and DETY for each event in the final _common_clean file
| Quadrant A | 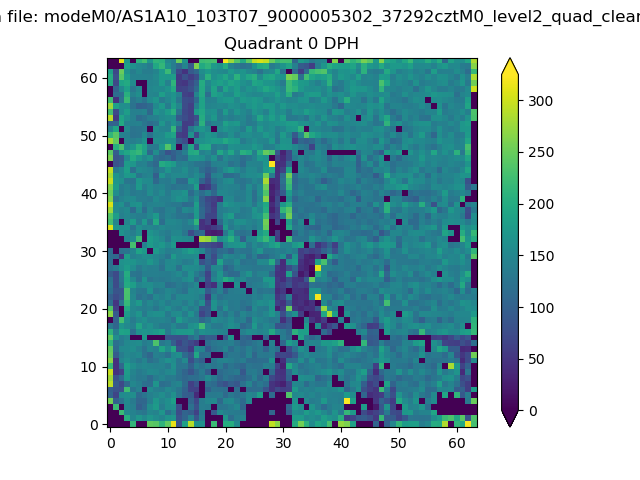 |
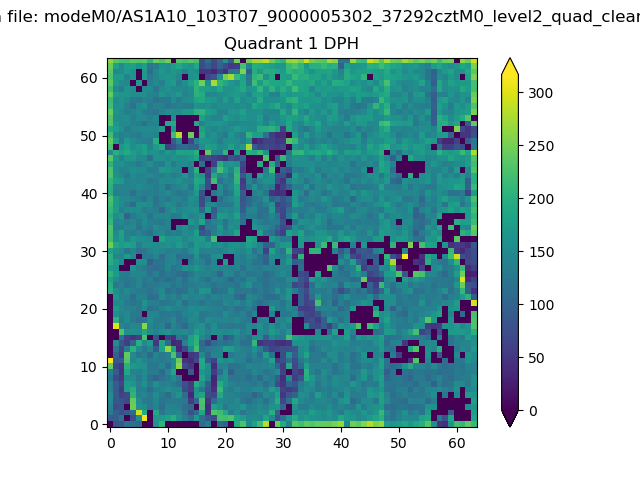 |
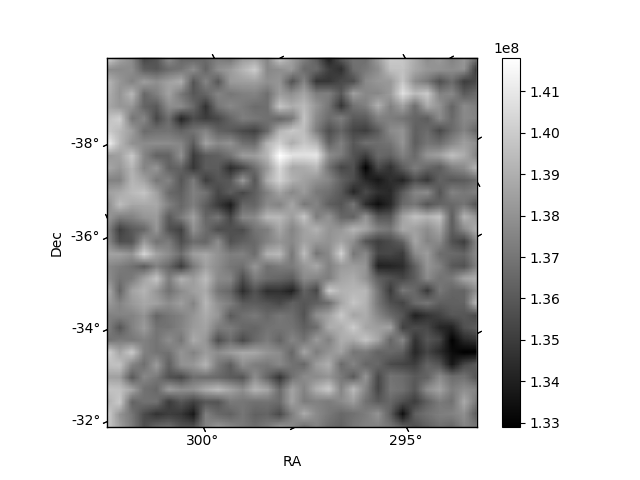
Quadrant B |
|---|---|---|---|
| Quadrant D | 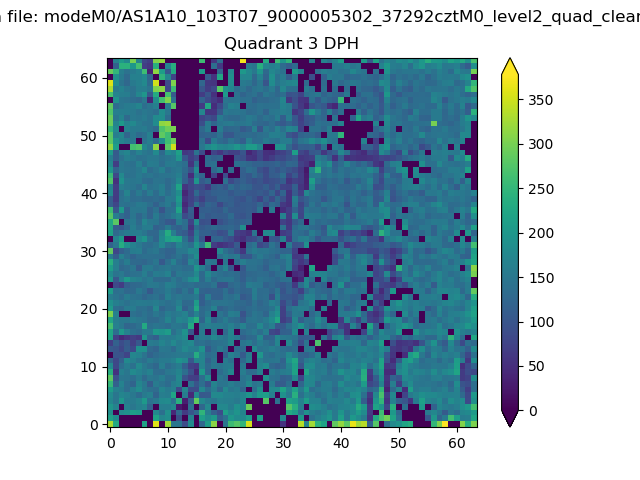 |
 |
Quadrant C |
| Plot type | Count rate plots | Images |
|---|---|---|
| Comparison with Poisson distribution Blue bars denote a histogram of data divided into 1 sec bins. Red curve is a Poisson curve with rate = median count rate of data. |
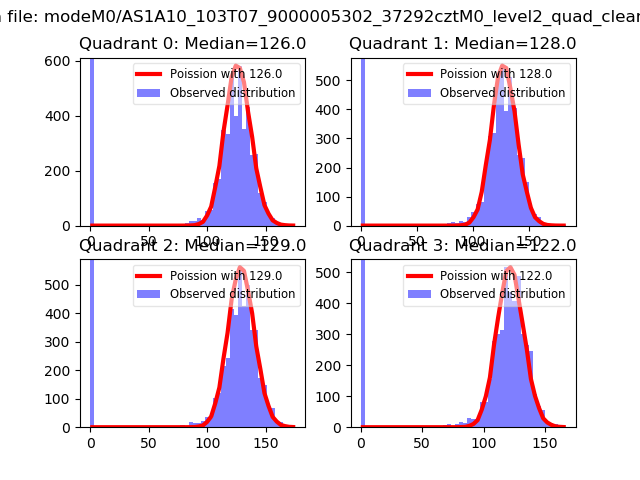 |
 |
| Quadrant-wise count rates Data is divided into 100 sec bins |
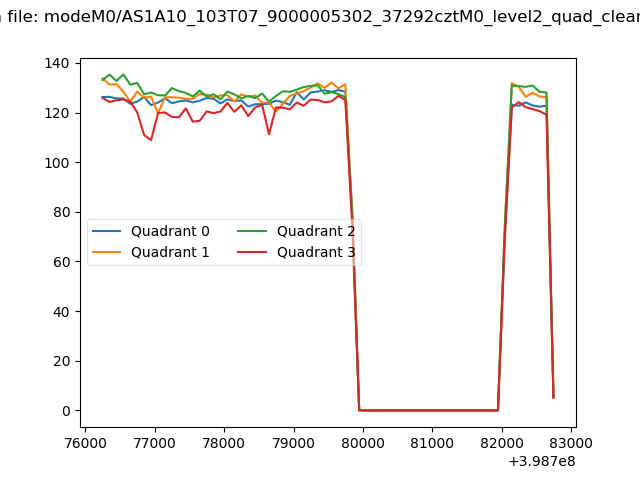 |
|
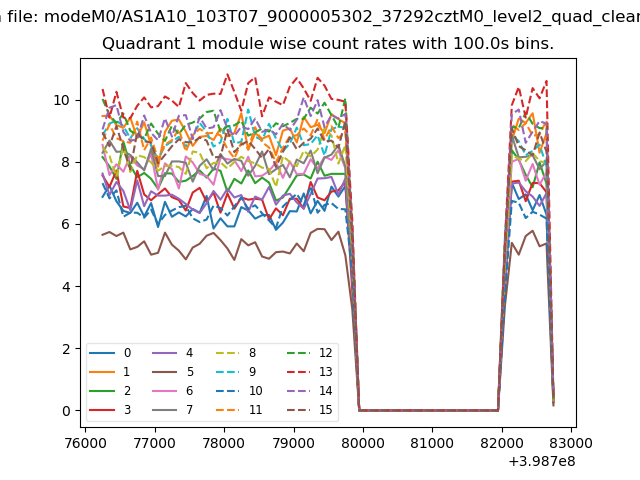
| Module-wise count rates for Quadrant A Data is divided into 100 sec bins |
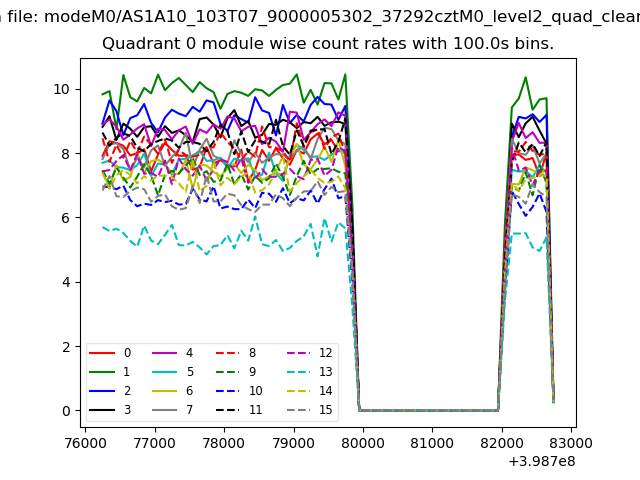 |
 |
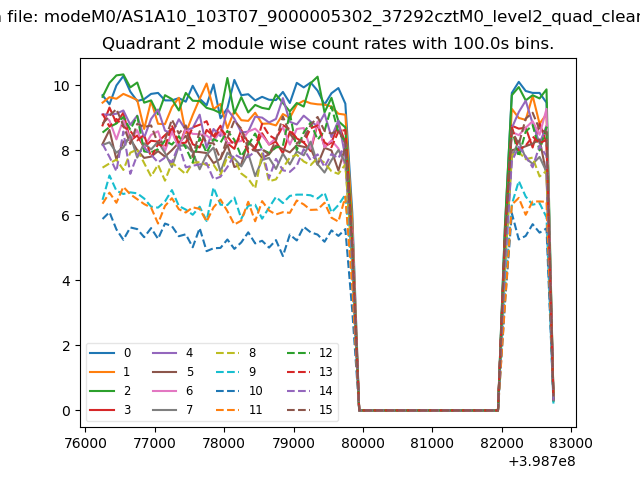
| Module-wise count rates for Quadrant B Data is divided into 100 sec bins |
 |
 |
| Module-wise count rates for Quadrant C Data is divided into 100 sec bins |
 |
 |
| Module-wise count rates for Quadrant D Data is divided into 100 sec bins |
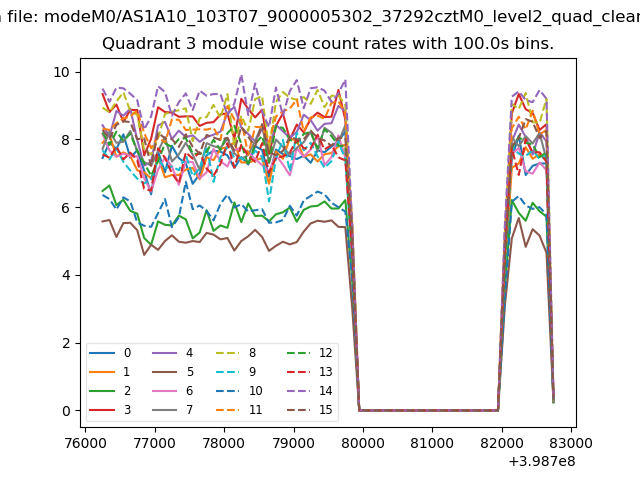 |
 |
| Parameter | Plot |
|---|---|
| CZT HV Monitor | 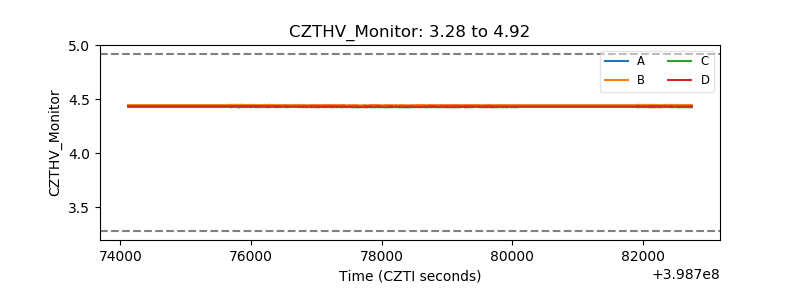 |
| D_VDD | 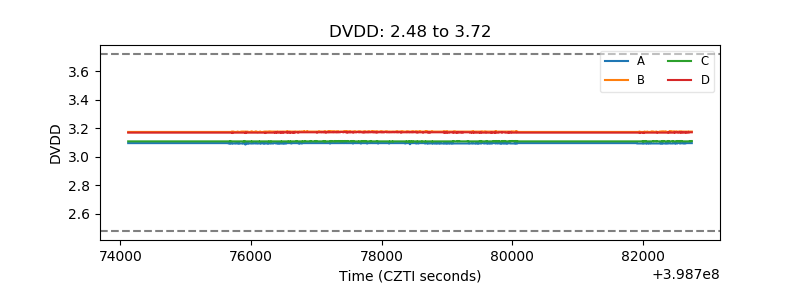 |
| Temperature 1 | 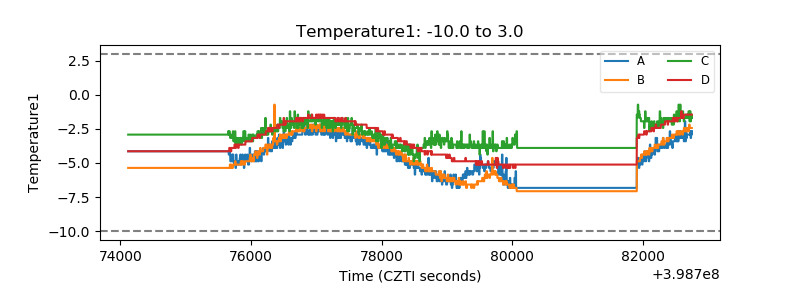 |
| Veto HV Monitor | 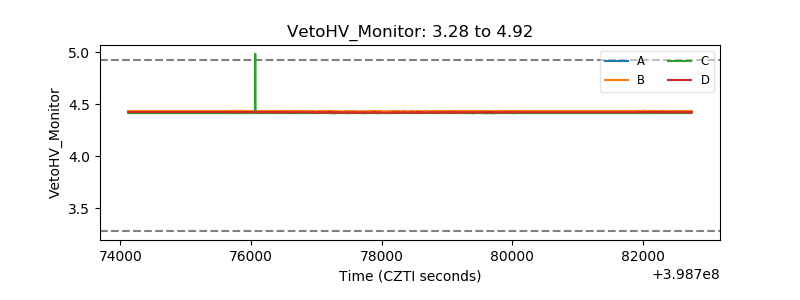 |
| Veto LLD | 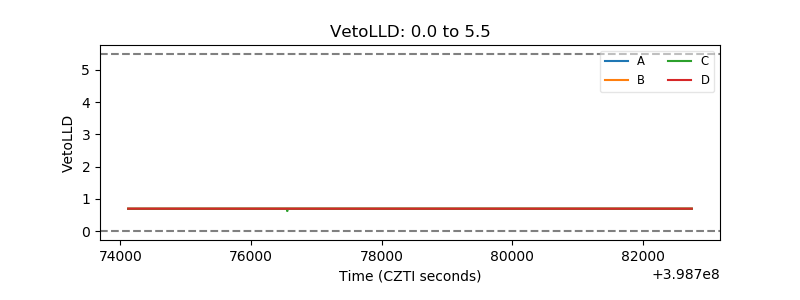 |
| Alpha Counter | 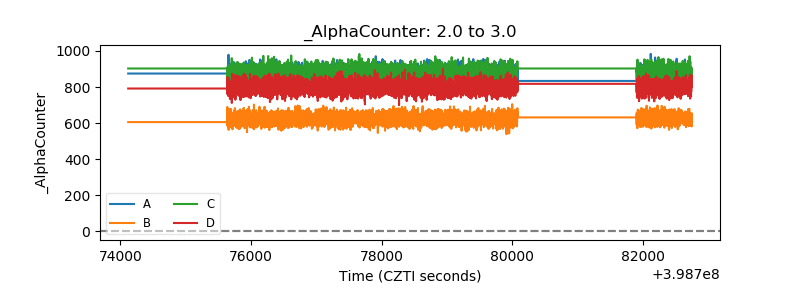 |
| _CPM_Rate | 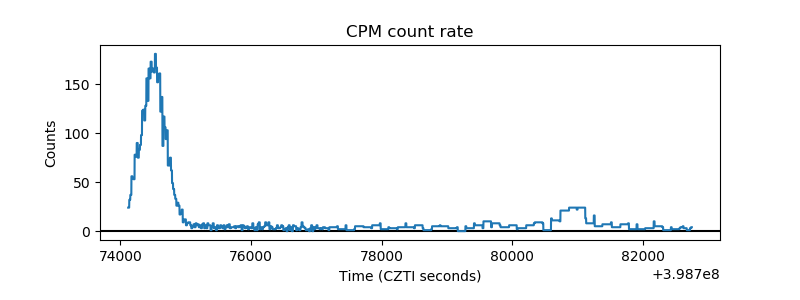 |
| CZT Counter | 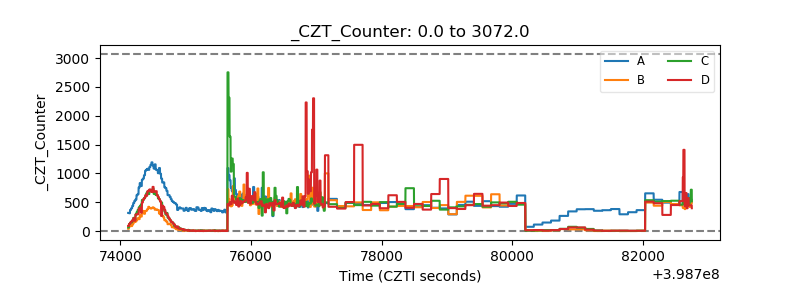 |
| +2.5 Volts monitor | 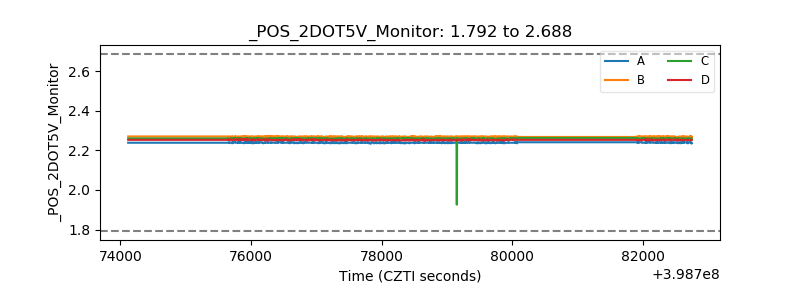 |
| +5 Volts monitor | 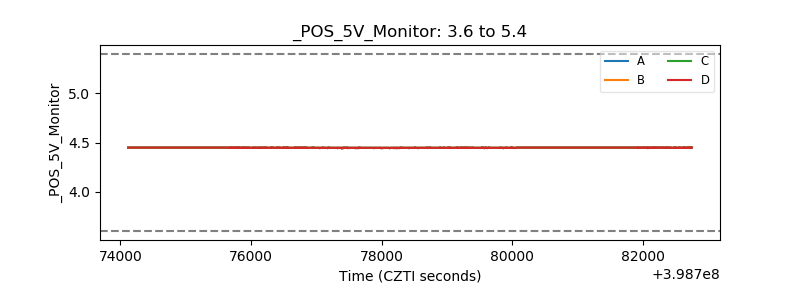 |
| _ROLL_ROT | 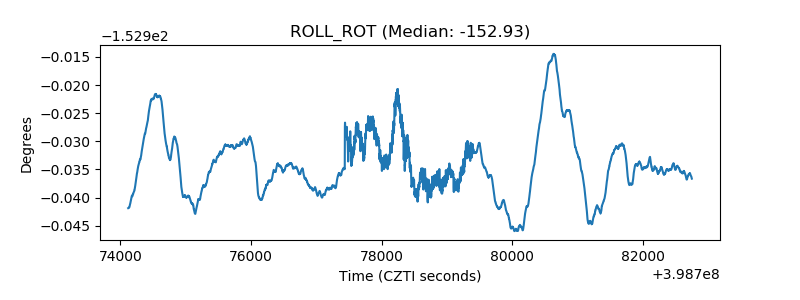 |
| _Roll_DEC |  |
| _Roll_RA | 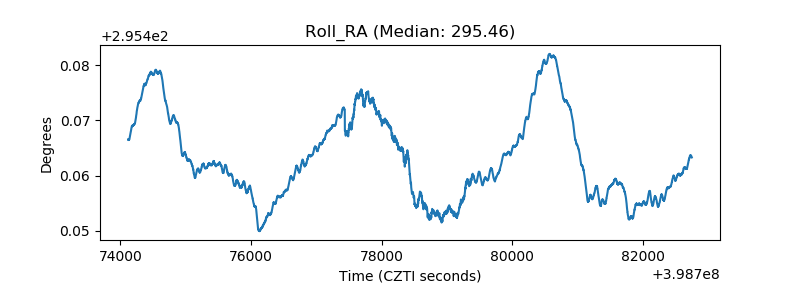 |
| Veto Counter | 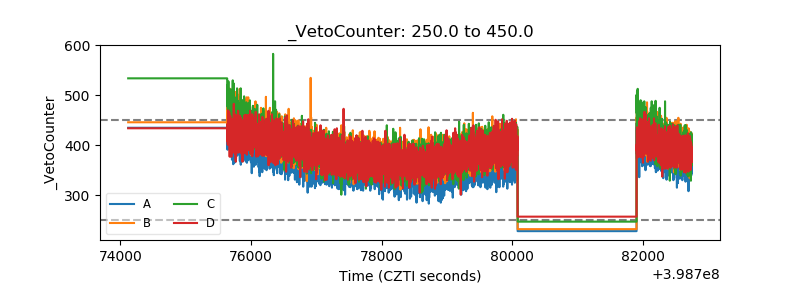 |