| Param | Original file | Final file |
|---|---|---|
| Filename | modeM0/AS1A10_103T07_9000005302_37293cztM0_level2.evt | modeM0/AS1A10_103T07_9000005302_37293cztM0_level2_quad_clean.evt |
| Size (bytes) | 1,080,504,000 | 222,183,360 |
| Size | 1.0 GB | 211.9 MB |
| Events in quadrant A | 7,252,589 | 1,430,479 |
| Events in quadrant B | 7,383,439 | 1,457,760 |
| Events in quadrant C | 8,851,628 | 1,458,940 |
| Events in quadrant D | 8,264,949 | 1,391,007 |
| Mode M0 | |||
|---|---|---|---|
| Quadrant | BADHDUFLAG | Total packets | Discarded packets |
| A | 0 | 30492 | 5 |
| B | 0 | 31020 | 4 |
| C | 0 | 35194 | 4 |
| D | 0 | 34340 | 4 |
| Mode M9 | |||
|---|---|---|---|
| Quadrant | BADHDUFLAG | Total packets | Discarded packets |
| A | 0 | 63 | 0 |
| B | 0 | 63 | 0 |
| C | 0 | 63 | 0 |
| D | 0 | 64 | 0 |
| Mode SS | |||
|---|---|---|---|
| Quadrant | BADHDUFLAG | Total packets | Discarded packets |
| A | 0 | 292 | 0 |
| B | 0 | 292 | 0 |
| C | 0 | 292 | 0 |
| D | 0 | 292 | 0 |
| Quadrant | Total seconds | Saturated seconds | Saturation percentage |
|---|---|---|---|
| A | 14366 | 45 | 0.313240% |
| B | 14366 | 98 | 0.682166% |
| C | 14366 | 451 | 3.139357% |
| D | 14366 | 249 | 1.733259% |
Noise dominated data is calculated using 1-second bins in cleaned event files. If a bin has >2000 counts, and if more than 50% of those come from <1% of pixels, then it is considered to be noise-dominated and hence unusable.
| Quadrant | # 1 sec bins | Bins with >0 counts | Bins with >2000 counts | High rate bins dominated by noise | Noise dominated (total time) | Noise dominated (detector-on time) | Marked lightcurve |
|---|---|---|---|---|---|---|---|
| A | 19744 | 14369 | 19 | 19 | 0.10% | 0.13% | 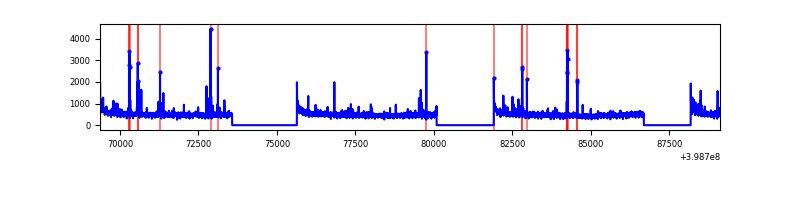 |
| B | 19744 | 14369 | 52 | 52 | 0.26% | 0.36% | 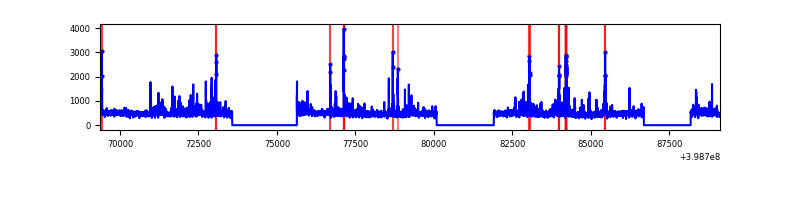 |
| C | 19744 | 14369 | 413 | 413 | 2.09% | 2.87% | 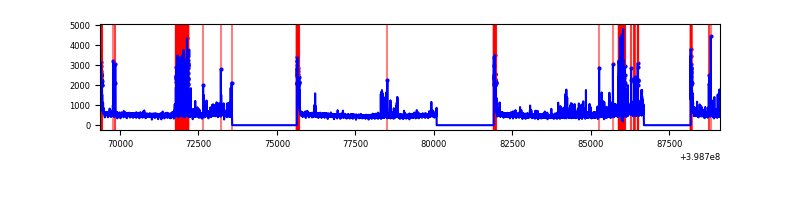 |
| D | 19744 | 14369 | 249 | 249 | 1.26% | 1.73% | 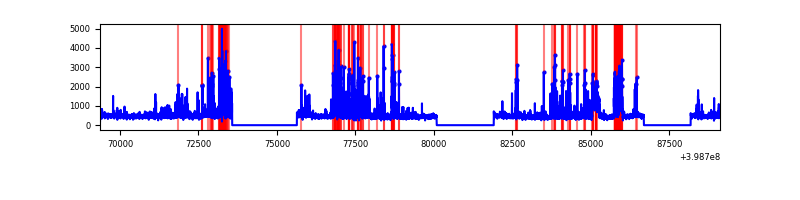 |
Top three noisy pixels from each quadrant. If the there are fewer than three noisy pixels in the level2.evt file, extra rows are filled as -1
| Pixel properties | Quadrant properties | ||||||
|---|---|---|---|---|---|---|---|
| Quadrant | DetID | PixID | Counts | Sigma | Mean | Median | Sigma |
| A | 10 | 83 | 626066 | 1915.81 | 1639 | 1611 | 325.9 |
| A | 9 | 143 | 132432 | 401.36 | 1639 | 1611 | 325.9 |
| A | 13 | 248 | 42215 | 124.57 | 1639 | 1611 | 325.9 |
| B | 0 | 213 | 349023 | 1120.15 | 1628 | 1586 | 310.2 |
| B | 12 | 18 | 213091 | 681.9 | 1628 | 1586 | 310.2 |
| B | 0 | 221 | 211839 | 677.87 | 1628 | 1586 | 310.2 |
| C | 1 | 23 | 1285562 | 3484.75 | 1583 | 1597 | 368.5 |
| C | 15 | 214 | 596282 | 1614.01 | 1583 | 1597 | 368.5 |
| C | 0 | 10 | 477623 | 1291.96 | 1583 | 1597 | 368.5 |
| D | 2 | 249 | 723827 | 1877.79 | 1595 | 1554 | 384.6 |
| D | 10 | 199 | 653881 | 1695.94 | 1595 | 1554 | 384.6 |
| D | 12 | 17 | 285450 | 738.08 | 1595 | 1554 | 384.6 |
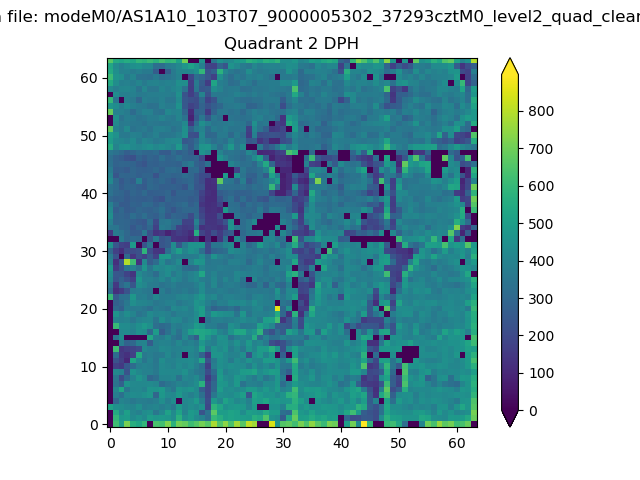
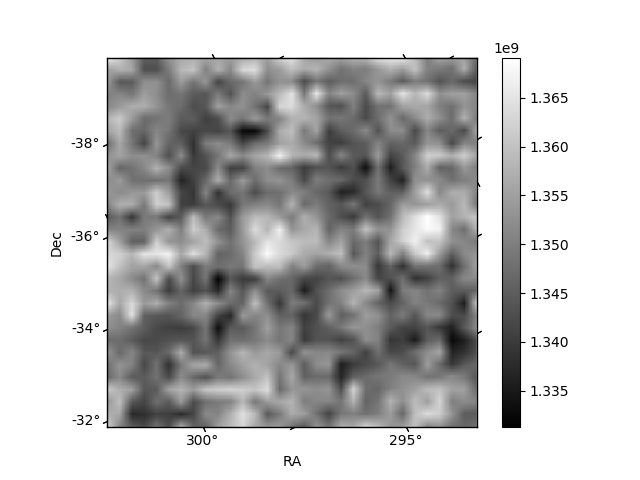
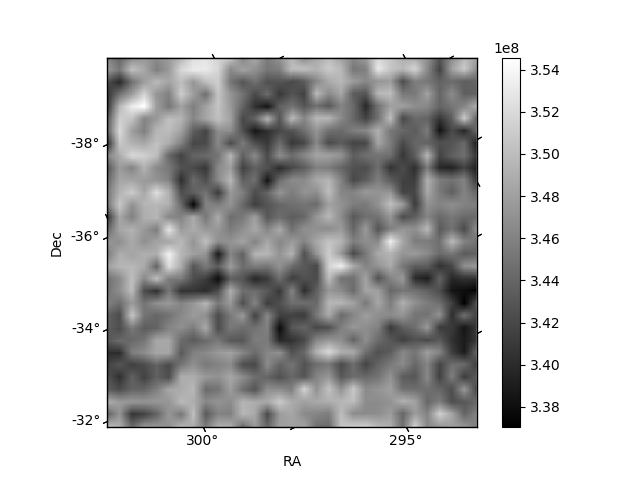
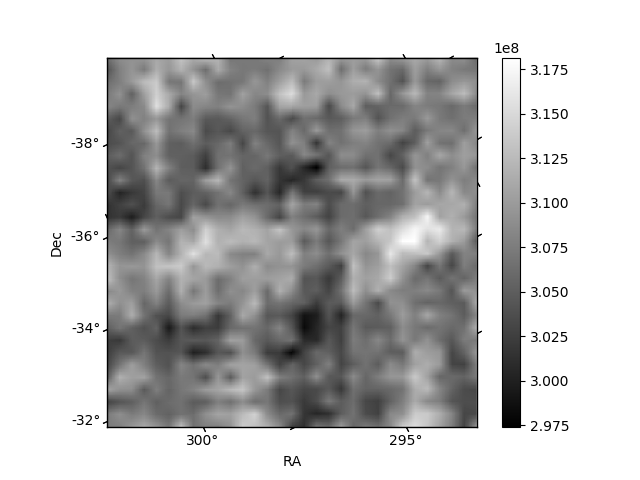
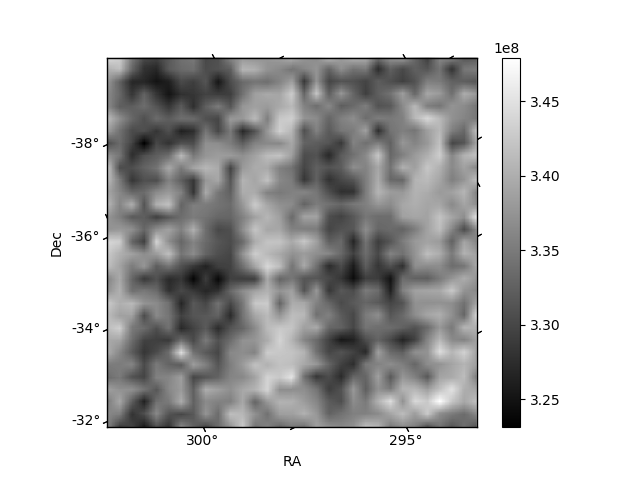
Histogram calculated using DETX and DETY for each event in the final _common_clean file
| Quadrant A | 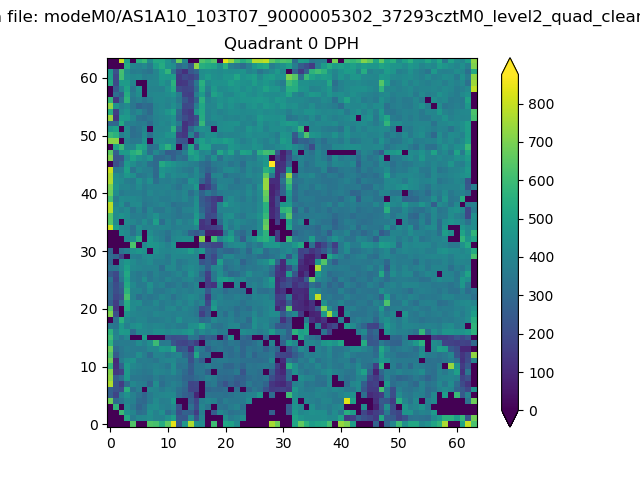 |
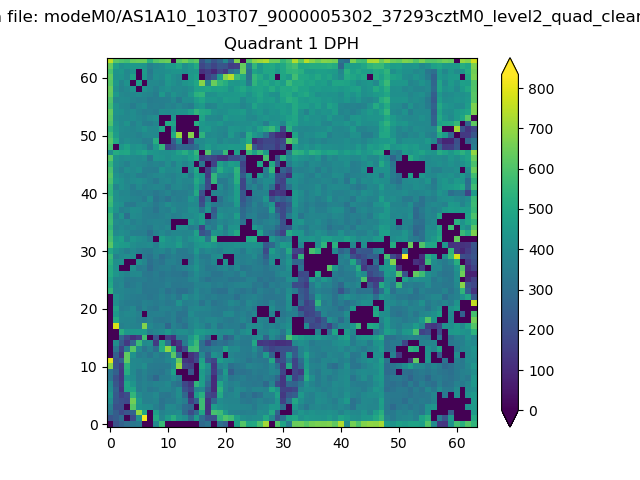 |
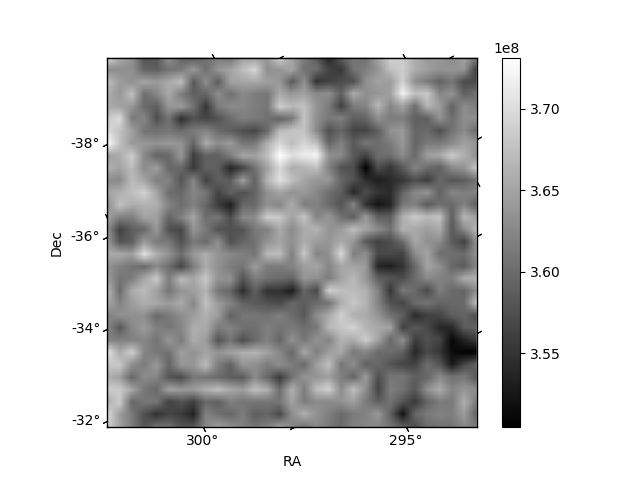
Quadrant B |
|---|---|---|---|
| Quadrant D | 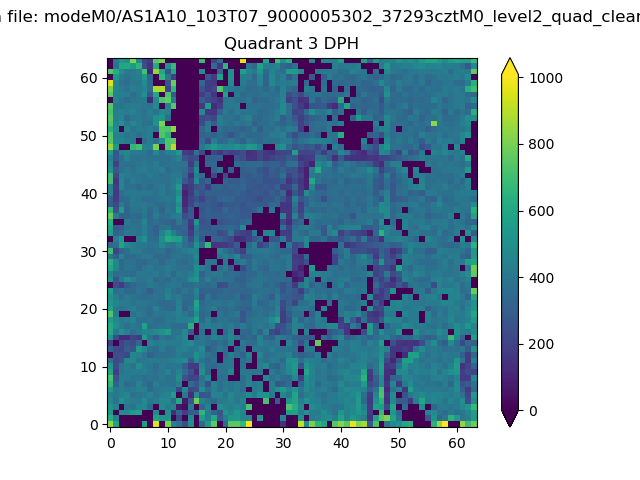 |
 |
Quadrant C |
| Plot type | Count rate plots | Images |
|---|---|---|
| Comparison with Poisson distribution Blue bars denote a histogram of data divided into 1 sec bins. Red curve is a Poisson curve with rate = median count rate of data. |
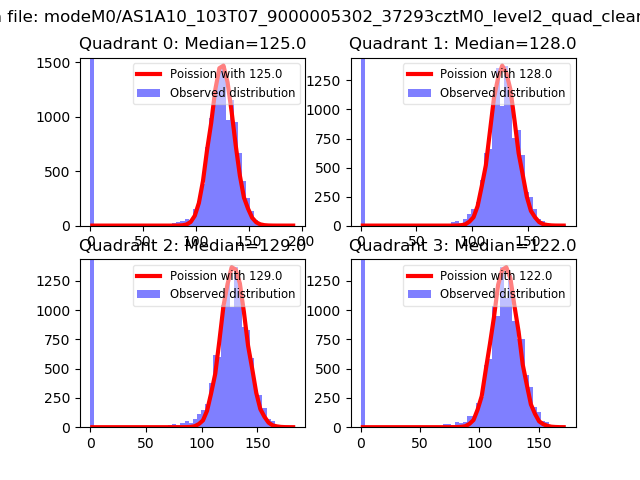 |
 |
| Quadrant-wise count rates Data is divided into 100 sec bins |
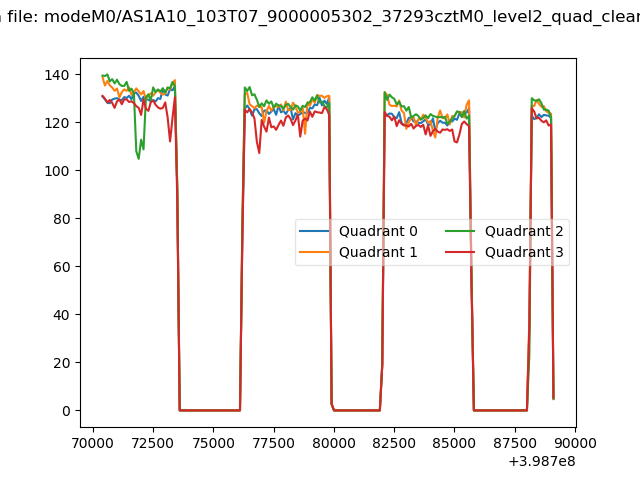 |
|
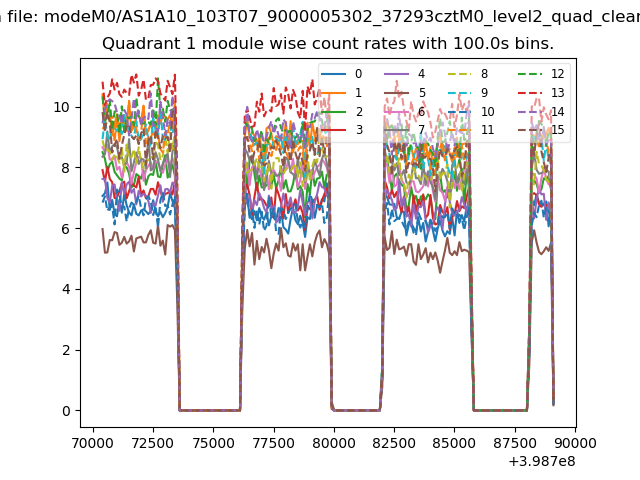
| Module-wise count rates for Quadrant A Data is divided into 100 sec bins |
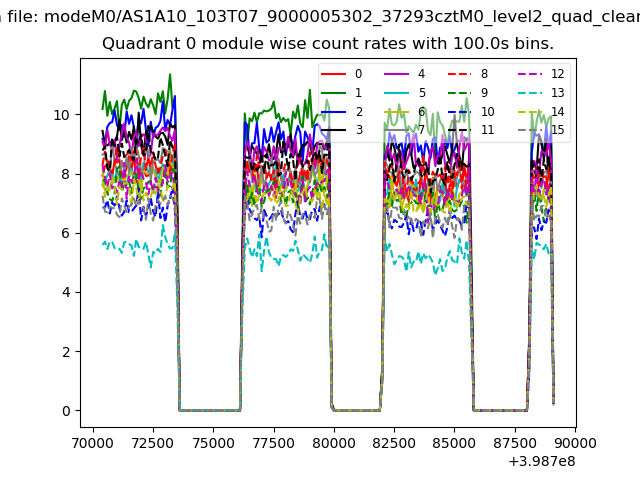 |
 |
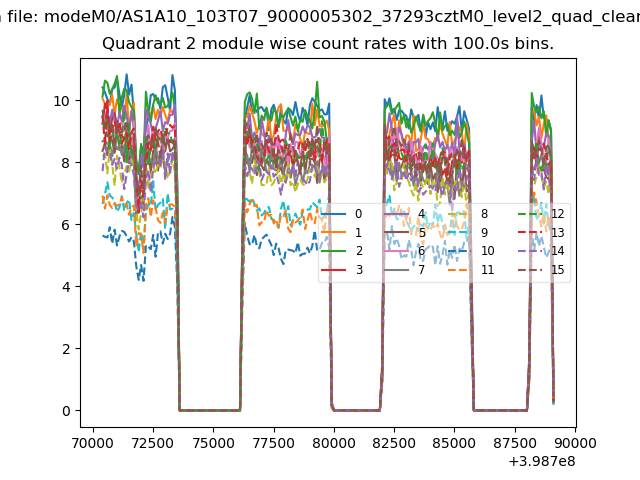
| Module-wise count rates for Quadrant B Data is divided into 100 sec bins |
 |
 |
| Module-wise count rates for Quadrant C Data is divided into 100 sec bins |
 |
 |
| Module-wise count rates for Quadrant D Data is divided into 100 sec bins |
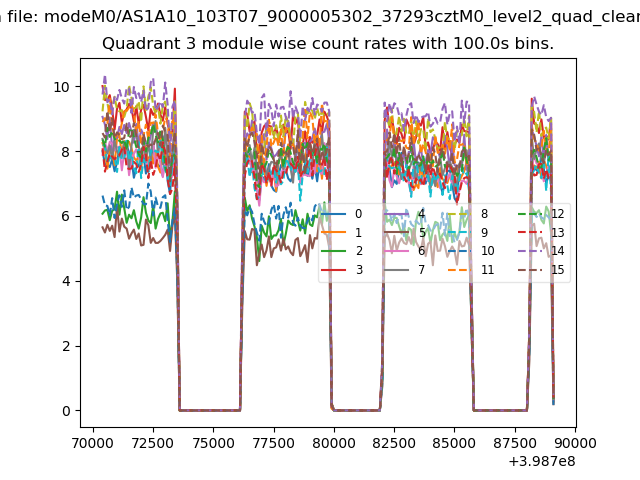 |
 |
| Parameter | Plot |
|---|---|
| CZT HV Monitor | 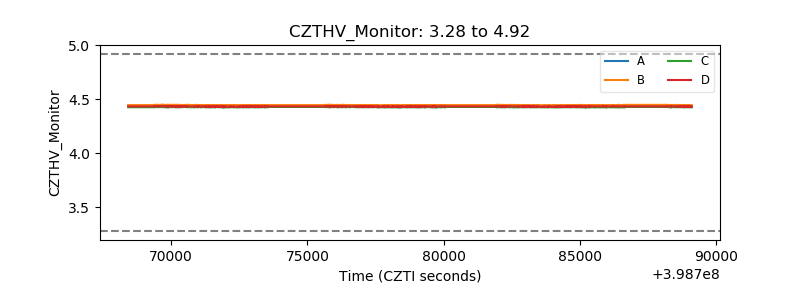 |
| D_VDD | 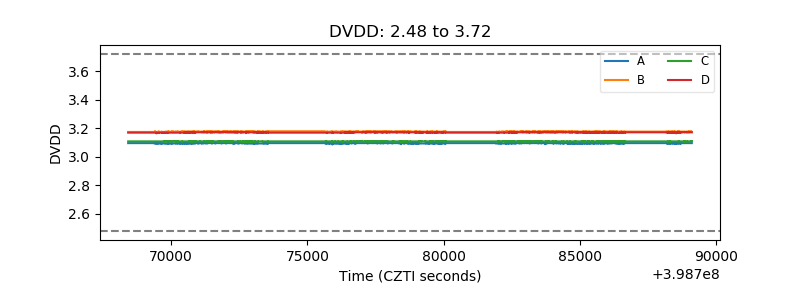 |
| Temperature 1 | 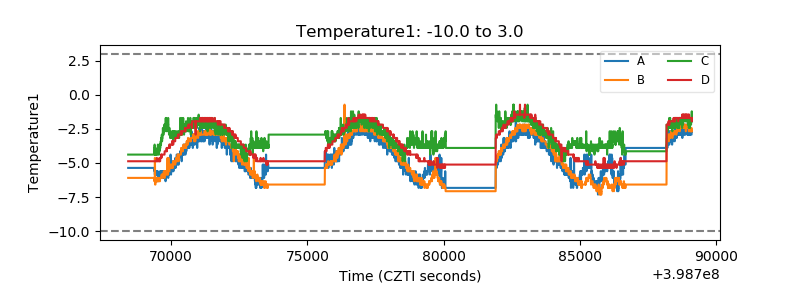 |
| Veto HV Monitor | 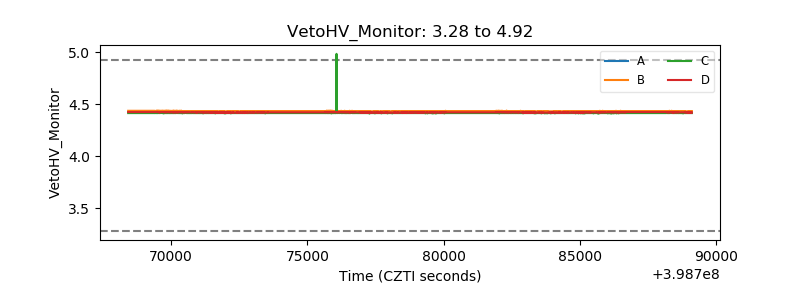 |
| Veto LLD | 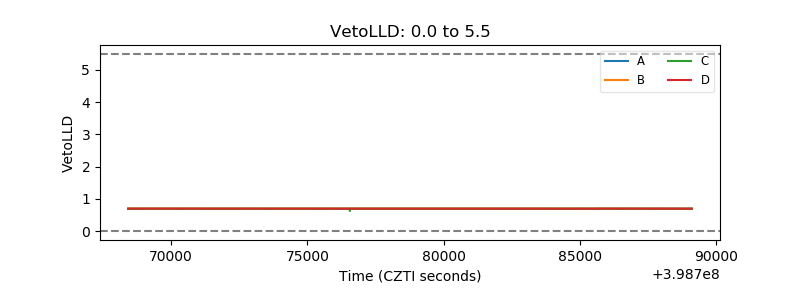 |
| Alpha Counter | 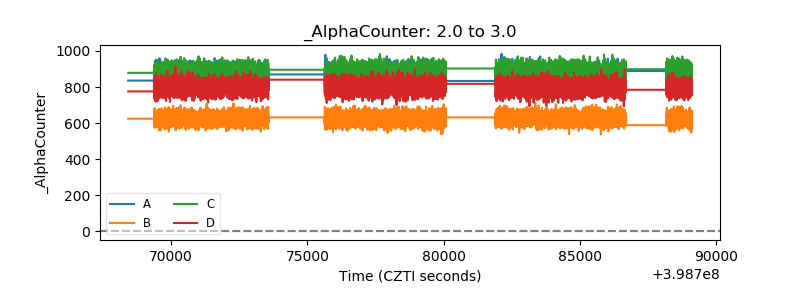 |
| _CPM_Rate | 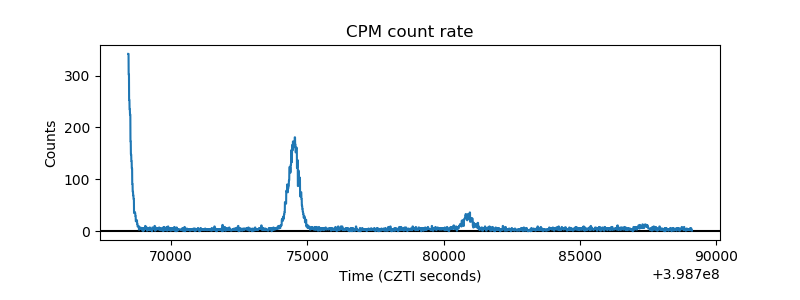 |
| CZT Counter | 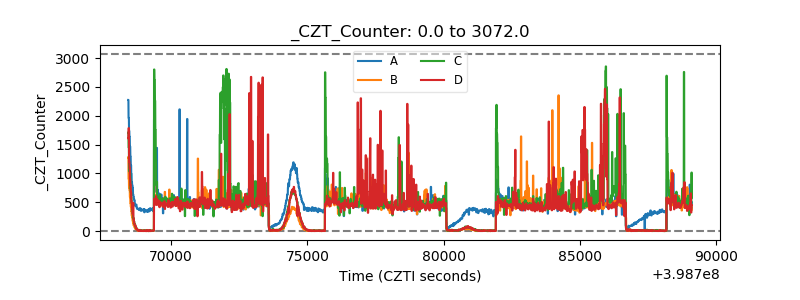 |
| +2.5 Volts monitor | 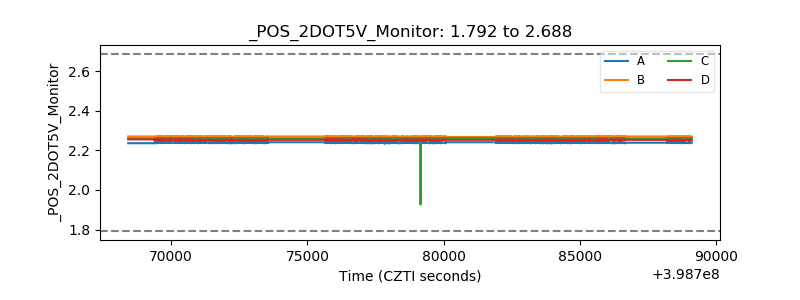 |
| +5 Volts monitor | 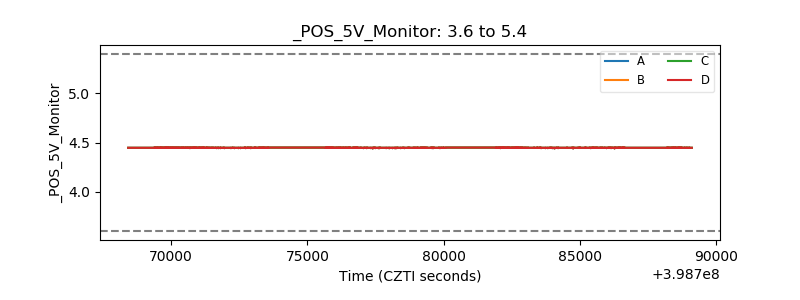 |
| _ROLL_ROT | 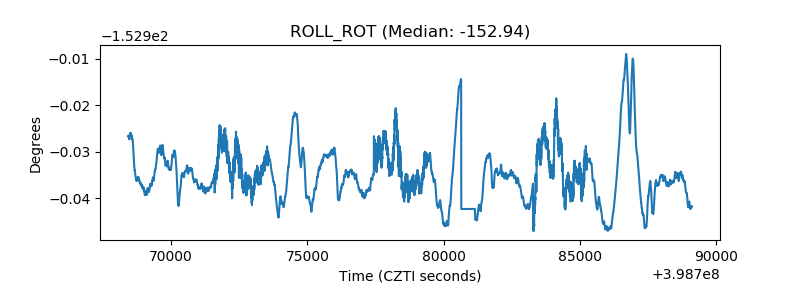 |
| _Roll_DEC | 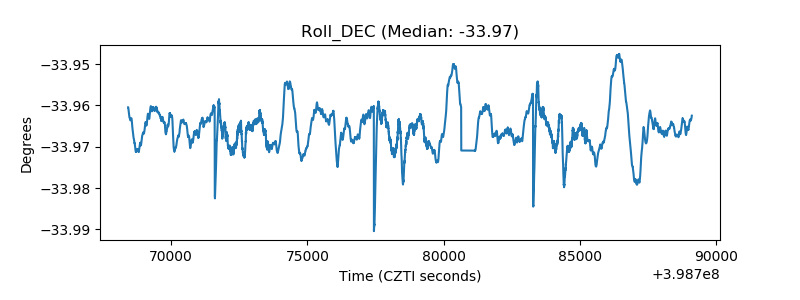 |
| _Roll_RA | 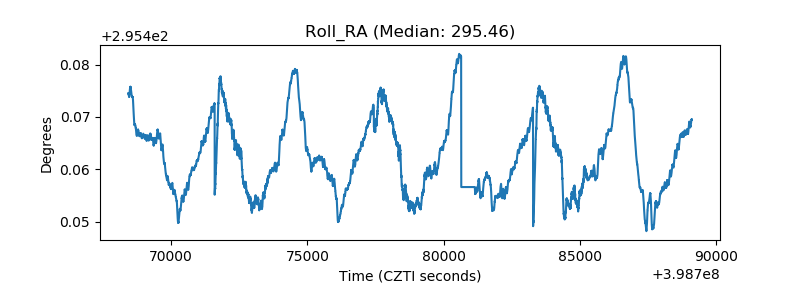 |
| Veto Counter | 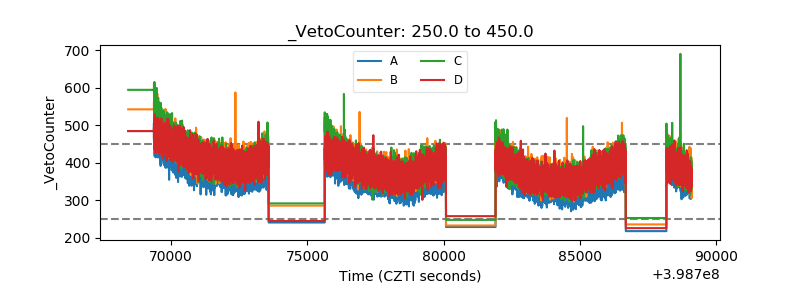 |