| Param | Original file | Final file |
|---|---|---|
| Filename | modeM0/AS1A10_103T07_9000005302_37294cztM0_level2.evt | modeM0/AS1A10_103T07_9000005302_37294cztM0_level2_quad_clean.evt |
| Size (bytes) | 539,982,720 | 82,241,280 |
| Size | 515.0 MB | 78.4 MB |
| Events in quadrant A | 2,992,277 | 522,638 |
| Events in quadrant B | 2,811,223 | 534,091 |
| Events in quadrant C | 3,327,028 | 530,667 |
| Events in quadrant D | 6,824,832 | 493,173 |
| Mode M0 | |||
|---|---|---|---|
| Quadrant | BADHDUFLAG | Total packets | Discarded packets |
| A | 0 | 12651 | 3 |
| B | 0 | 12168 | 2 |
| C | 0 | 13607 | 2 |
| D | 0 | 24401 | 2 |
| Mode M9 | |||
|---|---|---|---|
| Quadrant | BADHDUFLAG | Total packets | Discarded packets |
| A | 0 | 17 | 0 |
| B | 0 | 17 | 0 |
| C | 0 | 17 | 0 |
| D | 0 | 18 | 0 |
| Mode SS | |||
|---|---|---|---|
| Quadrant | BADHDUFLAG | Total packets | Discarded packets |
| A | 0 | 118 | 0 |
| B | 0 | 118 | 0 |
| C | 0 | 118 | 0 |
| D | 0 | 118 | 0 |
| Quadrant | Total seconds | Saturated seconds | Saturation percentage |
|---|---|---|---|
| A | 5870 | 15 | 0.255537% |
| B | 5870 | 17 | 0.289608% |
| C | 5870 | 117 | 1.993186% |
| D | 5870 | 1649 | 28.091993% |
Noise dominated data is calculated using 1-second bins in cleaned event files. If a bin has >2000 counts, and if more than 50% of those come from <1% of pixels, then it is considered to be noise-dominated and hence unusable.
| Quadrant | # 1 sec bins | Bins with >0 counts | Bins with >2000 counts | High rate bins dominated by noise | Noise dominated (total time) | Noise dominated (detector-on time) | Marked lightcurve |
|---|---|---|---|---|---|---|---|
| A | 7214 | 5871 | 4 | 4 | 0.06% | 0.07% | 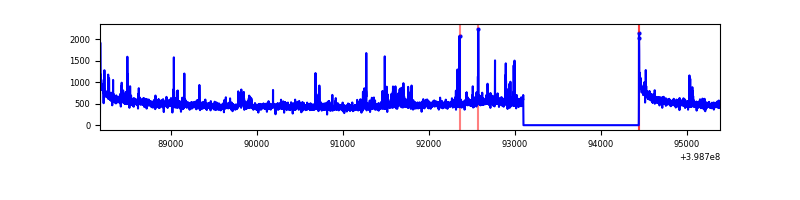 |
| B | 7214 | 5871 | 4 | 4 | 0.06% | 0.07% | 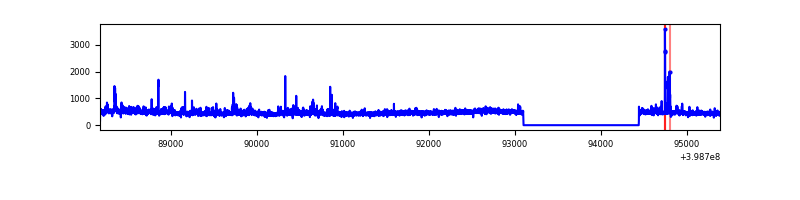 |
| C | 7214 | 5870 | 95 | 95 | 1.32% | 1.62% | 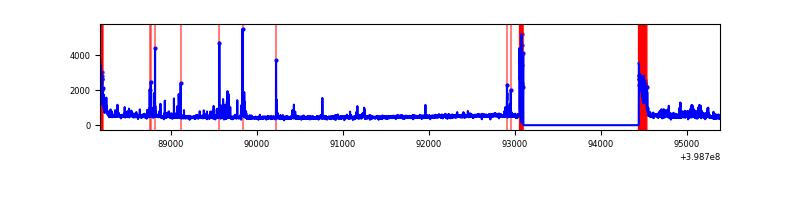 |
| D | 7214 | 5870 | 1567 | 1567 | 21.72% | 26.70% | 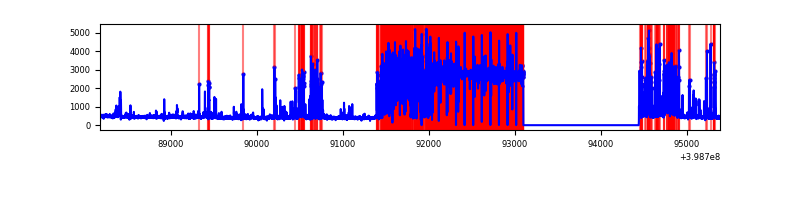 |
Top three noisy pixels from each quadrant. If the there are fewer than three noisy pixels in the level2.evt file, extra rows are filled as -1
| Pixel properties | Quadrant properties | ||||||
|---|---|---|---|---|---|---|---|
| Quadrant | DetID | PixID | Counts | Sigma | Mean | Median | Sigma |
| A | 10 | 83 | 284192 | 2121.38 | 658 | 645 | 133.7 |
| A | 7 | 16 | 63045 | 466.85 | 658 | 645 | 133.7 |
| A | 6 | 10 | 46198 | 340.81 | 658 | 645 | 133.7 |
| B | 0 | 213 | 97681 | 759.75 | 654 | 636 | 127.7 |
| B | 0 | 221 | 44087 | 340.17 | 654 | 636 | 127.7 |
| B | 15 | 85 | 29268 | 224.16 | 654 | 636 | 127.7 |
| C | 0 | 10 | 257969 | 1724.55 | 635 | 639 | 149.2 |
| C | 1 | 23 | 256423 | 1714.19 | 635 | 639 | 149.2 |
| C | 15 | 214 | 248048 | 1658.07 | 635 | 639 | 149.2 |
| D | 10 | 253 | 4586237 | 36405.44 | 510 | 495 | 126.0 |
| D | 12 | 227 | 122530 | 968.82 | 510 | 495 | 126.0 |
| D | 2 | 249 | 55646 | 437.83 | 510 | 495 | 126.0 |
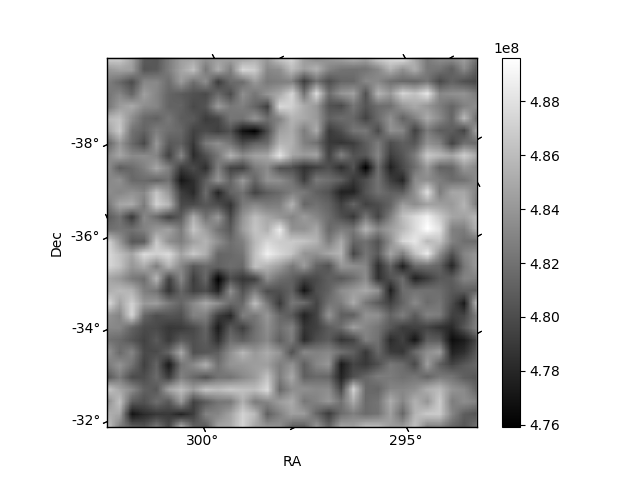
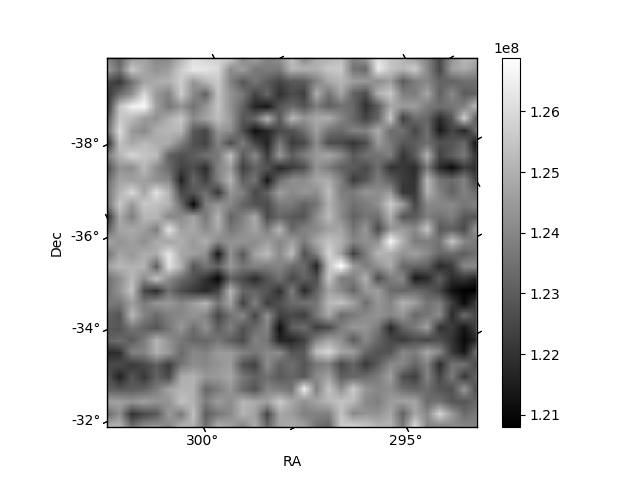
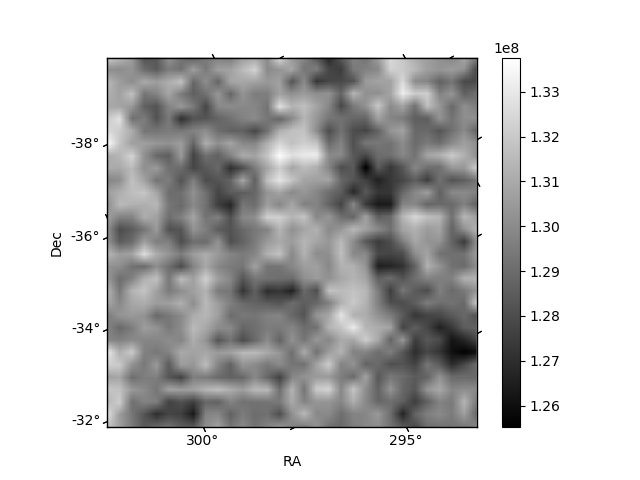
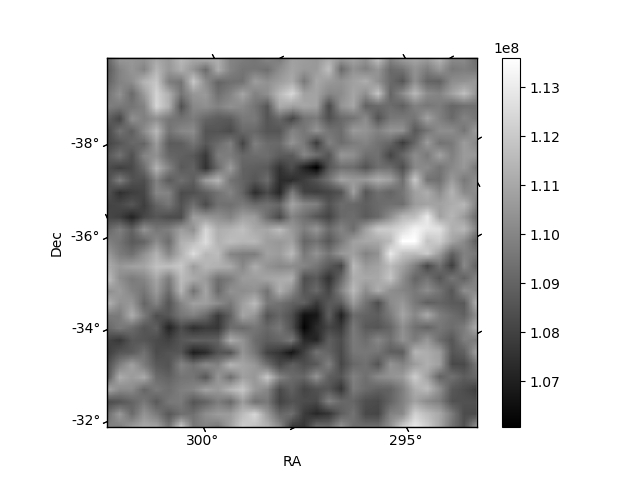
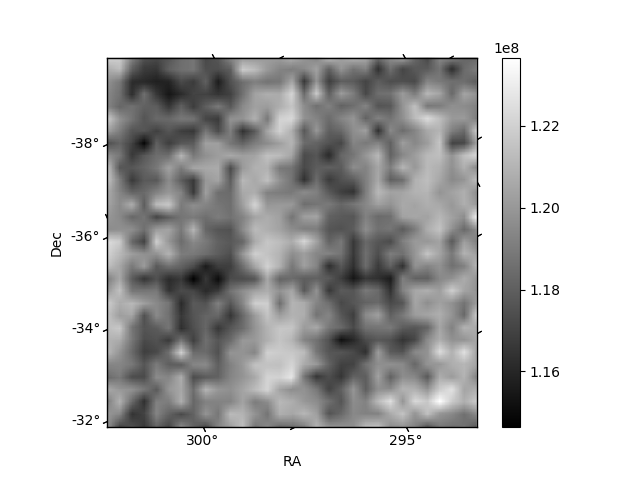
Histogram calculated using DETX and DETY for each event in the final _common_clean file
| Quadrant A | 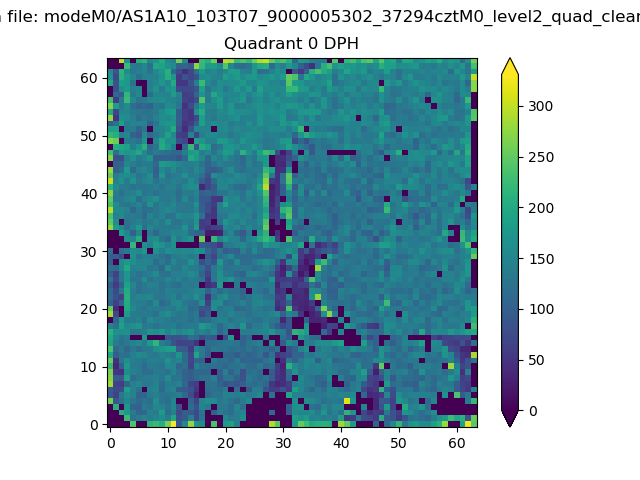 |
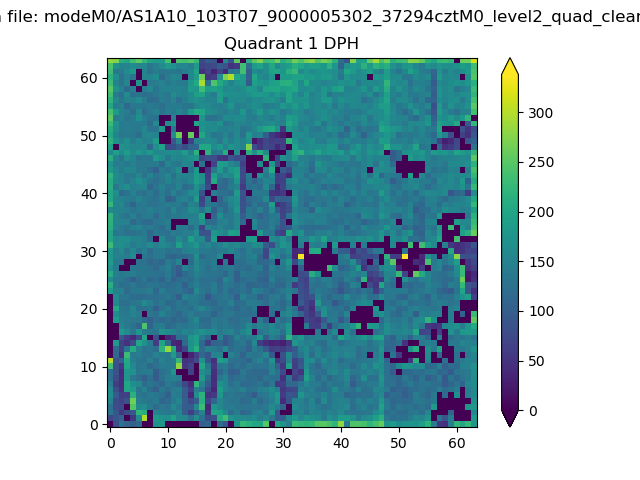 |
Quadrant B |
|---|---|---|---|
| Quadrant D | 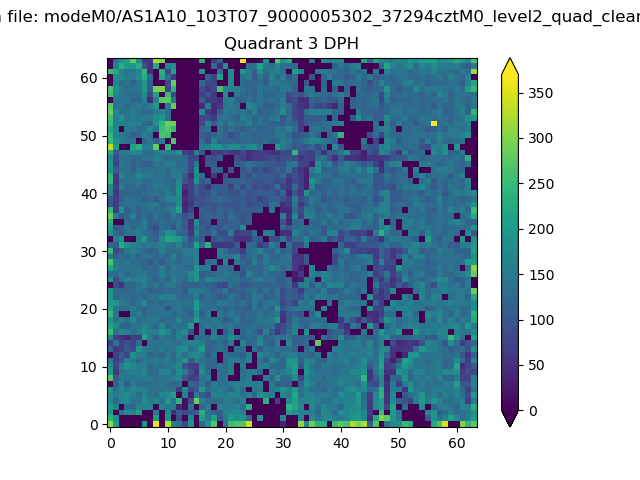 |
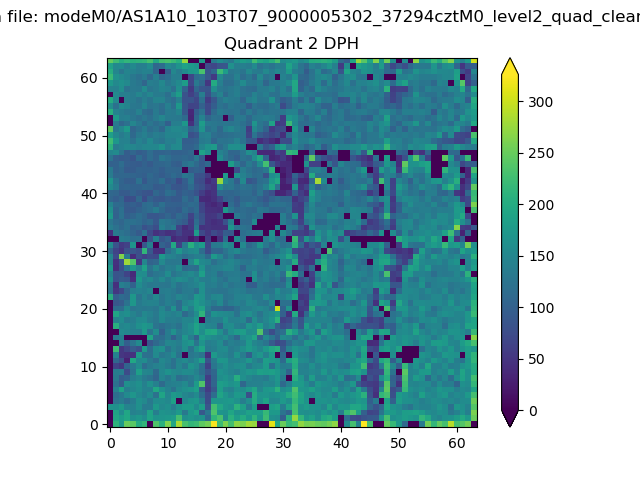 |
Quadrant C |
| Plot type | Count rate plots | Images |
|---|---|---|
| Comparison with Poisson distribution Blue bars denote a histogram of data divided into 1 sec bins. Red curve is a Poisson curve with rate = median count rate of data. |
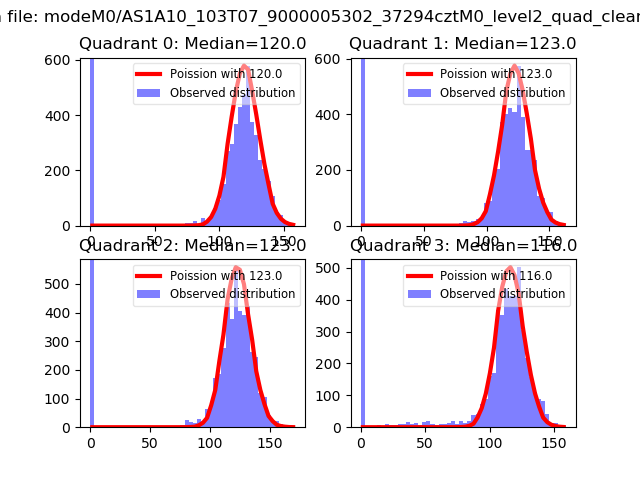 |
 |
| Quadrant-wise count rates Data is divided into 100 sec bins |
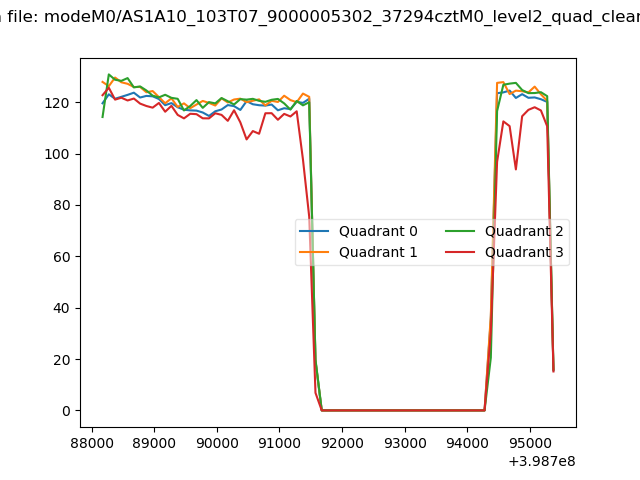 |
|
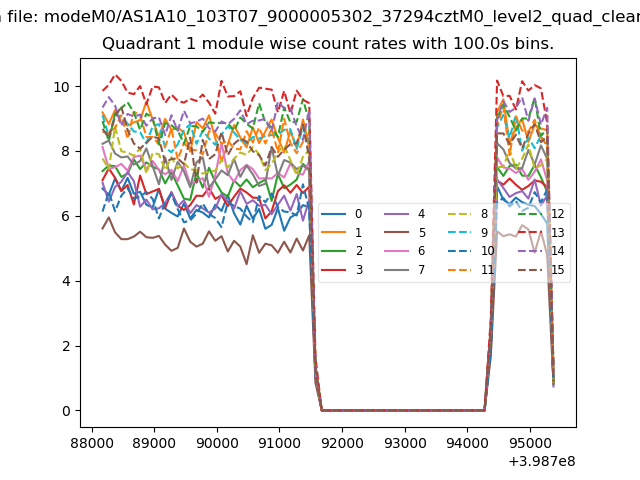
| Module-wise count rates for Quadrant A Data is divided into 100 sec bins |
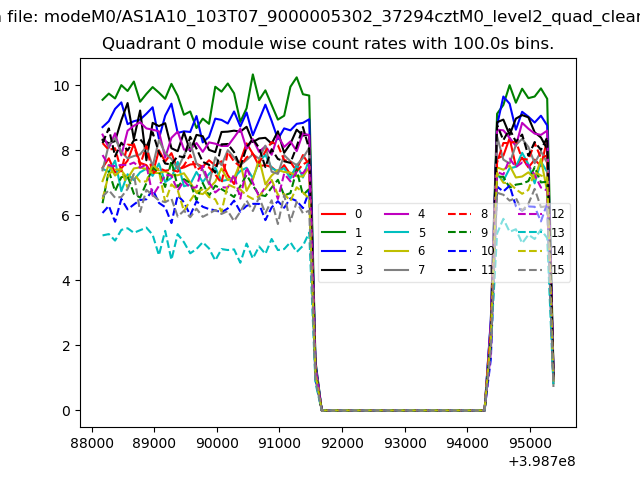 |
 |
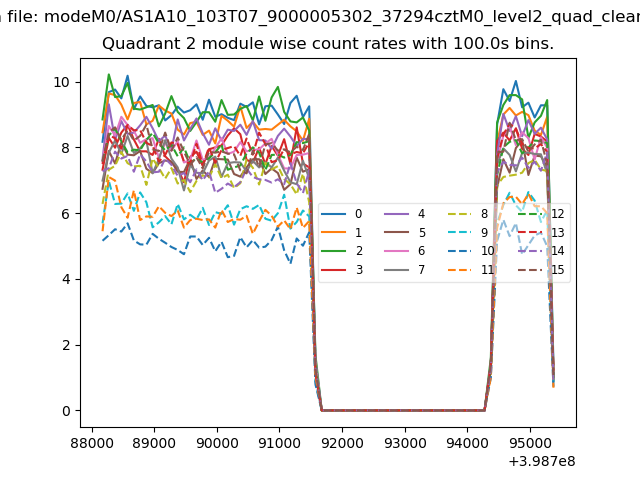
| Module-wise count rates for Quadrant B Data is divided into 100 sec bins |
 |
 |
| Module-wise count rates for Quadrant C Data is divided into 100 sec bins |
 |
 |
| Module-wise count rates for Quadrant D Data is divided into 100 sec bins |
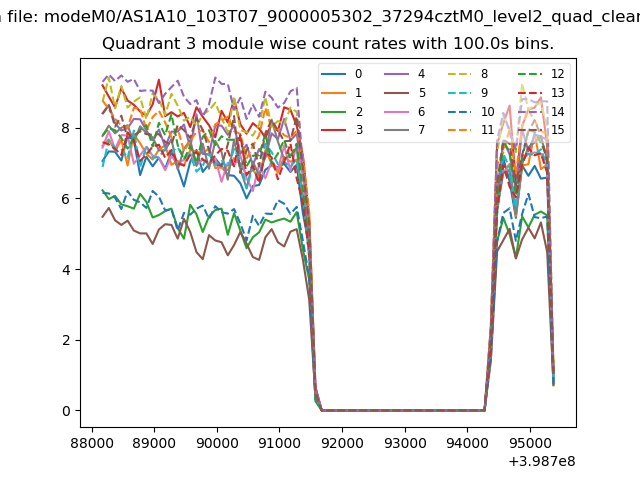 |
 |
| Parameter | Plot |
|---|---|
| CZT HV Monitor | 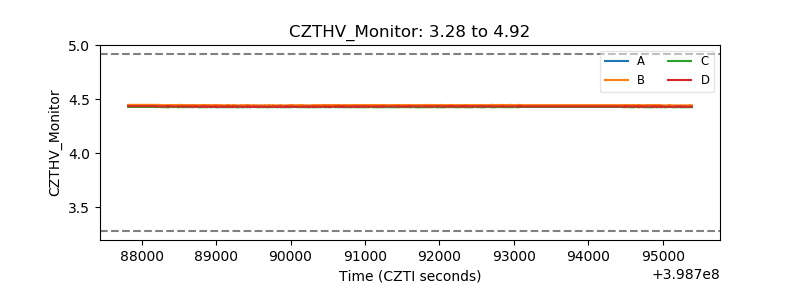 |
| D_VDD | 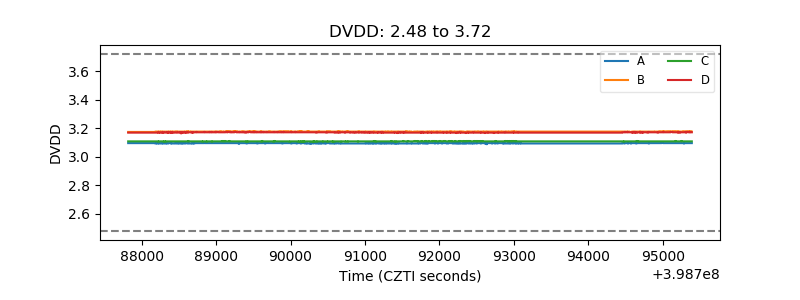 |
| Temperature 1 | 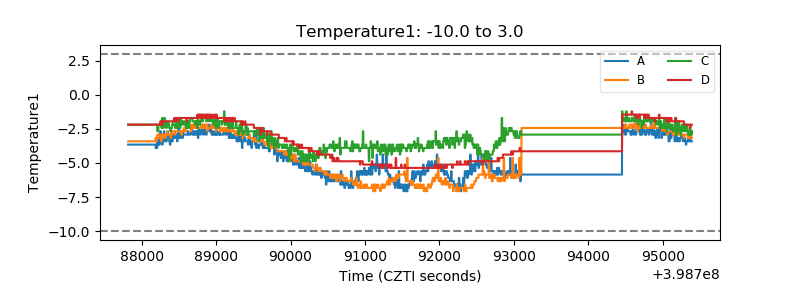 |
| Veto HV Monitor | 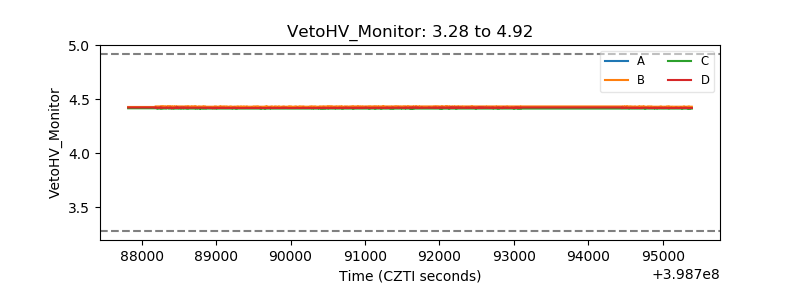 |
| Veto LLD | 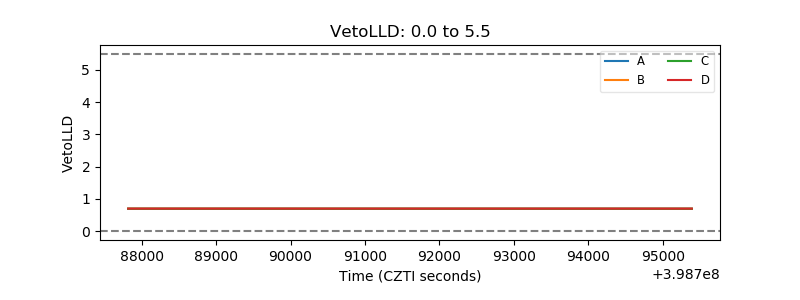 |
| Alpha Counter | 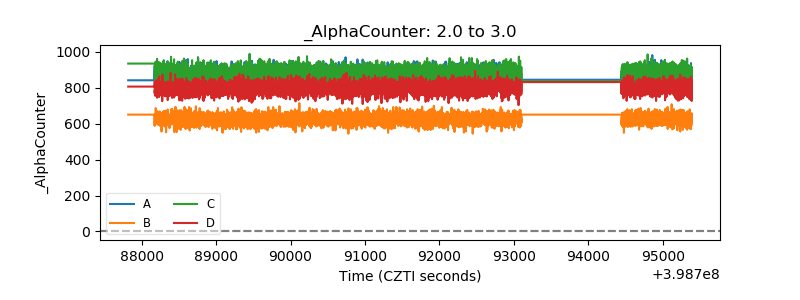 |
| _CPM_Rate | 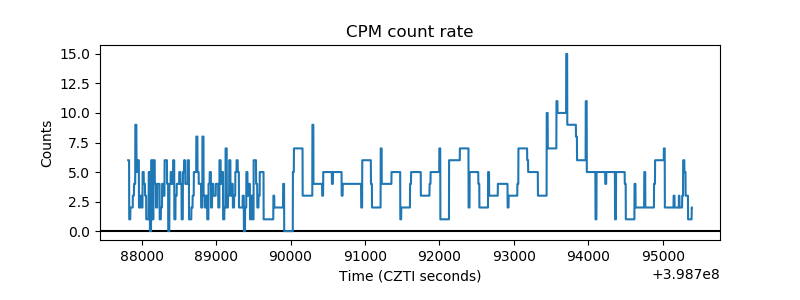 |
| CZT Counter | 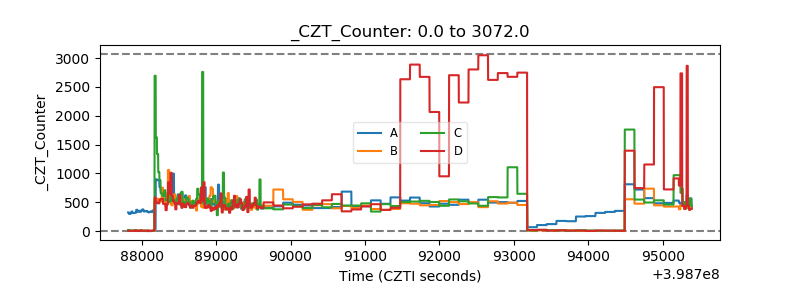 |
| +2.5 Volts monitor | 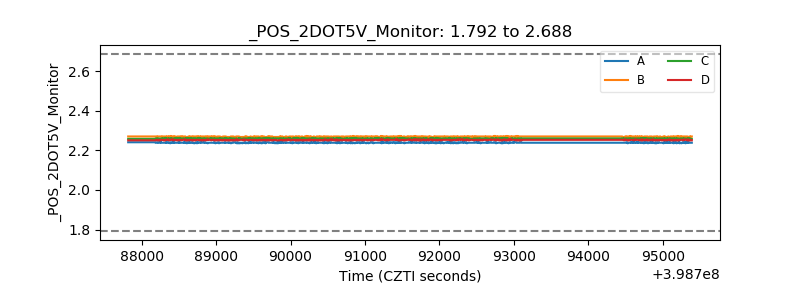 |
| +5 Volts monitor | 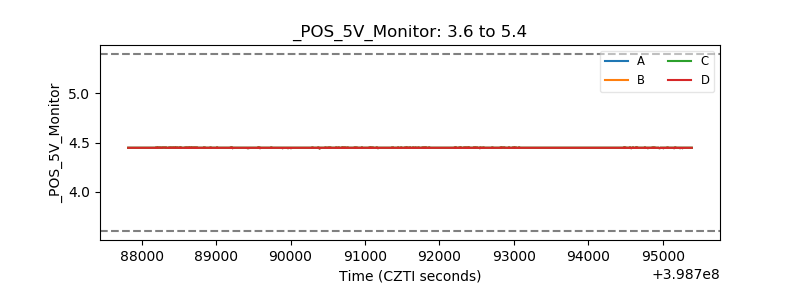 |
| _ROLL_ROT | 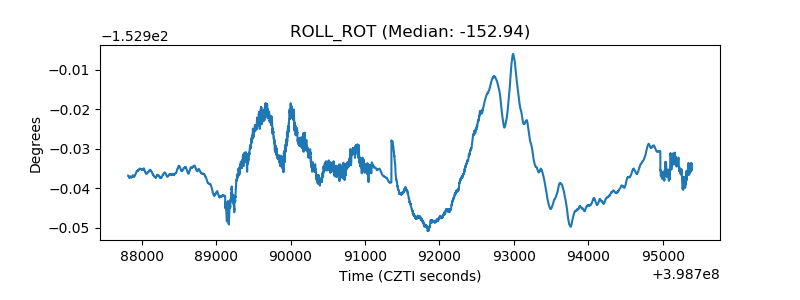 |
| _Roll_DEC | 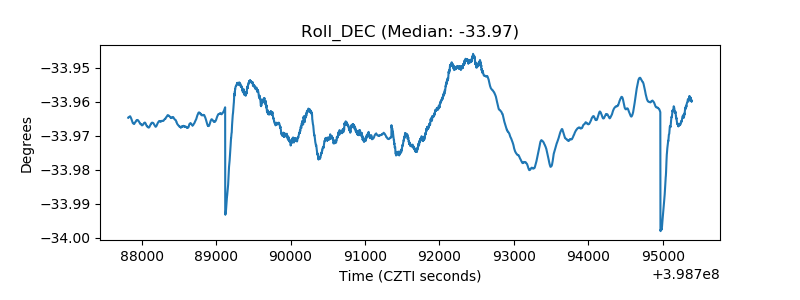 |
| _Roll_RA | 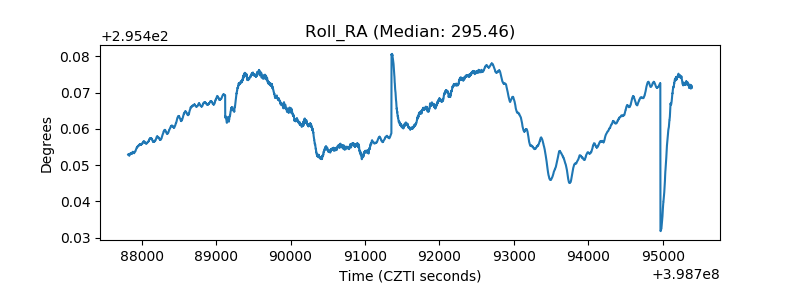 |
| Veto Counter | 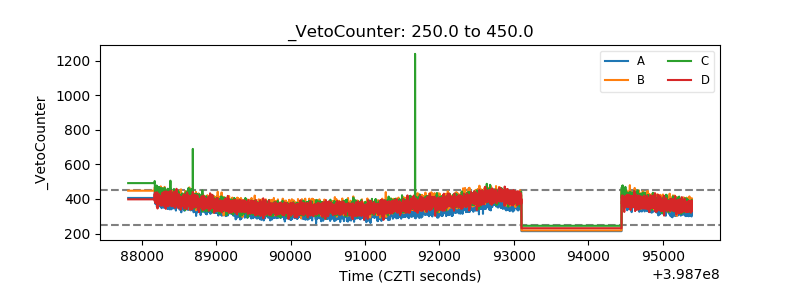 |