| Param | Original file | Final file |
|---|---|---|
| Filename | modeM0/AS1A10_103T07_9000005302_37295cztM0_level2.evt | modeM0/AS1A10_103T07_9000005302_37295cztM0_level2_quad_clean.evt |
| Size (bytes) | 438,229,440 | 75,781,440 |
| Size | 417.9 MB | 72.3 MB |
| Events in quadrant A | 2,986,653 | 476,108 |
| Events in quadrant B | 2,897,352 | 480,192 |
| Events in quadrant C | 3,503,375 | 473,605 |
| Events in quadrant D | 3,479,662 | 448,737 |
| Mode M0 | |||
|---|---|---|---|
| Quadrant | BADHDUFLAG | Total packets | Discarded packets |
| A | 0 | 12740 | 3 |
| B | 0 | 12576 | 2 |
| C | 0 | 14216 | 2 |
| D | 0 | 14639 | 2 |
| Mode M9 | |||
|---|---|---|---|
| Quadrant | BADHDUFLAG | Total packets | Discarded packets |
| A | 0 | 15 | 0 |
| B | 0 | 15 | 0 |
| C | 0 | 15 | 0 |
| D | 0 | 16 | 0 |
| Mode SS | |||
|---|---|---|---|
| Quadrant | BADHDUFLAG | Total packets | Discarded packets |
| A | 0 | 120 | 0 |
| B | 0 | 120 | 0 |
| C | 0 | 120 | 0 |
| D | 0 | 120 | 0 |
| Quadrant | Total seconds | Saturated seconds | Saturation percentage |
|---|---|---|---|
| A | 5958 | 19 | 0.318899% |
| B | 5958 | 29 | 0.486741% |
| C | 5958 | 138 | 2.316213% |
| D | 5958 | 206 | 3.457536% |
Noise dominated data is calculated using 1-second bins in cleaned event files. If a bin has >2000 counts, and if more than 50% of those come from <1% of pixels, then it is considered to be noise-dominated and hence unusable.
| Quadrant | # 1 sec bins | Bins with >0 counts | Bins with >2000 counts | High rate bins dominated by noise | Noise dominated (total time) | Noise dominated (detector-on time) | Marked lightcurve |
|---|---|---|---|---|---|---|---|
| A | 7271 | 5959 | 11 | 11 | 0.15% | 0.18% | 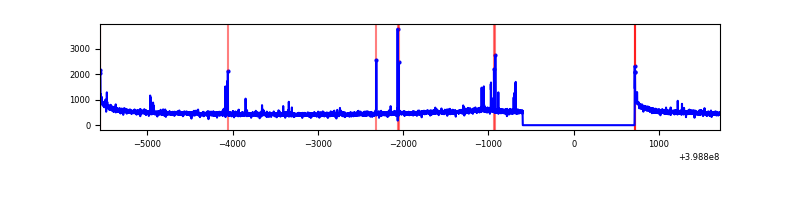 |
| B | 7271 | 5959 | 15 | 15 | 0.21% | 0.25% | 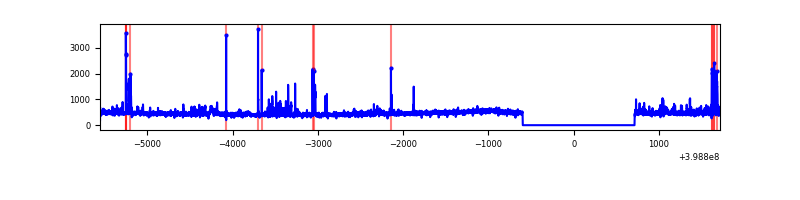 |
| C | 7271 | 5959 | 124 | 124 | 1.71% | 2.08% | 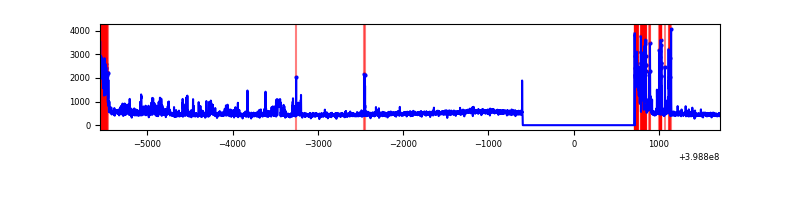 |
| D | 7271 | 5959 | 162 | 162 | 2.23% | 2.72% | 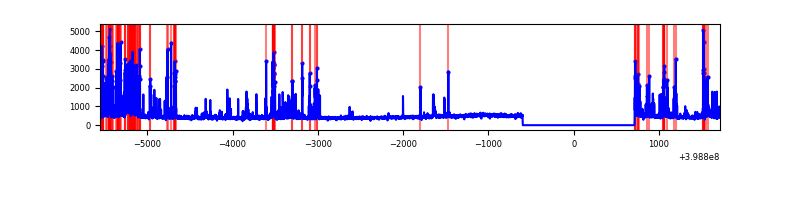 |
Top three noisy pixels from each quadrant. If the there are fewer than three noisy pixels in the level2.evt file, extra rows are filled as -1
| Pixel properties | Quadrant properties | ||||||
|---|---|---|---|---|---|---|---|
| Quadrant | DetID | PixID | Counts | Sigma | Mean | Median | Sigma |
| A | 10 | 83 | 293770 | 2174.23 | 669 | 655 | 134.8 |
| A | 13 | 248 | 35241 | 256.55 | 669 | 655 | 134.8 |
| A | 7 | 16 | 21377 | 153.71 | 669 | 655 | 134.8 |
| B | 0 | 213 | 90345 | 686.05 | 665 | 648 | 130.7 |
| B | 0 | 221 | 65221 | 493.89 | 665 | 648 | 130.7 |
| B | 12 | 18 | 39445 | 296.74 | 665 | 648 | 130.7 |
| C | 1 | 23 | 452324 | 3002.36 | 644 | 649 | 150.4 |
| C | 0 | 10 | 271235 | 1798.63 | 644 | 649 | 150.4 |
| C | 15 | 214 | 249447 | 1653.8 | 644 | 649 | 150.4 |
| D | 10 | 253 | 341610 | 2187.68 | 638 | 620 | 155.9 |
| D | 12 | 227 | 225492 | 1442.71 | 638 | 620 | 155.9 |
| D | 10 | 199 | 164735 | 1052.91 | 638 | 620 | 155.9 |
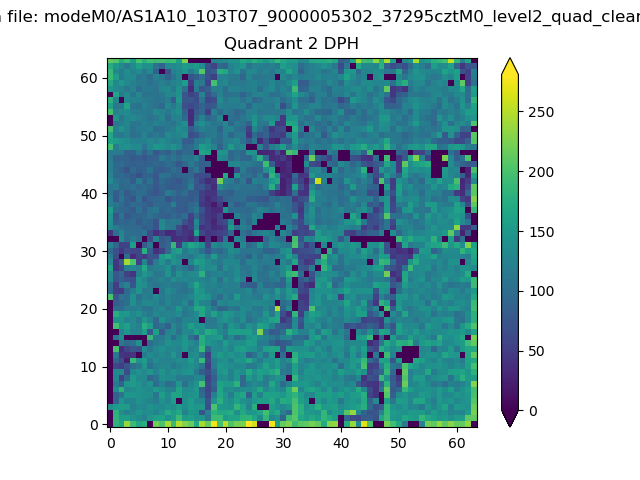
Histogram calculated using DETX and DETY for each event in the final _common_clean file
| Quadrant A | 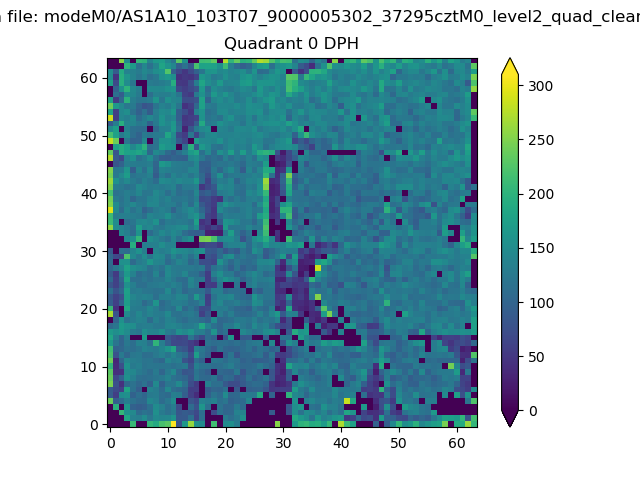 |
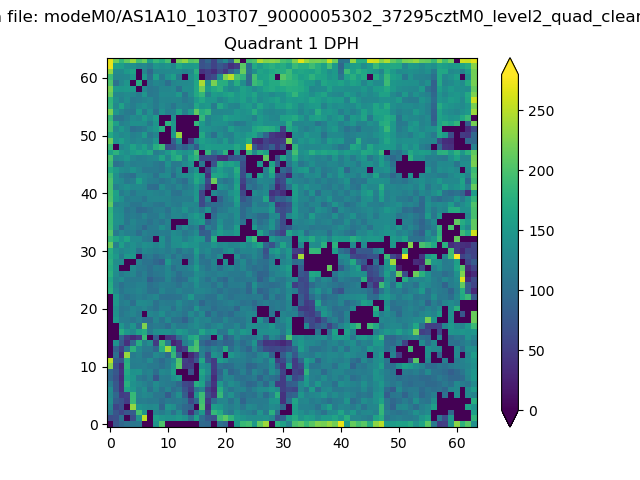 |
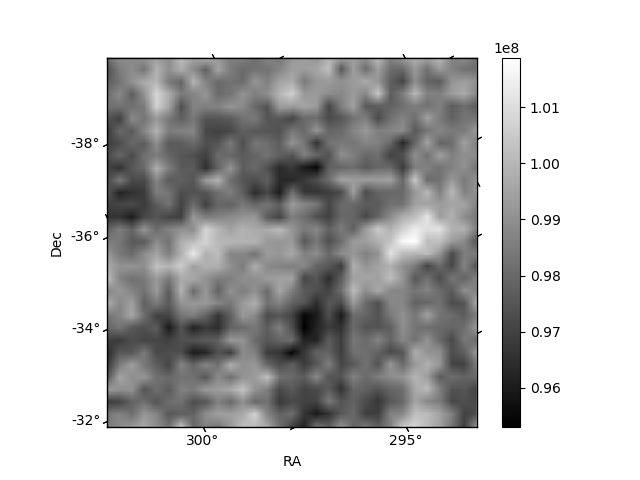
Quadrant B |
|---|---|---|---|
| Quadrant D | 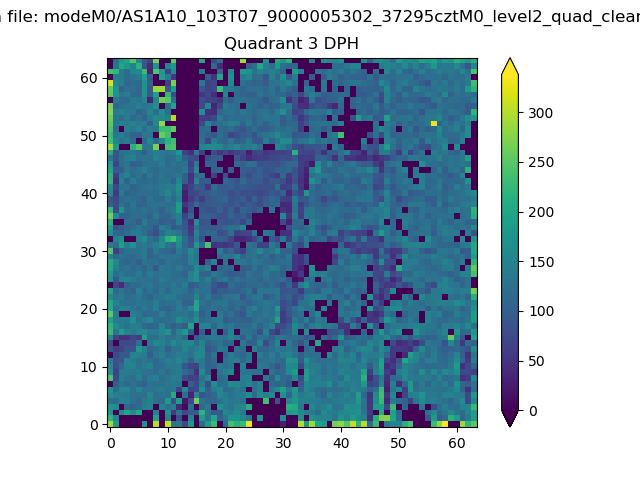 |
 |
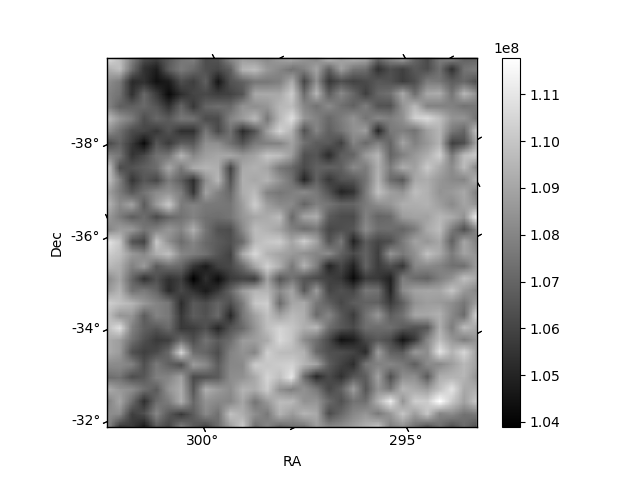
Quadrant C |
| Plot type | Count rate plots | Images |
|---|---|---|
| Comparison with Poisson distribution Blue bars denote a histogram of data divided into 1 sec bins. Red curve is a Poisson curve with rate = median count rate of data. |
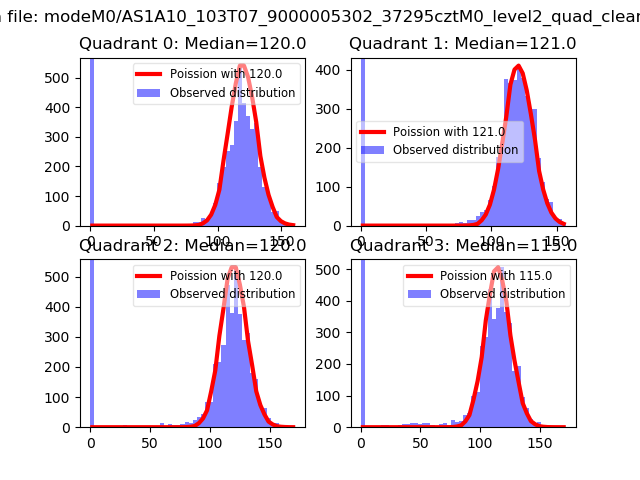 |
 |
| Quadrant-wise count rates Data is divided into 100 sec bins |
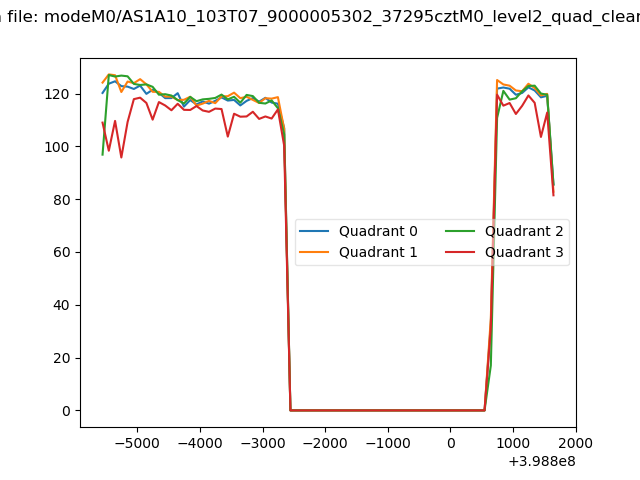 |
|
| Module-wise count rates for Quadrant A Data is divided into 100 sec bins |
 |
 |
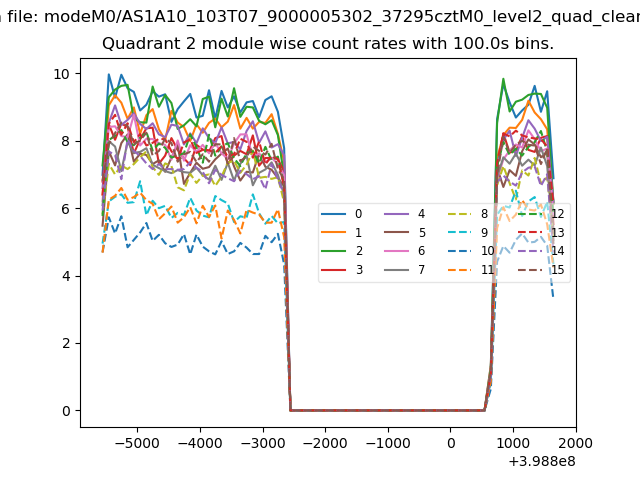
| Module-wise count rates for Quadrant B Data is divided into 100 sec bins |
 |
 |
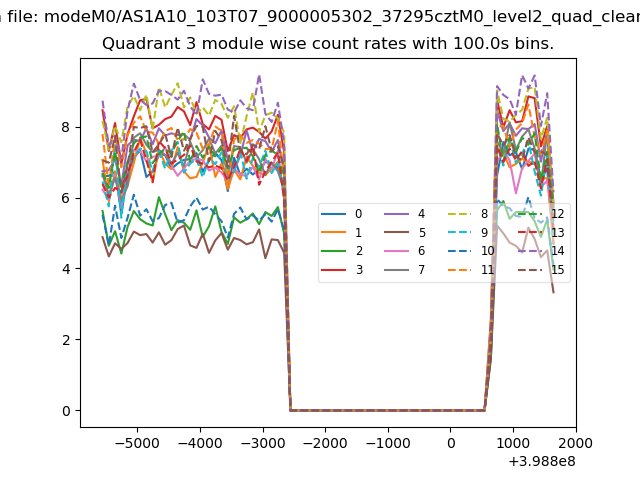
| Module-wise count rates for Quadrant C Data is divided into 100 sec bins |
 |
 |
| Module-wise count rates for Quadrant D Data is divided into 100 sec bins |
 |
 |
| Parameter | Plot |
|---|---|
| CZT HV Monitor | 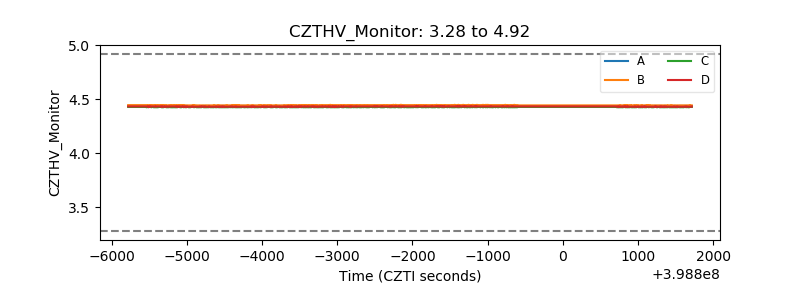 |
| D_VDD | 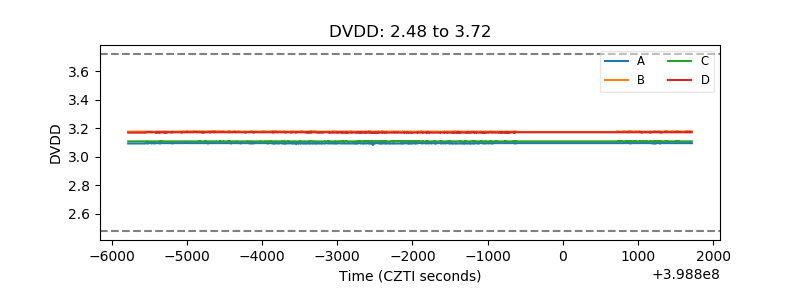 |
| Temperature 1 | 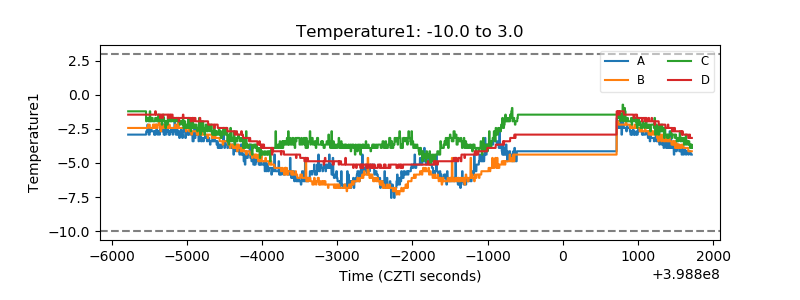 |
| Veto HV Monitor | 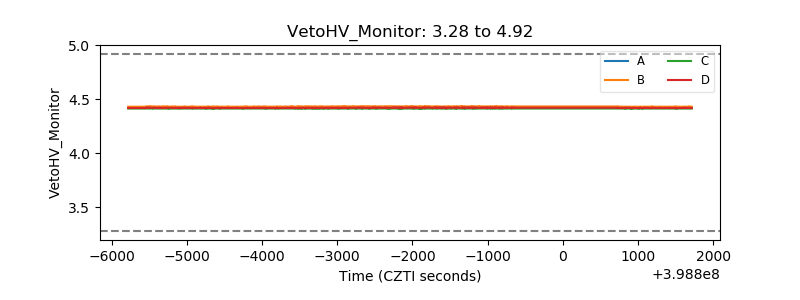 |
| Veto LLD | 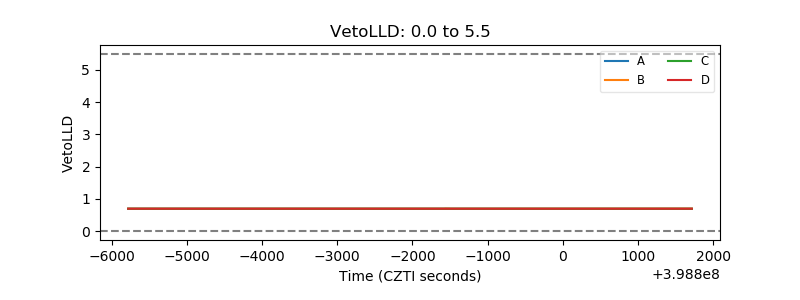 |
| Alpha Counter | 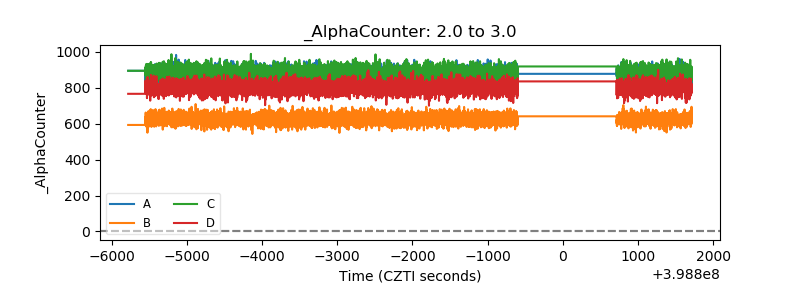 |
| _CPM_Rate | 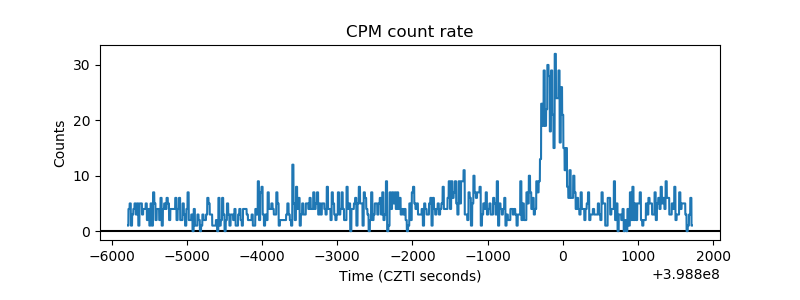 |
| CZT Counter | 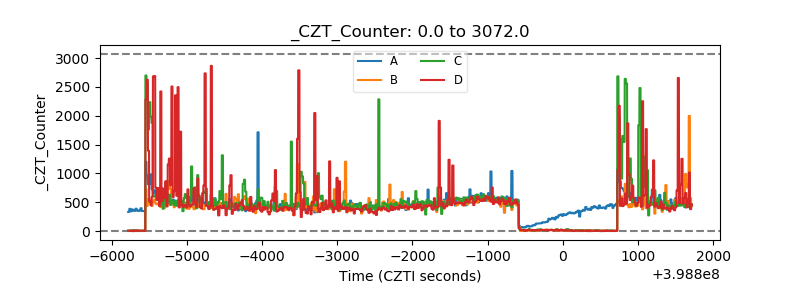 |
| +2.5 Volts monitor | 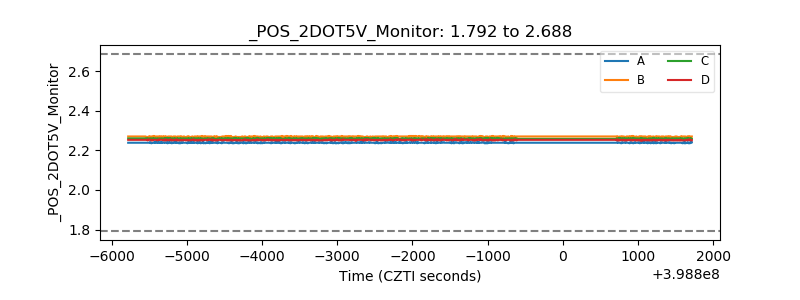 |
| +5 Volts monitor | 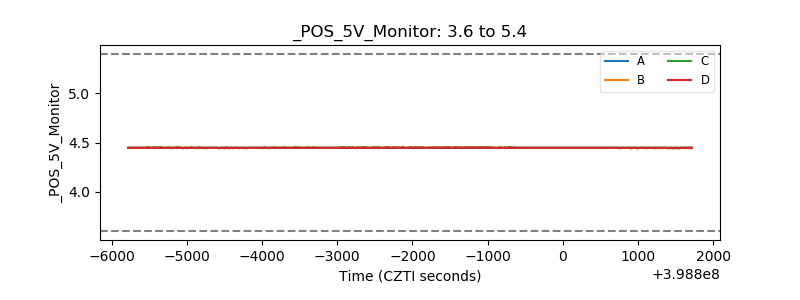 |
| _ROLL_ROT | 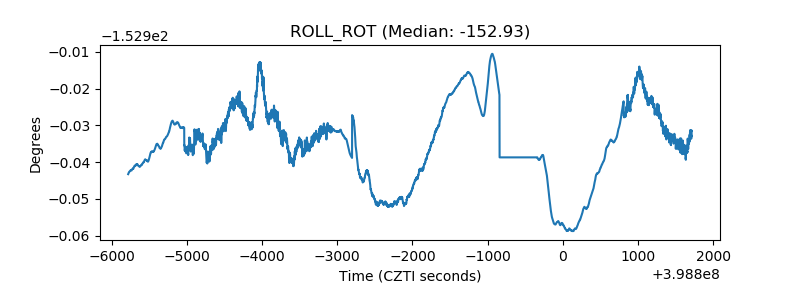 |
| _Roll_DEC | 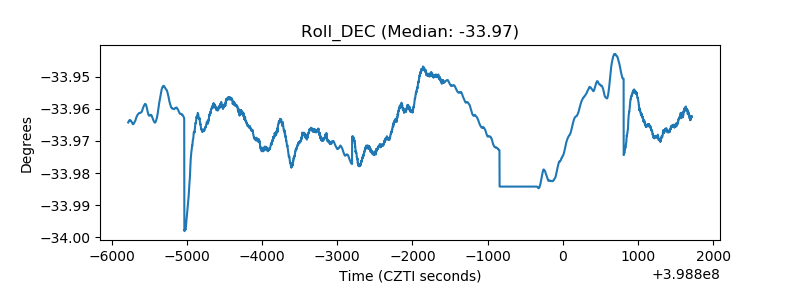 |
| _Roll_RA | 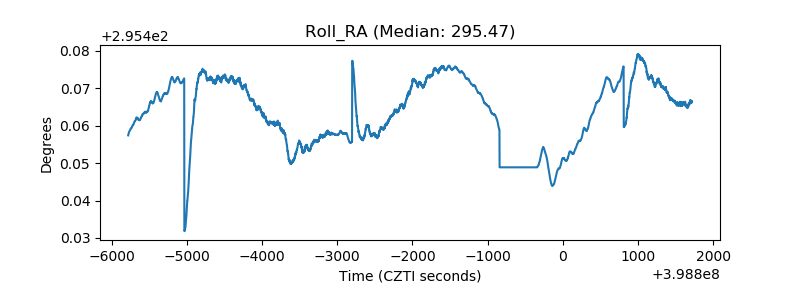 |
| Veto Counter | 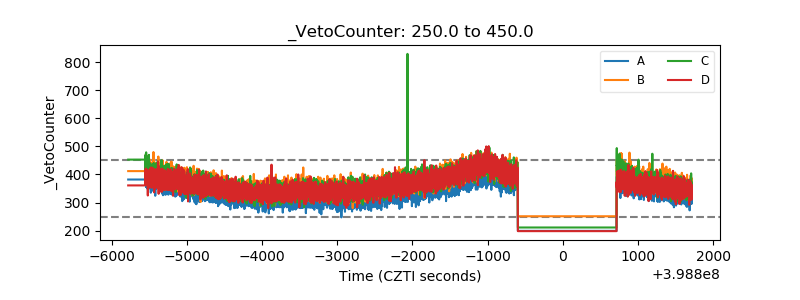 |