| Param | Original file | Final file |
|---|---|---|
| Filename | modeM0/AS1A10_103T07_9000005302_37297cztM0_level2.evt | modeM0/AS1A10_103T07_9000005302_37297cztM0_level2_quad_clean.evt |
| Size (bytes) | 755,352,000 | 123,298,560 |
| Size | 720.4 MB | 117.6 MB |
| Events in quadrant A | 5,219,267 | 753,978 |
| Events in quadrant B | 5,120,643 | 763,885 |
| Events in quadrant C | 5,998,256 | 753,313 |
| Events in quadrant D | 5,814,244 | 723,019 |
| Mode M0 | |||
|---|---|---|---|
| Quadrant | BADHDUFLAG | Total packets | Discarded packets |
| A | 0 | 22448 | 4 |
| B | 0 | 22372 | 3 |
| C | 0 | 24643 | 3 |
| D | 0 | 24885 | 3 |
| Mode M9 | |||
|---|---|---|---|
| Quadrant | BADHDUFLAG | Total packets | Discarded packets |
| A | 0 | 38 | 0 |
| B | 0 | 38 | 0 |
| C | 0 | 38 | 0 |
| D | 0 | 39 | 0 |
| Mode SS | |||
|---|---|---|---|
| Quadrant | BADHDUFLAG | Total packets | Discarded packets |
| A | 0 | 218 | 0 |
| B | 0 | 218 | 0 |
| C | 0 | 218 | 0 |
| D | 0 | 218 | 0 |
| Quadrant | Total seconds | Saturated seconds | Saturation percentage |
|---|---|---|---|
| A | 10681 | 24 | 0.224698% |
| B | 10681 | 29 | 0.271510% |
| C | 10681 | 189 | 1.769497% |
| D | 10681 | 169 | 1.582249% |
Noise dominated data is calculated using 1-second bins in cleaned event files. If a bin has >2000 counts, and if more than 50% of those come from <1% of pixels, then it is considered to be noise-dominated and hence unusable.
| Quadrant | # 1 sec bins | Bins with >0 counts | Bins with >2000 counts | High rate bins dominated by noise | Noise dominated (total time) | Noise dominated (detector-on time) | Marked lightcurve |
|---|---|---|---|---|---|---|---|
| A | 13518 | 10683 | 11 | 11 | 0.08% | 0.10% | 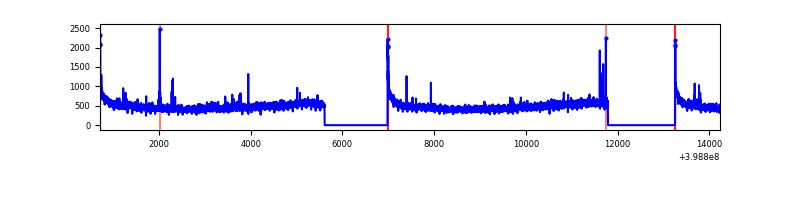 |
| B | 13518 | 10683 | 8 | 8 | 0.06% | 0.07% |  |
| C | 13518 | 10683 | 169 | 169 | 1.25% | 1.58% | 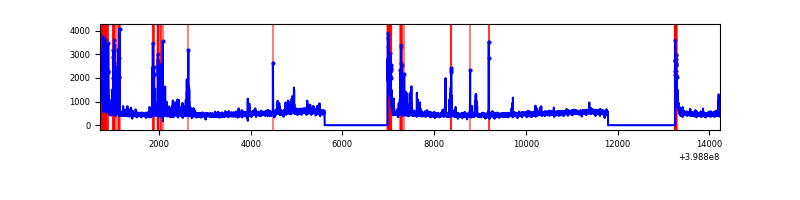 |
| D | 13518 | 10683 | 162 | 162 | 1.20% | 1.52% | 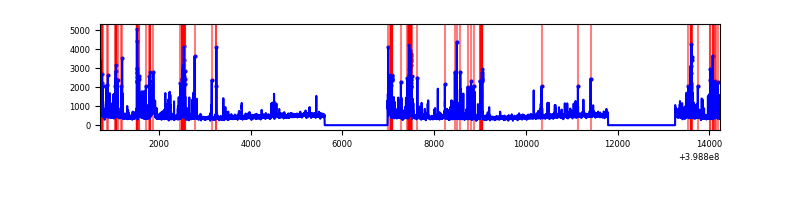 |
Top three noisy pixels from each quadrant. If the there are fewer than three noisy pixels in the level2.evt file, extra rows are filled as -1
| Pixel properties | Quadrant properties | ||||||
|---|---|---|---|---|---|---|---|
| Quadrant | DetID | PixID | Counts | Sigma | Mean | Median | Sigma |
| A | 10 | 83 | 478253 | 1983.92 | 1191 | 1166 | 240.5 |
| A | 6 | 10 | 55645 | 226.54 | 1191 | 1166 | 240.5 |
| A | 13 | 248 | 37995 | 153.15 | 1191 | 1166 | 240.5 |
| B | 0 | 213 | 232248 | 1010.97 | 1190 | 1157 | 228.6 |
| B | 0 | 221 | 135555 | 587.96 | 1190 | 1157 | 228.6 |
| B | 12 | 111 | 29153 | 122.48 | 1190 | 1157 | 228.6 |
| C | 1 | 23 | 682358 | 2531.02 | 1157 | 1165 | 269.1 |
| C | 15 | 214 | 442487 | 1639.77 | 1157 | 1165 | 269.1 |
| C | 0 | 10 | 337095 | 1248.17 | 1157 | 1165 | 269.1 |
| D | 2 | 249 | 301112 | 1068.93 | 1154 | 1123 | 280.6 |
| D | 12 | 227 | 267388 | 948.76 | 1154 | 1123 | 280.6 |
| D | 2 | 153 | 205172 | 727.07 | 1154 | 1123 | 280.6 |
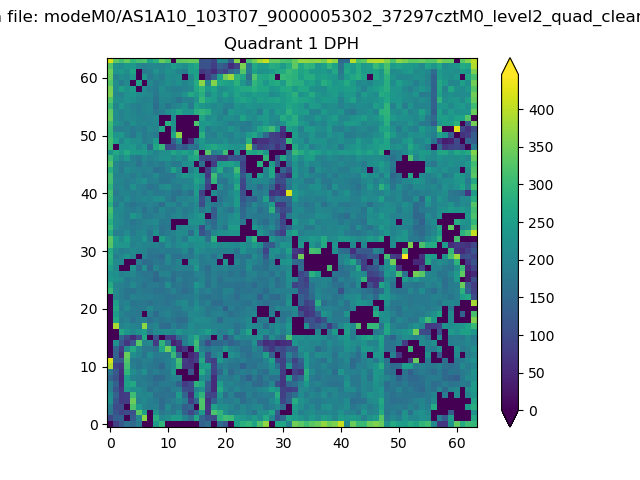
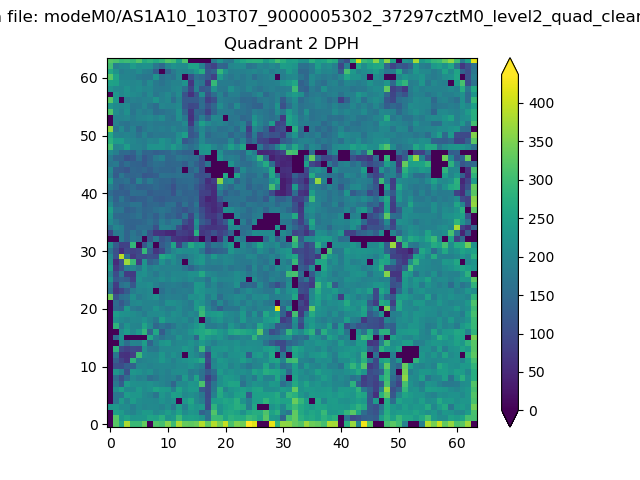
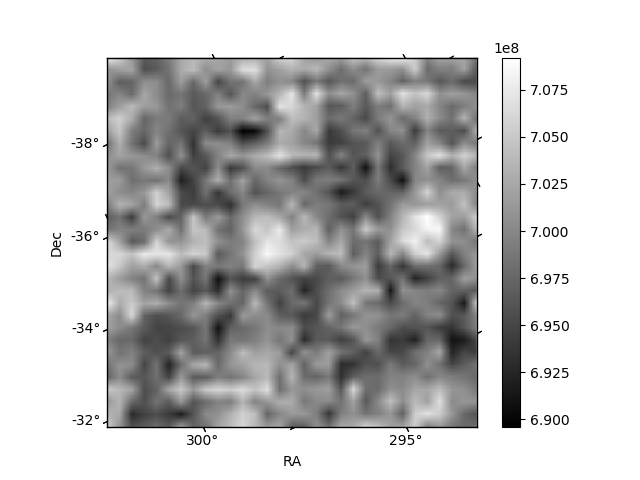
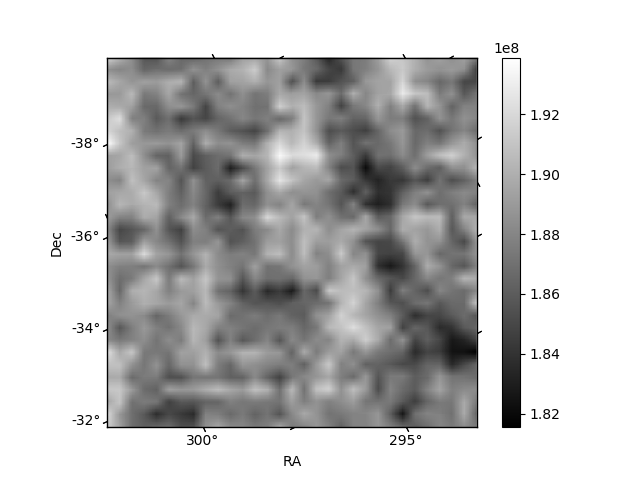
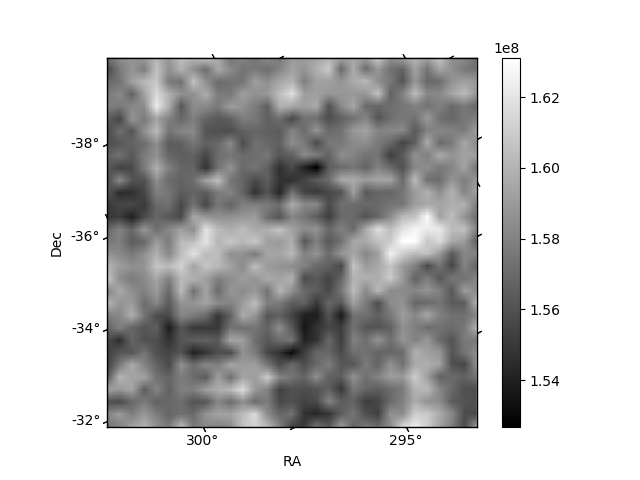
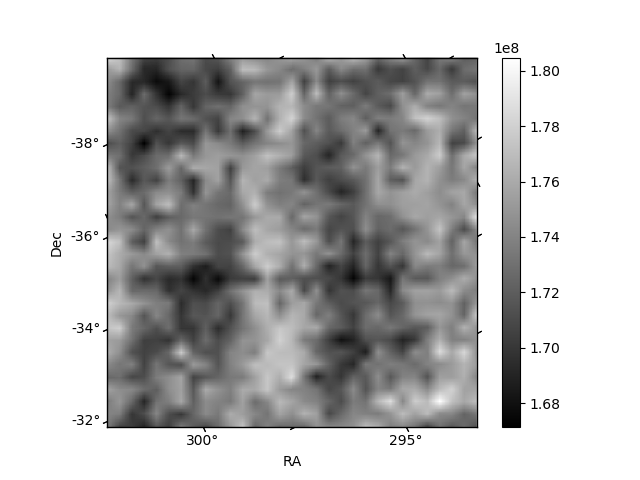
Histogram calculated using DETX and DETY for each event in the final _common_clean file
| Quadrant A | 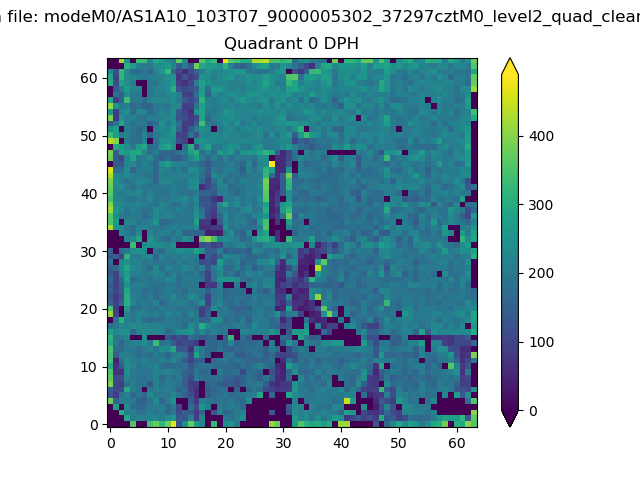 |
 |
Quadrant B |
|---|---|---|---|
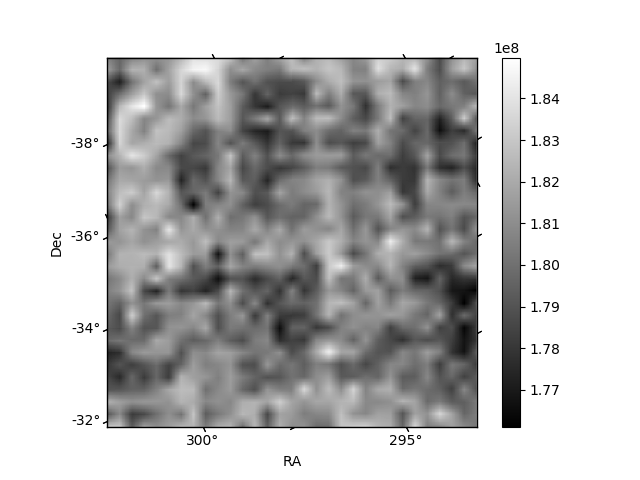
| Quadrant D | 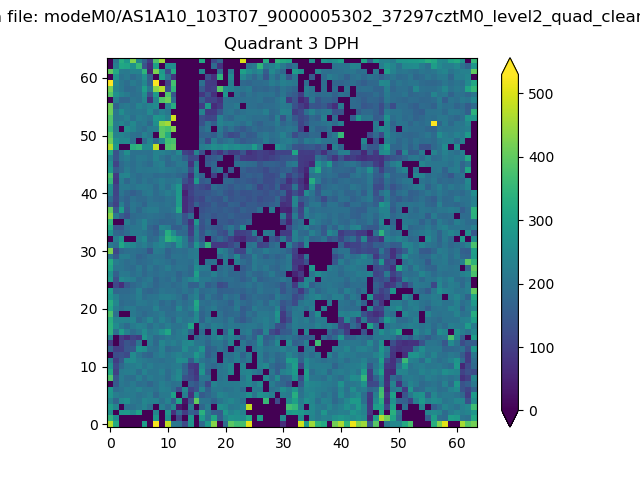 |
 |
Quadrant C |
| Plot type | Count rate plots | Images |
|---|---|---|
| Comparison with Poisson distribution Blue bars denote a histogram of data divided into 1 sec bins. Red curve is a Poisson curve with rate = median count rate of data. |
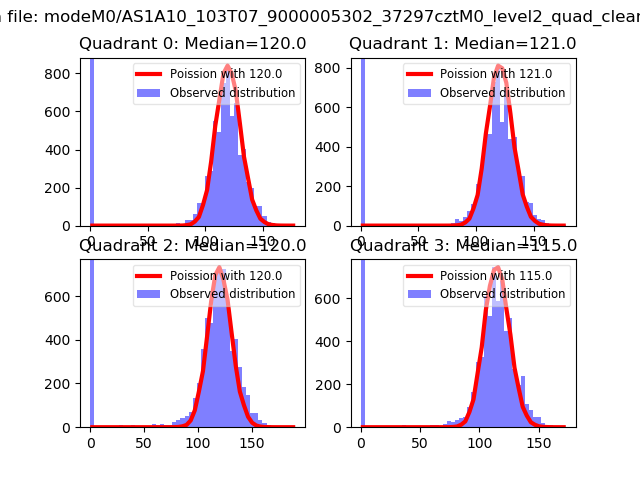 |
 |
| Quadrant-wise count rates Data is divided into 100 sec bins |
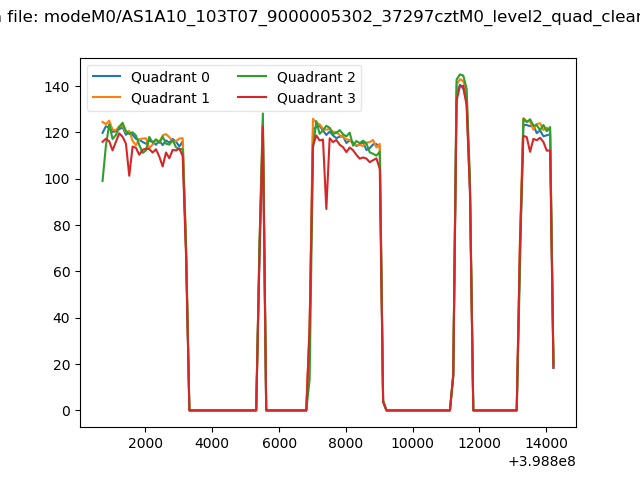 |
|
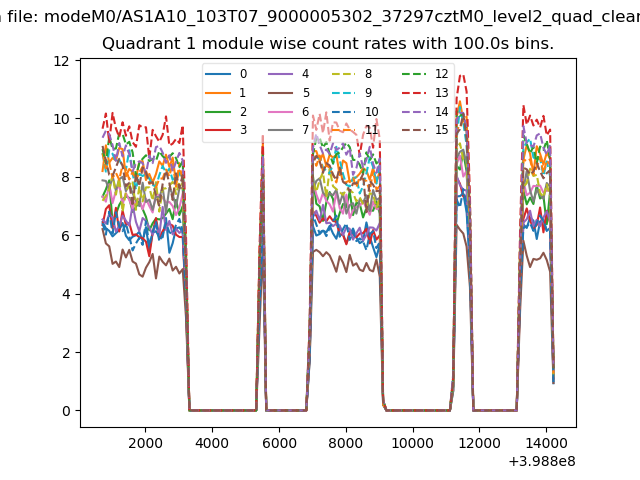
| Module-wise count rates for Quadrant A Data is divided into 100 sec bins |
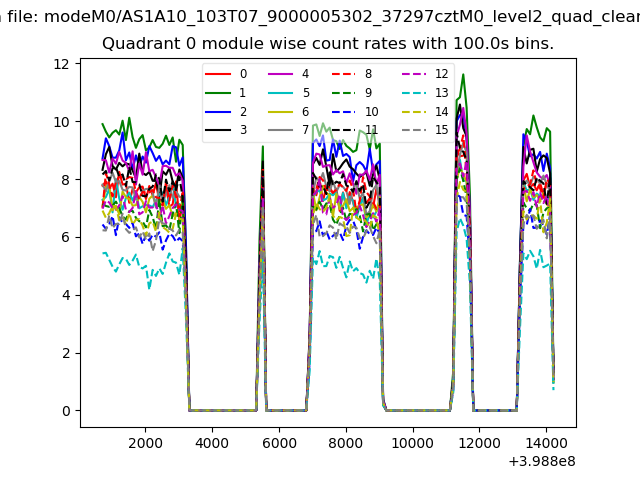 |
 |
| Module-wise count rates for Quadrant B Data is divided into 100 sec bins |
 |
 |
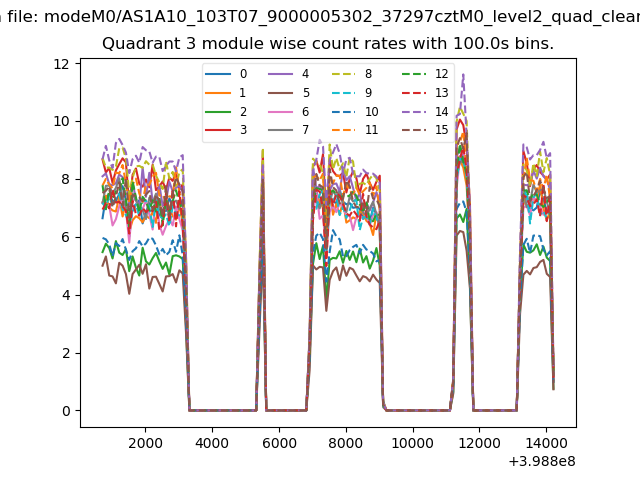
| Module-wise count rates for Quadrant C Data is divided into 100 sec bins |
 |
 |
| Module-wise count rates for Quadrant D Data is divided into 100 sec bins |
 |
 |
| Parameter | Plot |
|---|---|
| CZT HV Monitor | 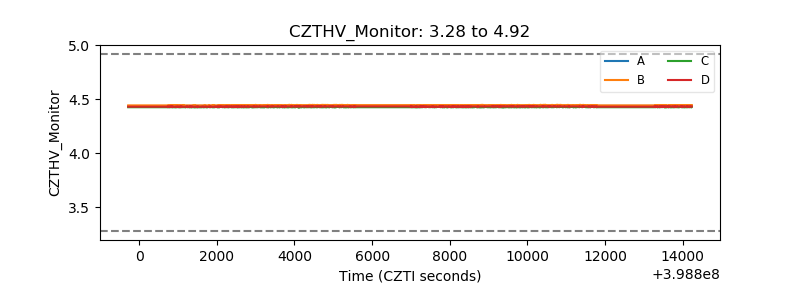 |
| D_VDD | 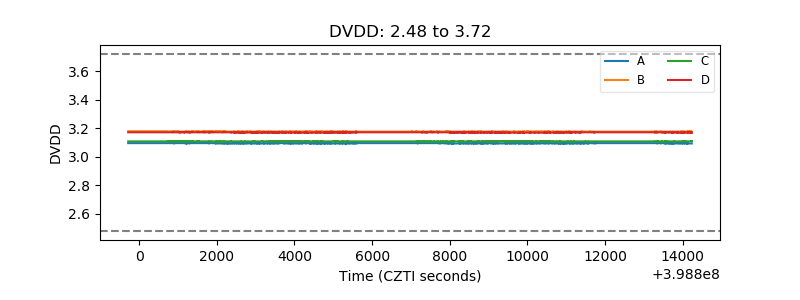 |
| Temperature 1 | 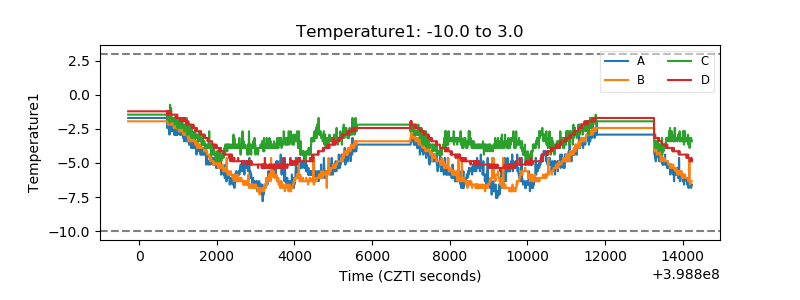 |
| Veto HV Monitor | 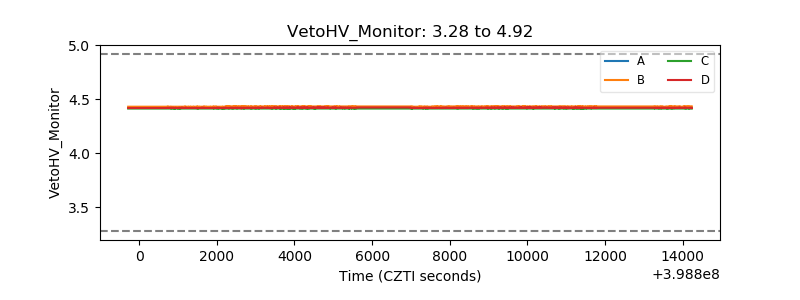 |
| Veto LLD | 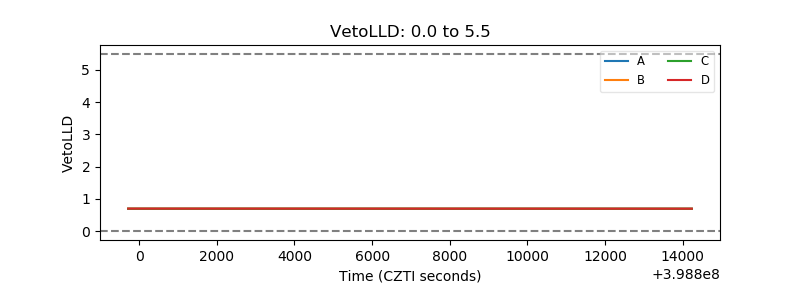 |
| Alpha Counter | 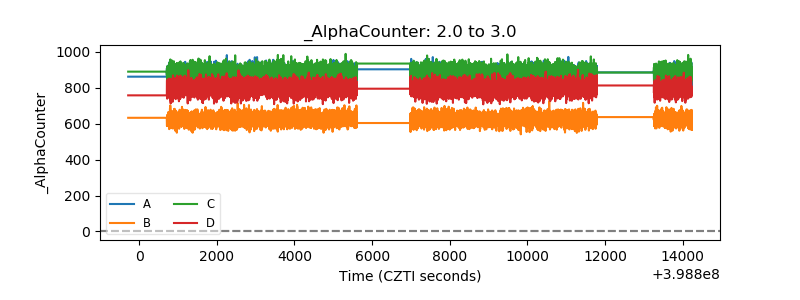 |
| _CPM_Rate | 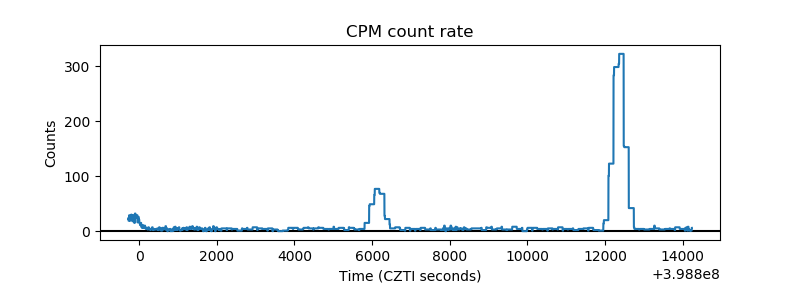 |
| CZT Counter | 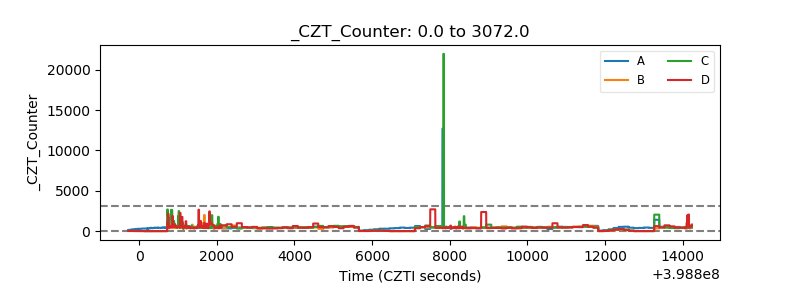 |
| +2.5 Volts monitor | 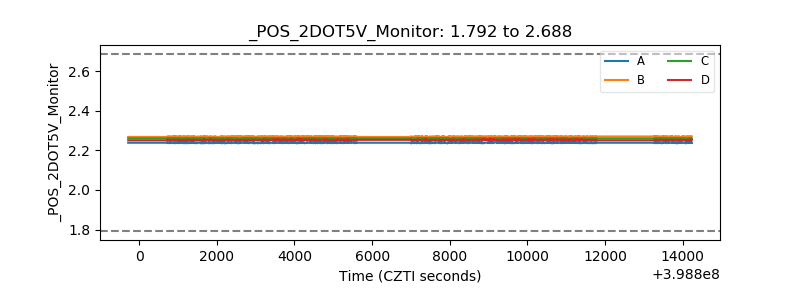 |
| +5 Volts monitor | 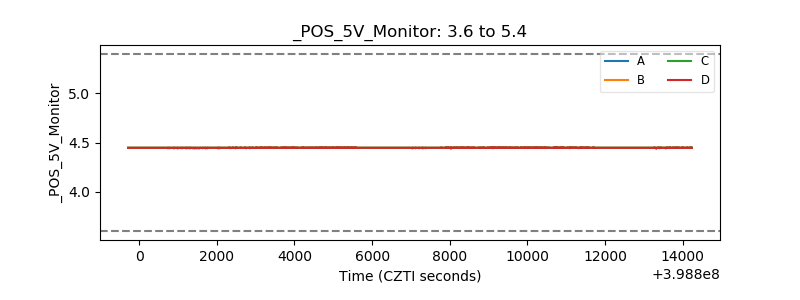 |
| _ROLL_ROT | 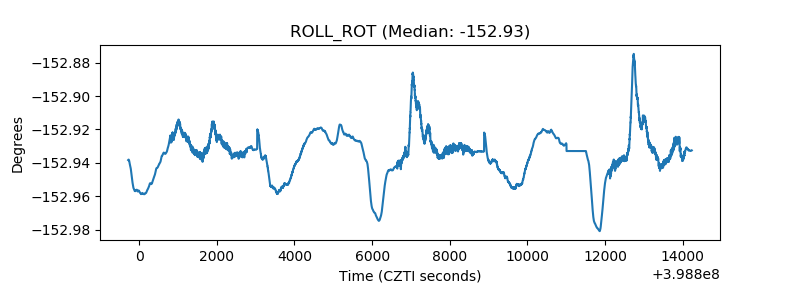 |
| _Roll_DEC | 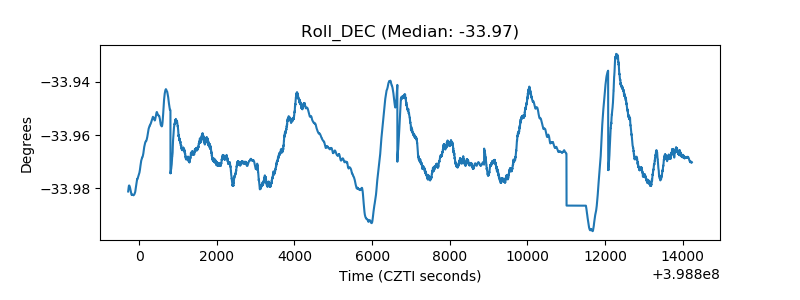 |
| _Roll_RA | 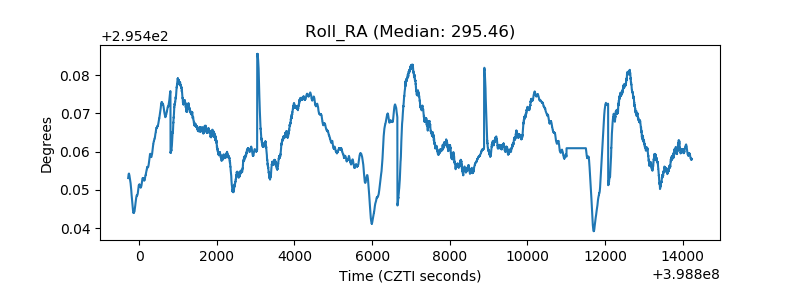 |
| Veto Counter | 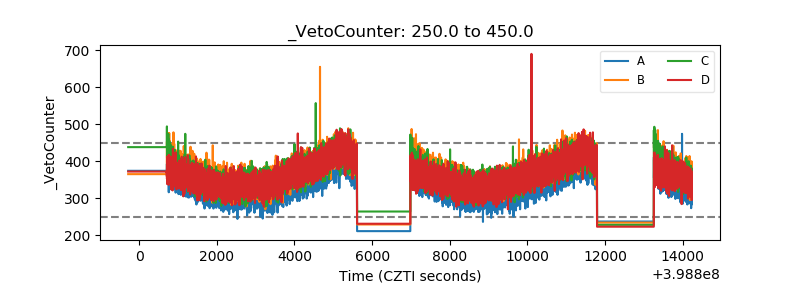 |