| Param | Original file | Final file |
|---|---|---|
| Filename | modeM0/AS1A10_103T07_9000005302_37298cztM0_level2.evt | modeM0/AS1A10_103T07_9000005302_37298cztM0_level2_quad_clean.evt |
| Size (bytes) | 392,434,560 | 70,122,240 |
| Size | 374.3 MB | 66.9 MB |
| Events in quadrant A | 2,823,701 | 431,391 |
| Events in quadrant B | 2,791,786 | 439,779 |
| Events in quadrant C | 2,891,766 | 438,780 |
| Events in quadrant D | 2,990,590 | 415,427 |
| Mode M0 | |||
|---|---|---|---|
| Quadrant | BADHDUFLAG | Total packets | Discarded packets |
| A | 0 | 12173 | 3 |
| B | 0 | 12239 | 2 |
| C | 0 | 12097 | 2 |
| D | 0 | 12990 | 2 |
| Mode M9 | |||
|---|---|---|---|
| Quadrant | BADHDUFLAG | Total packets | Discarded packets |
| A | 0 | 28 | 0 |
| B | 0 | 28 | 0 |
| C | 0 | 28 | 0 |
| D | 0 | 29 | 0 |
| Mode SS | |||
|---|---|---|---|
| Quadrant | BADHDUFLAG | Total packets | Discarded packets |
| A | 0 | 116 | 0 |
| B | 0 | 116 | 0 |
| C | 0 | 116 | 0 |
| D | 0 | 116 | 0 |
| Quadrant | Total seconds | Saturated seconds | Saturation percentage |
|---|---|---|---|
| A | 5687 | 26 | 0.457183% |
| B | 5687 | 34 | 0.597855% |
| C | 5687 | 35 | 0.615439% |
| D | 5687 | 65 | 1.142958% |
Noise dominated data is calculated using 1-second bins in cleaned event files. If a bin has >2000 counts, and if more than 50% of those come from <1% of pixels, then it is considered to be noise-dominated and hence unusable.
| Quadrant | # 1 sec bins | Bins with >0 counts | Bins with >2000 counts | High rate bins dominated by noise | Noise dominated (total time) | Noise dominated (detector-on time) | Marked lightcurve |
|---|---|---|---|---|---|---|---|
| A | 7270 | 5688 | 14 | 14 | 0.19% | 0.25% | 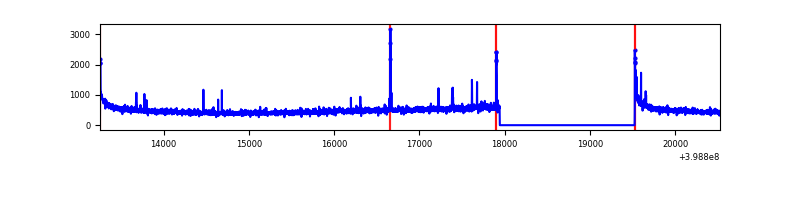 |
| B | 7270 | 5688 | 10 | 10 | 0.14% | 0.18% | 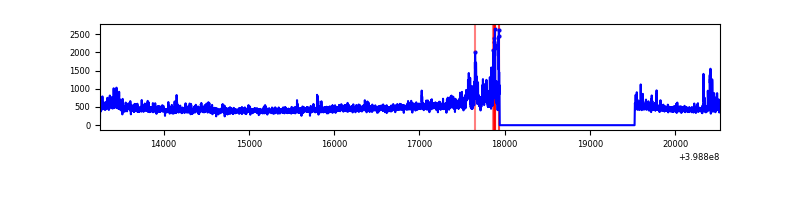 |
| C | 7270 | 5688 | 26 | 26 | 0.36% | 0.46% | 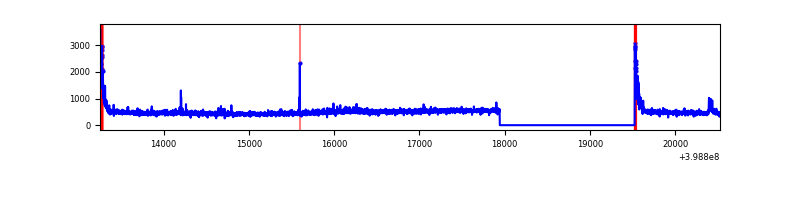 |
| D | 7270 | 5688 | 58 | 58 | 0.80% | 1.02% | 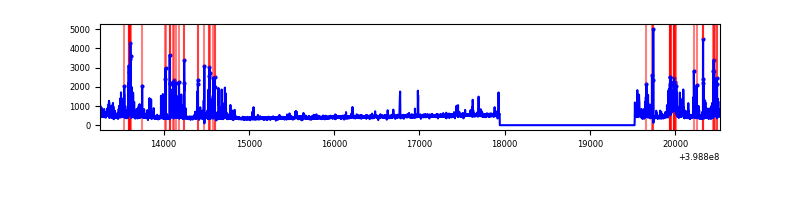 |
Top three noisy pixels from each quadrant. If the there are fewer than three noisy pixels in the level2.evt file, extra rows are filled as -1
| Pixel properties | Quadrant properties | ||||||
|---|---|---|---|---|---|---|---|
| Quadrant | DetID | PixID | Counts | Sigma | Mean | Median | Sigma |
| A | 10 | 83 | 272759 | 2121.62 | 633 | 620 | 128.3 |
| A | 13 | 248 | 38474 | 295.11 | 633 | 620 | 128.3 |
| A | 15 | 223 | 20055 | 151.52 | 633 | 620 | 128.3 |
| B | 0 | 221 | 152931 | 1242.38 | 631 | 614 | 122.6 |
| B | 0 | 213 | 99894 | 809.78 | 631 | 614 | 122.6 |
| B | 4 | 232 | 31642 | 253.08 | 631 | 614 | 122.6 |
| C | 15 | 214 | 240215 | 1652.26 | 620 | 625 | 145.0 |
| C | 0 | 10 | 157565 | 1082.29 | 620 | 625 | 145.0 |
| C | 3 | 233 | 32393 | 219.08 | 620 | 625 | 145.0 |
| D | 2 | 153 | 287730 | 1907.11 | 615 | 597 | 150.6 |
| D | 10 | 199 | 121933 | 805.9 | 615 | 597 | 150.6 |
| D | 12 | 217 | 57562 | 378.35 | 615 | 597 | 150.6 |
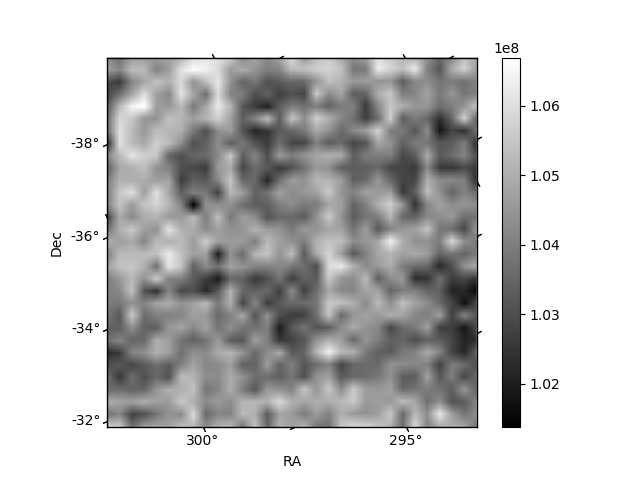
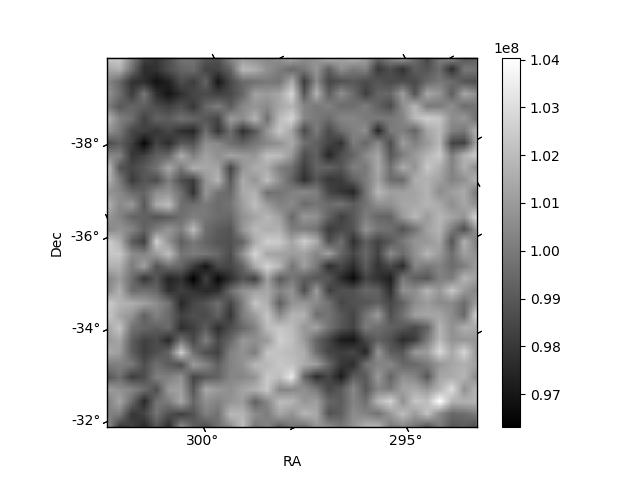
Histogram calculated using DETX and DETY for each event in the final _common_clean file
| Quadrant A | 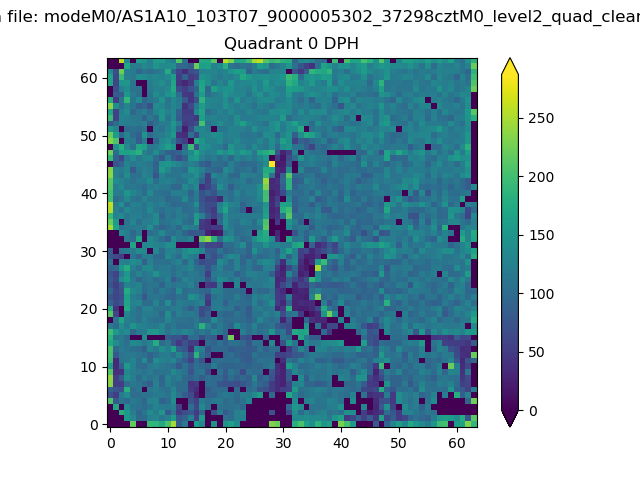 |
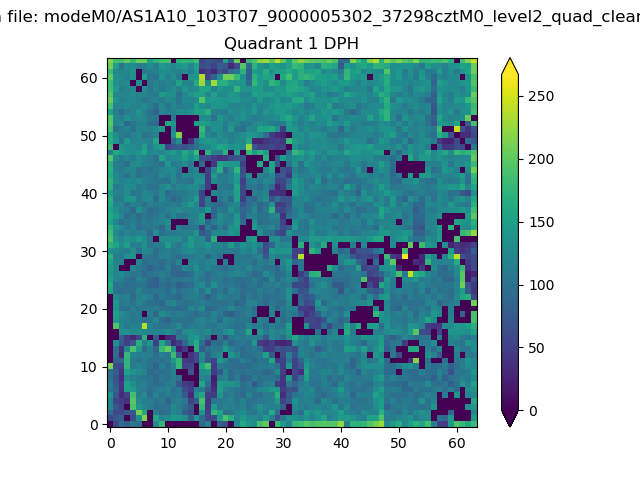 |
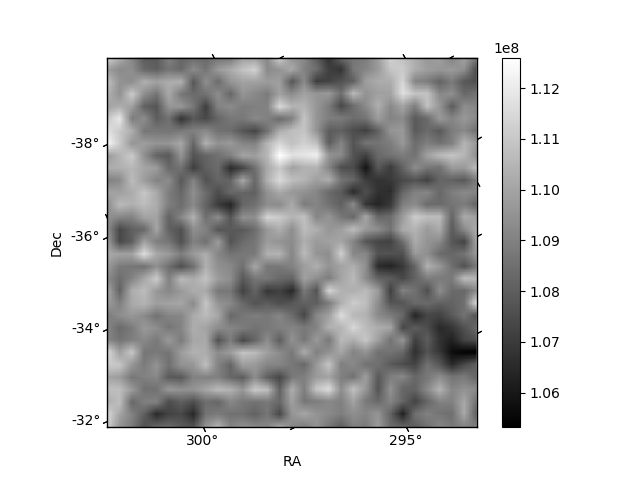
Quadrant B |
|---|---|---|---|
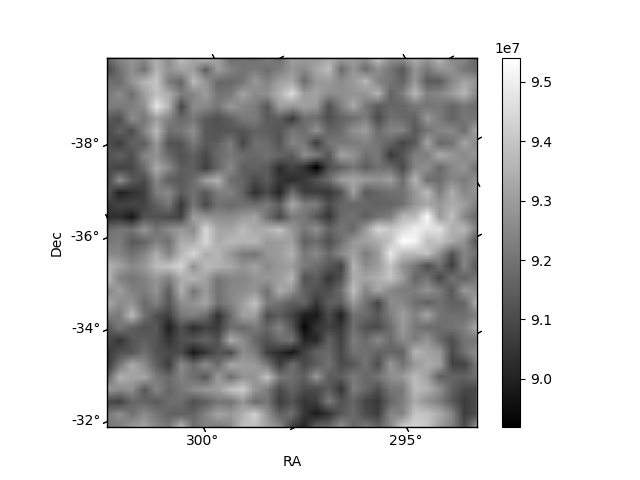
| Quadrant D |  |
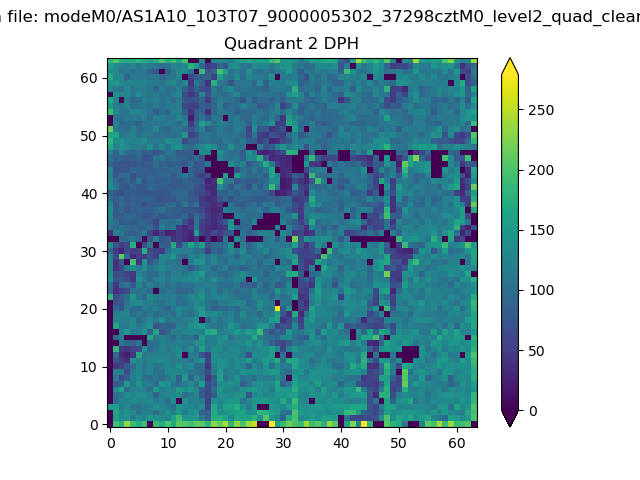 |
Quadrant C |
| Plot type | Count rate plots | Images |
|---|---|---|
| Comparison with Poisson distribution Blue bars denote a histogram of data divided into 1 sec bins. Red curve is a Poisson curve with rate = median count rate of data. |
 |
 |
| Quadrant-wise count rates Data is divided into 100 sec bins |
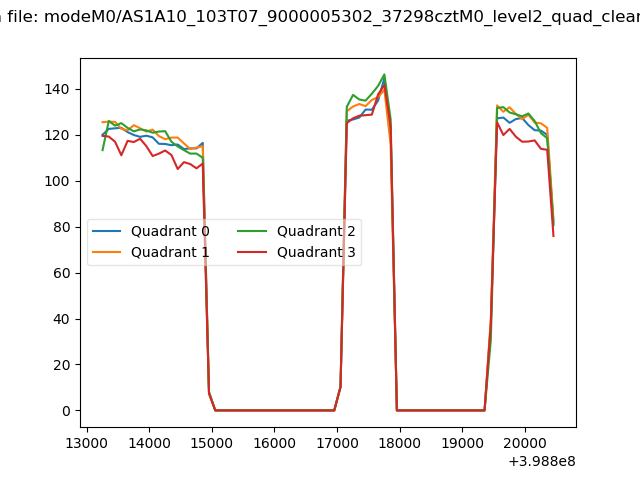 |
|
| Module-wise count rates for Quadrant A Data is divided into 100 sec bins |
 |
 |
| Module-wise count rates for Quadrant B Data is divided into 100 sec bins |
 |
 |
| Module-wise count rates for Quadrant C Data is divided into 100 sec bins |
 |
 |
| Module-wise count rates for Quadrant D Data is divided into 100 sec bins |
 |
 |
| Parameter | Plot |
|---|---|
| CZT HV Monitor |  |
| D_VDD | 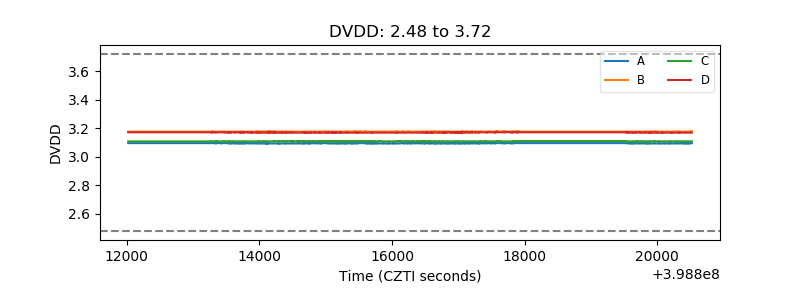 |
| Temperature 1 | 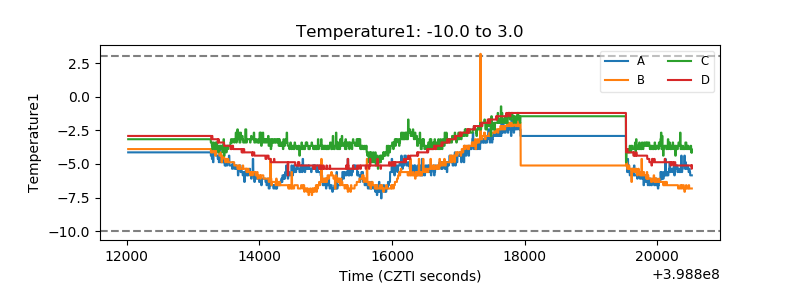 |
| Veto HV Monitor | 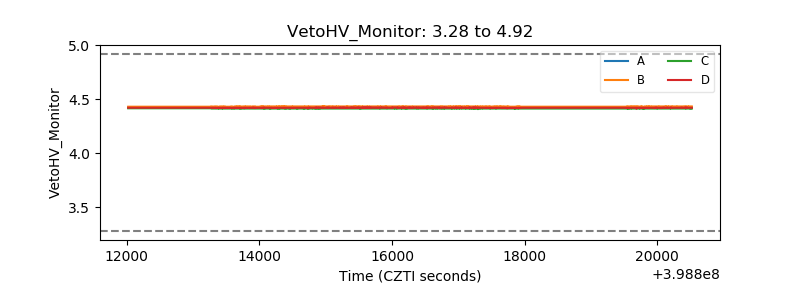 |
| Veto LLD | 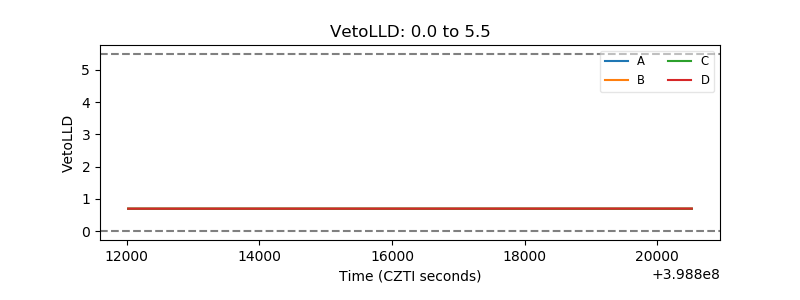 |
| Alpha Counter | 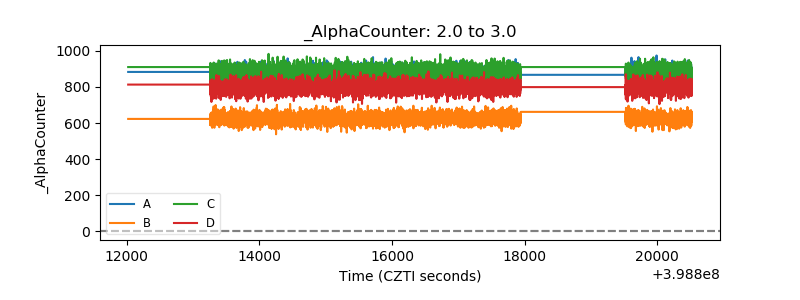 |
| _CPM_Rate | 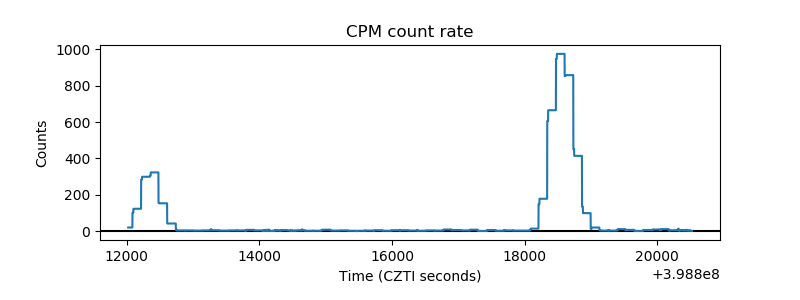 |
| CZT Counter | 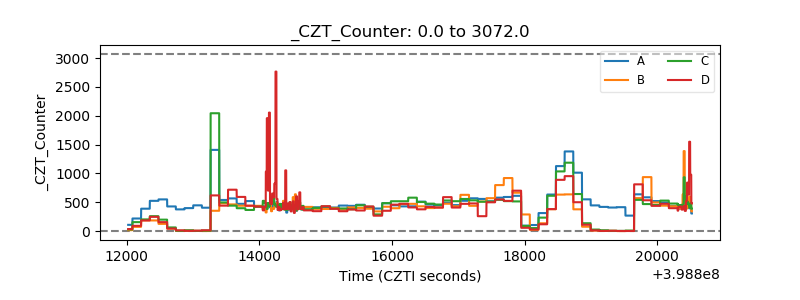 |
| +2.5 Volts monitor | 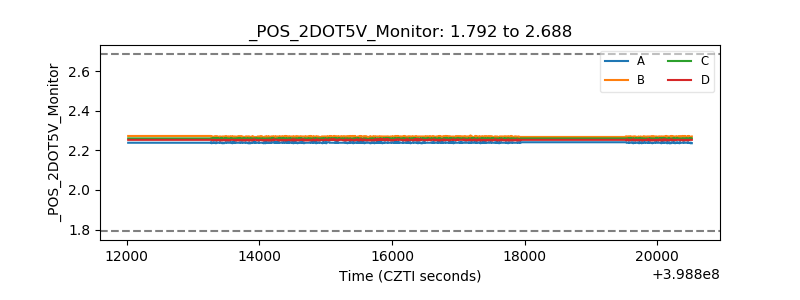 |
| +5 Volts monitor |  |
| _ROLL_ROT |  |
| _Roll_DEC | 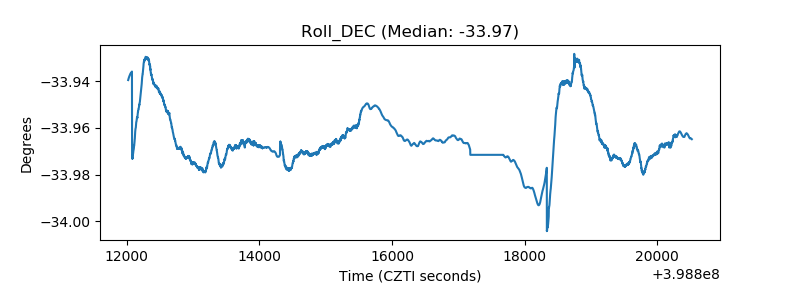 |
| _Roll_RA | 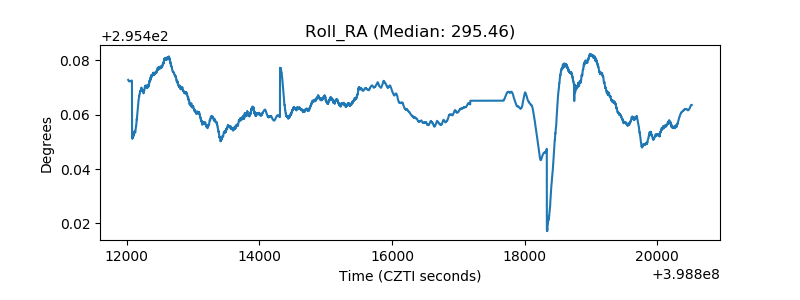 |
| Veto Counter |  |