| Param | Original file | Final file |
|---|---|---|
| Filename | modeM0/AS1A10_103T07_9000005302_37299cztM0_level2.evt | modeM0/AS1A10_103T07_9000005302_37299cztM0_level2_quad_clean.evt |
| Size (bytes) | 438,298,560 | 72,025,920 |
| Size | 418.0 MB | 68.7 MB |
| Events in quadrant A | 2,898,596 | 444,174 |
| Events in quadrant B | 2,938,785 | 454,743 |
| Events in quadrant C | 3,039,026 | 452,888 |
| Events in quadrant D | 4,003,382 | 423,943 |
| Mode M0 | |||
|---|---|---|---|
| Quadrant | BADHDUFLAG | Total packets | Discarded packets |
| A | 0 | 12381 | 3 |
| B | 0 | 12543 | 2 |
| C | 0 | 12414 | 2 |
| D | 0 | 15914 | 2 |
| Mode M9 | |||
|---|---|---|---|
| Quadrant | BADHDUFLAG | Total packets | Discarded packets |
| A | 0 | 33 | 0 |
| B | 0 | 33 | 0 |
| C | 0 | 33 | 0 |
| D | 0 | 33 | 0 |
| Mode SS | |||
|---|---|---|---|
| Quadrant | BADHDUFLAG | Total packets | Discarded packets |
| A | 0 | 120 | 0 |
| B | 0 | 120 | 0 |
| C | 0 | 120 | 0 |
| D | 0 | 120 | 0 |
| Quadrant | Total seconds | Saturated seconds | Saturation percentage |
|---|---|---|---|
| A | 5796 | 26 | 0.448585% |
| B | 5796 | 25 | 0.431332% |
| C | 5796 | 70 | 1.207729% |
| D | 5796 | 398 | 6.866805% |
Noise dominated data is calculated using 1-second bins in cleaned event files. If a bin has >2000 counts, and if more than 50% of those come from <1% of pixels, then it is considered to be noise-dominated and hence unusable.
| Quadrant | # 1 sec bins | Bins with >0 counts | Bins with >2000 counts | High rate bins dominated by noise | Noise dominated (total time) | Noise dominated (detector-on time) | Marked lightcurve |
|---|---|---|---|---|---|---|---|
| A | 9113 | 5798 | 10 | 10 | 0.11% | 0.17% | 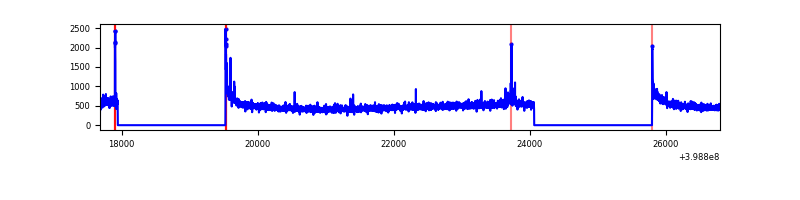 |
| B | 9113 | 5798 | 11 | 11 | 0.12% | 0.19% | 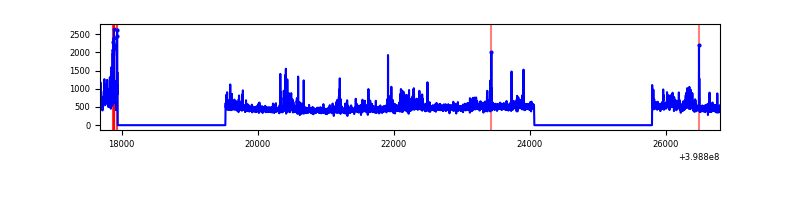 |
| C | 9113 | 5798 | 60 | 60 | 0.66% | 1.03% | 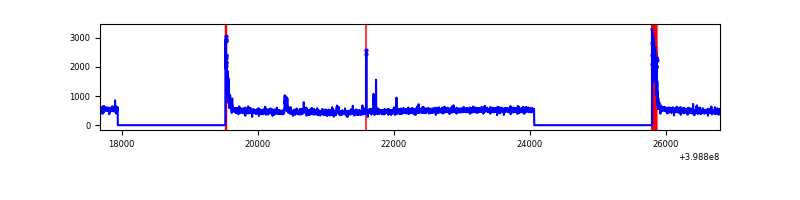 |
| D | 9113 | 5798 | 394 | 394 | 4.32% | 6.80% | 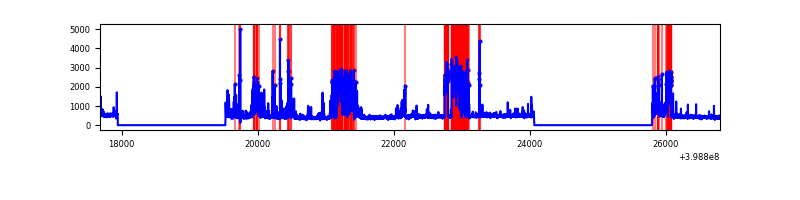 |
Top three noisy pixels from each quadrant. If the there are fewer than three noisy pixels in the level2.evt file, extra rows are filled as -1
| Pixel properties | Quadrant properties | ||||||
|---|---|---|---|---|---|---|---|
| Quadrant | DetID | PixID | Counts | Sigma | Mean | Median | Sigma |
| A | 10 | 83 | 272892 | 2047.64 | 658 | 645 | 133.0 |
| A | 6 | 10 | 22130 | 161.59 | 658 | 645 | 133.0 |
| A | 15 | 223 | 19743 | 143.64 | 658 | 645 | 133.0 |
| B | 0 | 213 | 82000 | 643.95 | 658 | 640 | 126.3 |
| B | 0 | 221 | 81985 | 643.84 | 658 | 640 | 126.3 |
| B | 12 | 18 | 80672 | 633.44 | 658 | 640 | 126.3 |
| C | 15 | 214 | 242943 | 1602.39 | 648 | 652 | 151.2 |
| C | 0 | 10 | 207376 | 1367.16 | 648 | 652 | 151.2 |
| C | 3 | 233 | 33559 | 217.63 | 648 | 652 | 151.2 |
| D | 10 | 253 | 1242067 | 8119.1 | 626 | 608 | 152.9 |
| D | 2 | 153 | 205274 | 1338.51 | 626 | 608 | 152.9 |
| D | 13 | 249 | 43519 | 280.64 | 626 | 608 | 152.9 |
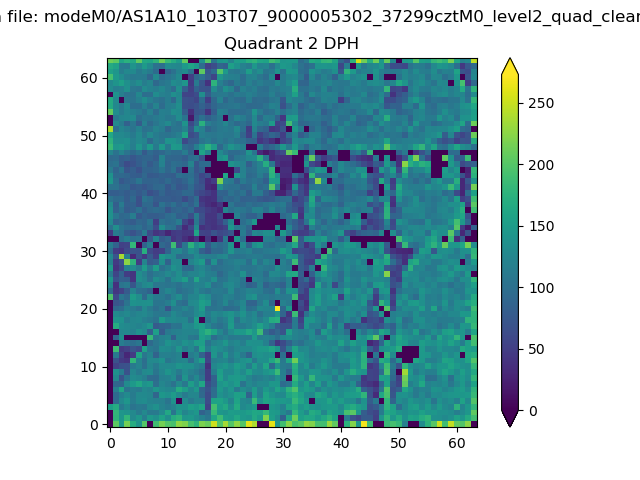
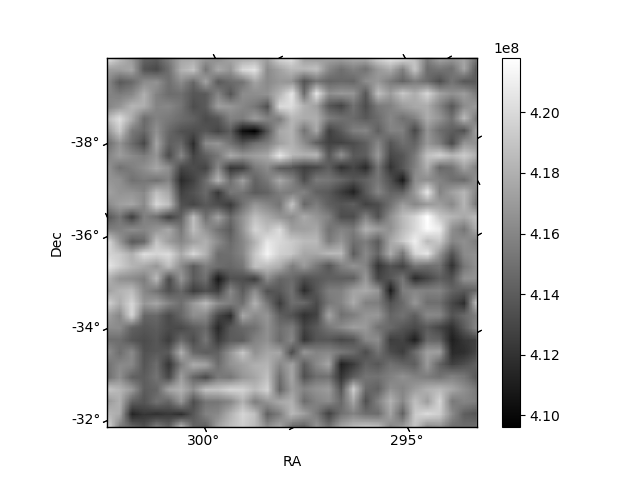
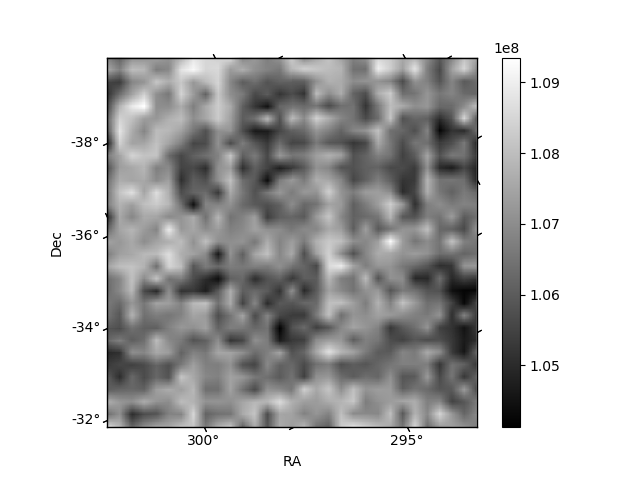
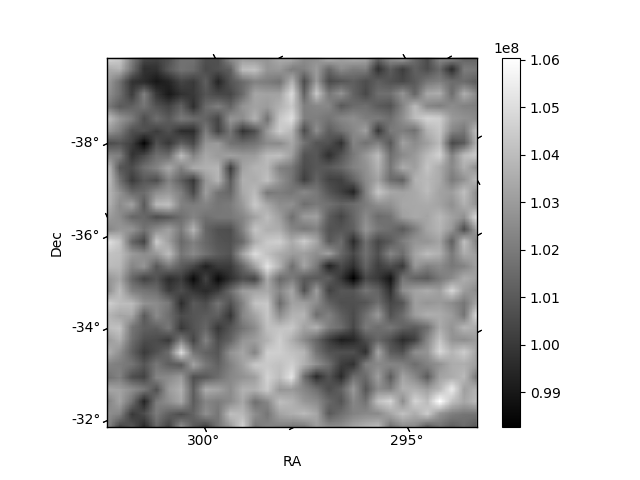
Histogram calculated using DETX and DETY for each event in the final _common_clean file
| Quadrant A | 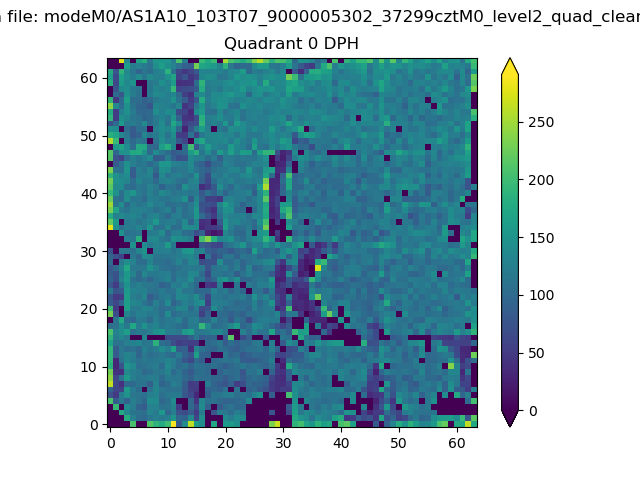 |
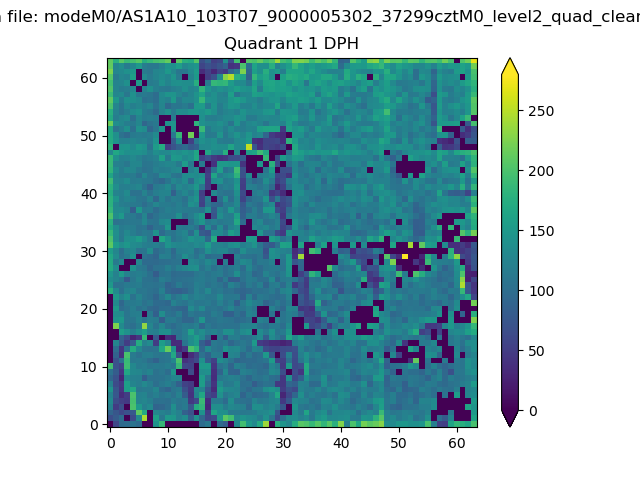 |
Quadrant B |
|---|---|---|---|
| Quadrant D | 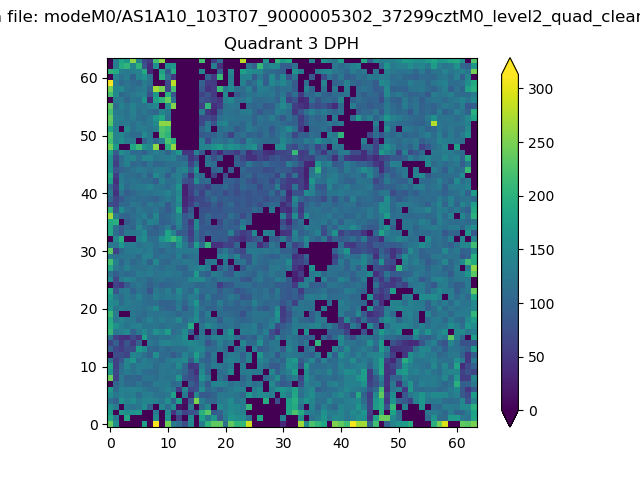 |
 |
Quadrant C |
| Plot type | Count rate plots | Images |
|---|---|---|
| Comparison with Poisson distribution Blue bars denote a histogram of data divided into 1 sec bins. Red curve is a Poisson curve with rate = median count rate of data. |
 |
 |
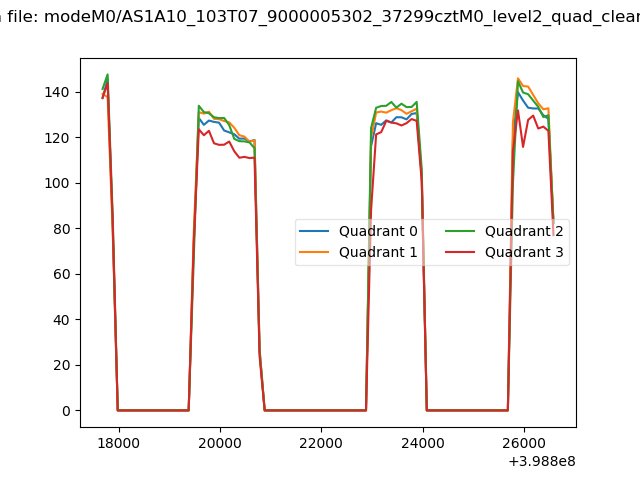
| Quadrant-wise count rates Data is divided into 100 sec bins |
 |
|
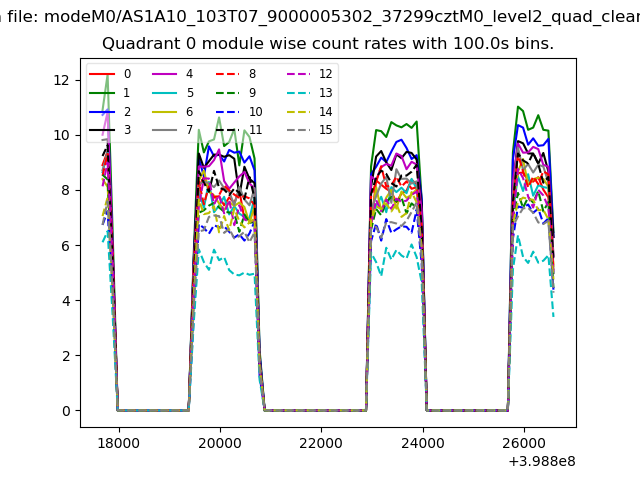
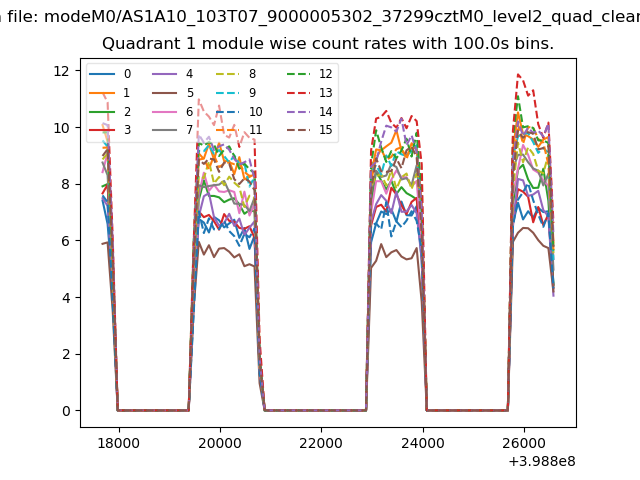
| Module-wise count rates for Quadrant A Data is divided into 100 sec bins |
 |
 |
| Module-wise count rates for Quadrant B Data is divided into 100 sec bins |
 |
 |
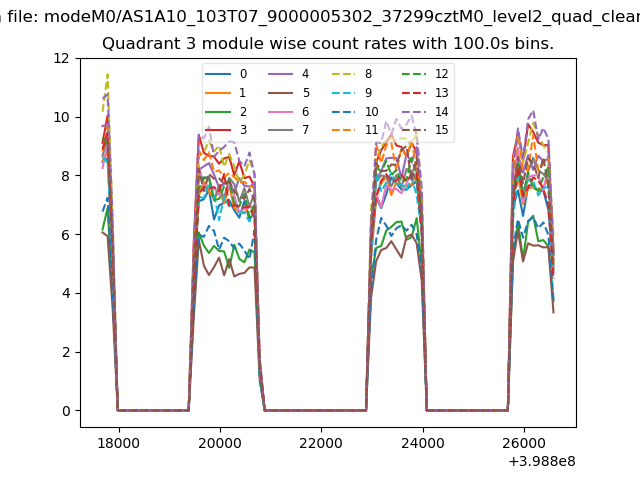
| Module-wise count rates for Quadrant C Data is divided into 100 sec bins |
 |
 |
| Module-wise count rates for Quadrant D Data is divided into 100 sec bins |
 |
 |
| Parameter | Plot |
|---|---|
| CZT HV Monitor |  |
| D_VDD | 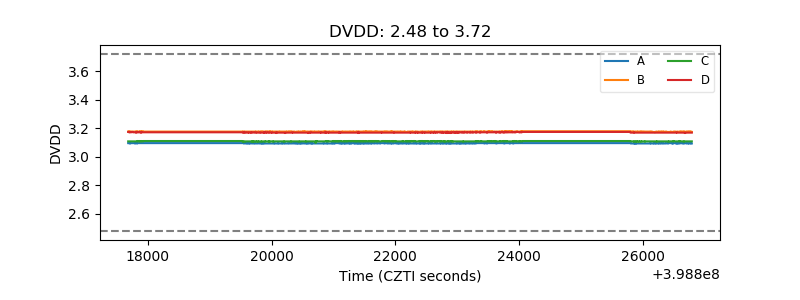 |
| Temperature 1 | 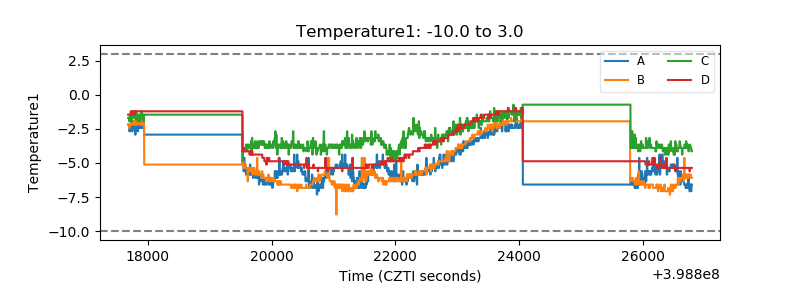 |
| Veto HV Monitor | 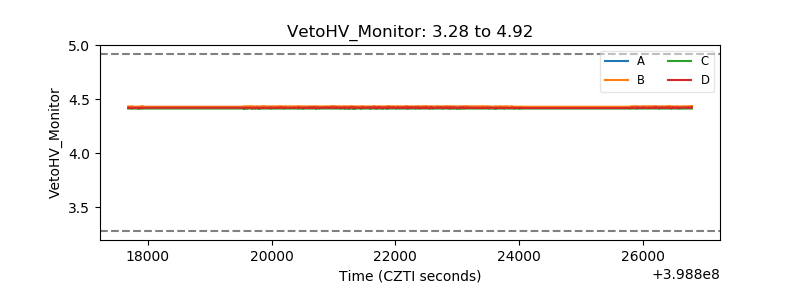 |
| Veto LLD | 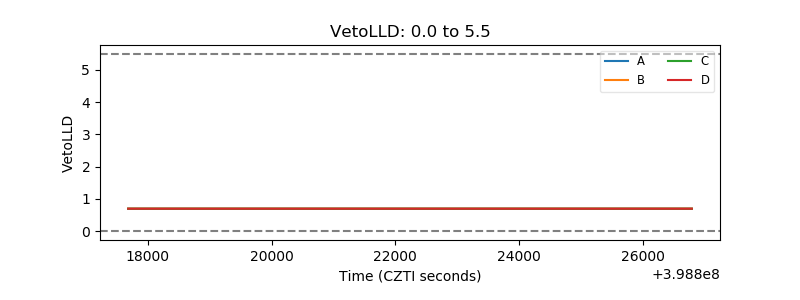 |
| Alpha Counter | 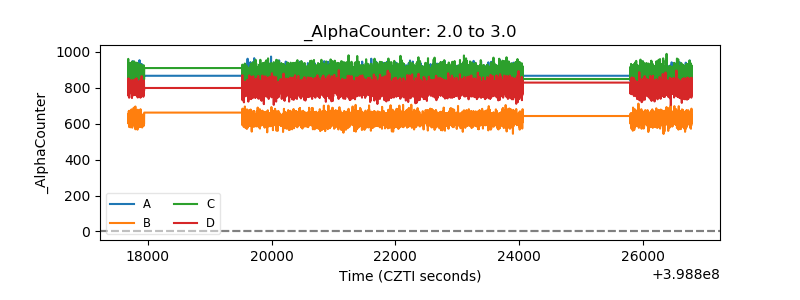 |
| _CPM_Rate | 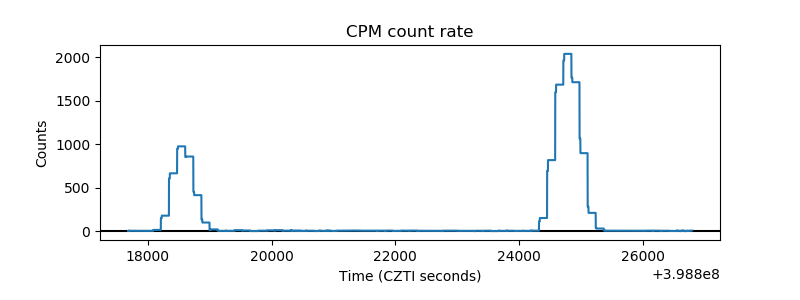 |
| CZT Counter | 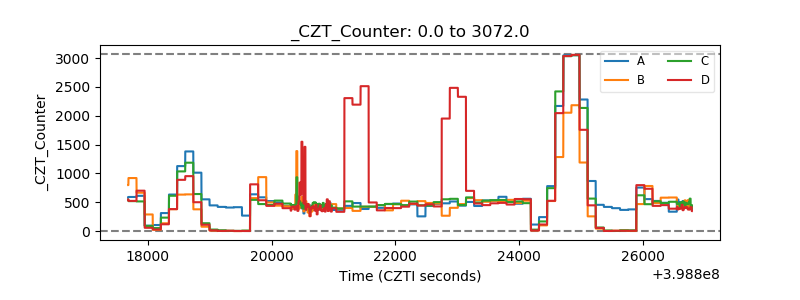 |
| +2.5 Volts monitor | 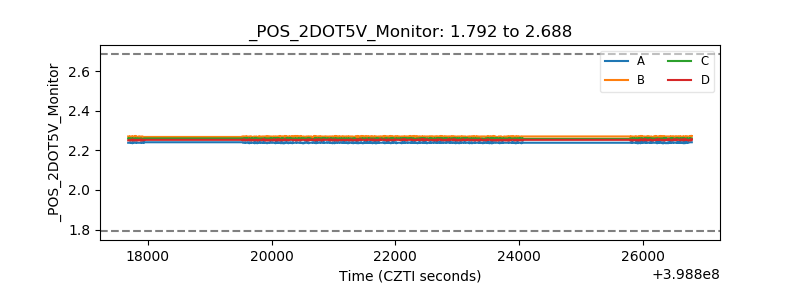 |
| +5 Volts monitor | 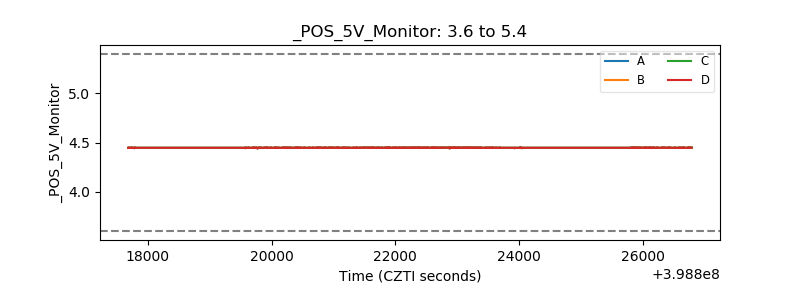 |
| _ROLL_ROT | 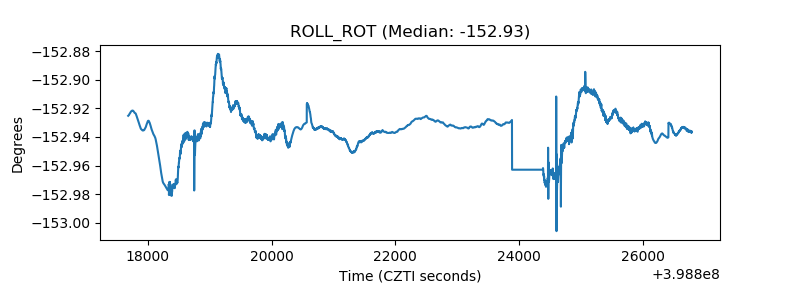 |
| _Roll_DEC | 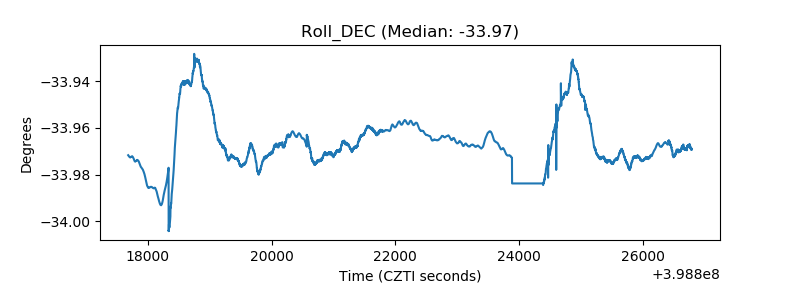 |
| _Roll_RA | 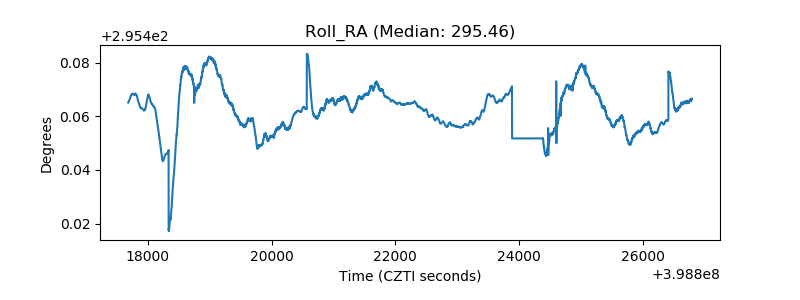 |
| Veto Counter | 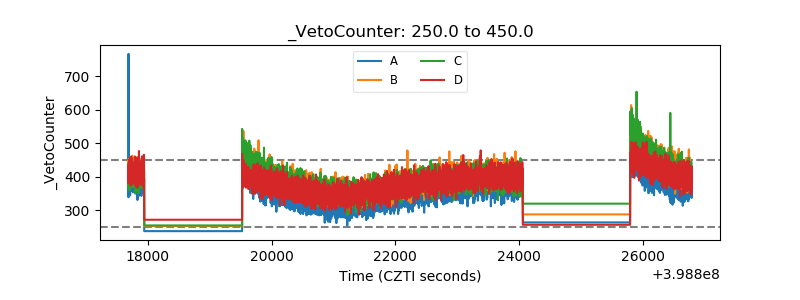 |