| Param | Original file | Final file |
|---|---|---|
| Filename | modeM0/AS1A10_103T07_9000005302_37301cztM0_level2.evt | modeM0/AS1A10_103T07_9000005302_37301cztM0_level2_quad_clean.evt |
| Size (bytes) | 391,757,760 | 60,367,680 |
| Size | 373.6 MB | 57.6 MB |
| Events in quadrant A | 2,788,412 | 361,204 |
| Events in quadrant B | 2,798,654 | 371,324 |
| Events in quadrant C | 2,988,570 | 367,470 |
| Events in quadrant D | 2,916,498 | 344,787 |
| Mode M0 | |||
|---|---|---|---|
| Quadrant | BADHDUFLAG | Total packets | Discarded packets |
| A | 0 | 11623 | 3 |
| B | 0 | 11769 | 2 |
| C | 0 | 11929 | 2 |
| D | 0 | 12500 | 2 |
| Mode M9 | |||
|---|---|---|---|
| Quadrant | BADHDUFLAG | Total packets | Discarded packets |
| A | 0 | 32 | 0 |
| B | 0 | 32 | 0 |
| C | 0 | 32 | 0 |
| D | 0 | 33 | 0 |
| Mode SS | |||
|---|---|---|---|
| Quadrant | BADHDUFLAG | Total packets | Discarded packets |
| A | 0 | 110 | 0 |
| B | 0 | 110 | 0 |
| C | 0 | 110 | 0 |
| D | 0 | 110 | 0 |
| Quadrant | Total seconds | Saturated seconds | Saturation percentage |
|---|---|---|---|
| A | 5476 | 8 | 0.146092% |
| B | 5476 | 29 | 0.529584% |
| C | 5476 | 94 | 1.716581% |
| D | 5476 | 97 | 1.771366% |
Noise dominated data is calculated using 1-second bins in cleaned event files. If a bin has >2000 counts, and if more than 50% of those come from <1% of pixels, then it is considered to be noise-dominated and hence unusable.
| Quadrant | # 1 sec bins | Bins with >0 counts | Bins with >2000 counts | High rate bins dominated by noise | Noise dominated (total time) | Noise dominated (detector-on time) | Marked lightcurve |
|---|---|---|---|---|---|---|---|
| A | 7297 | 5477 | 4 | 4 | 0.05% | 0.07% |  |
| B | 7297 | 5477 | 18 | 18 | 0.25% | 0.33% |  |
| C | 7297 | 5477 | 84 | 84 | 1.15% | 1.53% |  |
| D | 7297 | 5477 | 99 | 99 | 1.36% | 1.81% |  |
Top three noisy pixels from each quadrant. If the there are fewer than three noisy pixels in the level2.evt file, extra rows are filled as -1
| Pixel properties | Quadrant properties | ||||||
|---|---|---|---|---|---|---|---|
| Quadrant | DetID | PixID | Counts | Sigma | Mean | Median | Sigma |
| A | 10 | 83 | 268212 | 2079.84 | 636 | 625 | 128.7 |
| A | 13 | 6 | 18198 | 136.59 | 636 | 625 | 128.7 |
| A | 12 | 189 | 12563 | 92.79 | 636 | 625 | 128.7 |
| B | 12 | 18 | 106814 | 873.56 | 640 | 624 | 121.6 |
| B | 0 | 213 | 60641 | 493.72 | 640 | 624 | 121.6 |
| B | 0 | 221 | 31989 | 258.02 | 640 | 624 | 121.6 |
| C | 0 | 10 | 246909 | 1683.41 | 630 | 634 | 146.3 |
| C | 15 | 214 | 231469 | 1577.87 | 630 | 634 | 146.3 |
| C | 1 | 23 | 25403 | 169.31 | 630 | 634 | 146.3 |
| D | 2 | 153 | 170958 | 1128.18 | 620 | 604 | 151.0 |
| D | 10 | 253 | 144570 | 953.42 | 620 | 604 | 151.0 |
| D | 2 | 249 | 80721 | 530.58 | 620 | 604 | 151.0 |
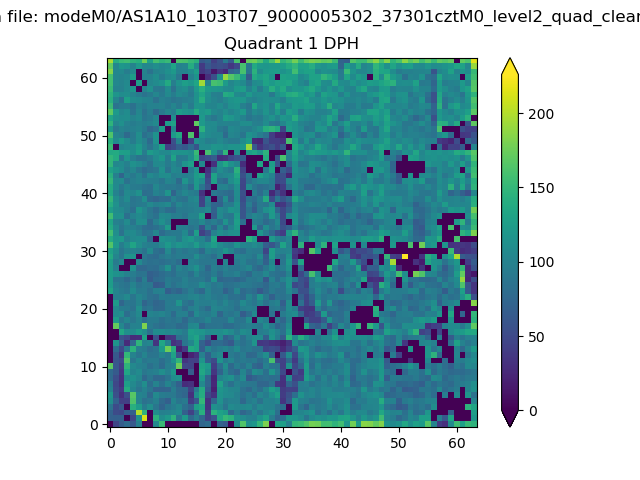
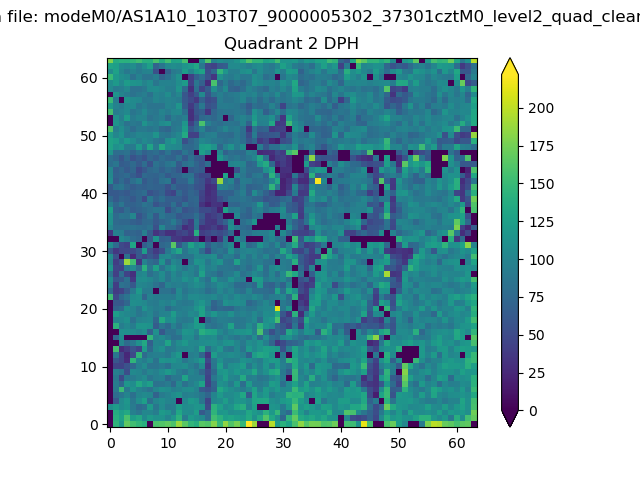
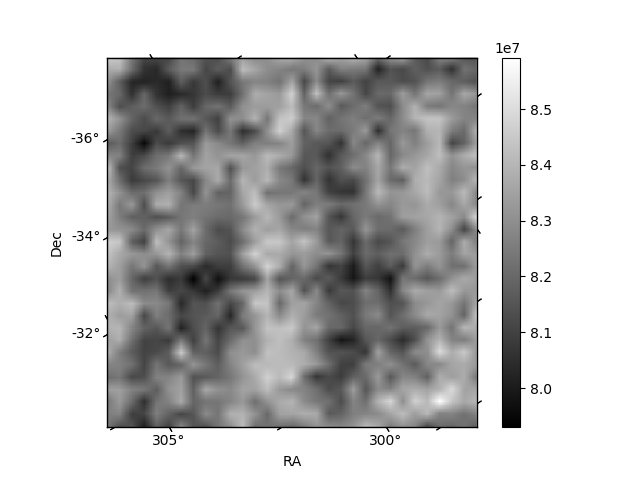
Histogram calculated using DETX and DETY for each event in the final _common_clean file
| Quadrant A |  |
 |
Quadrant B |
|---|---|---|---|
| Quadrant D | 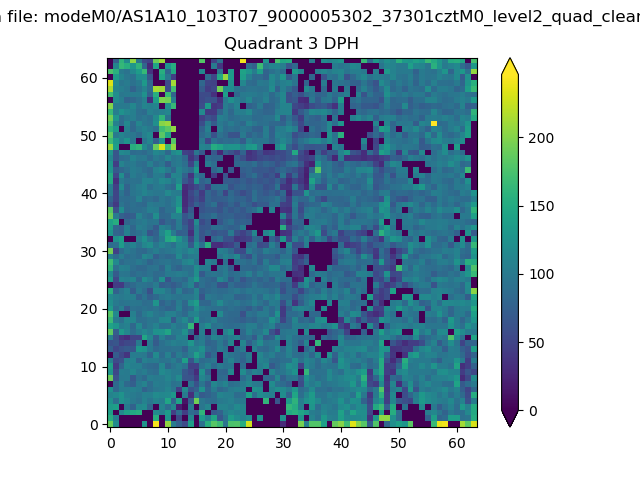 |
 |
Quadrant C |
| Plot type | Count rate plots | Images |
|---|---|---|
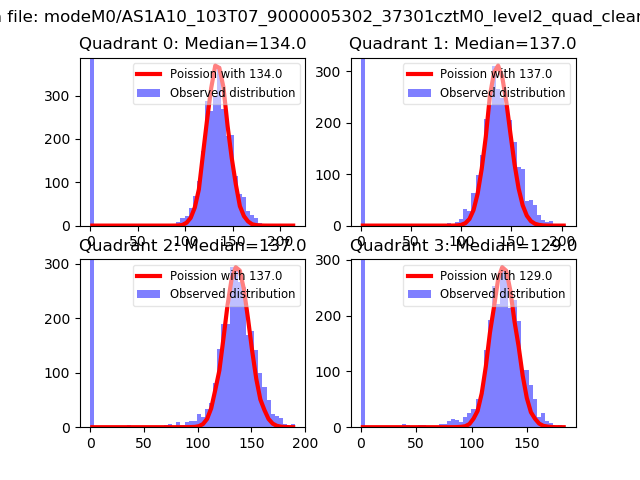
| Comparison with Poisson distribution Blue bars denote a histogram of data divided into 1 sec bins. Red curve is a Poisson curve with rate = median count rate of data. |
 |
 |
| Quadrant-wise count rates Data is divided into 100 sec bins |
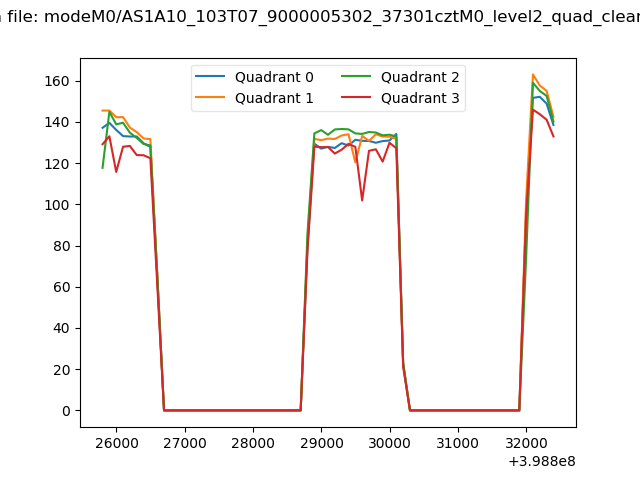 |
|
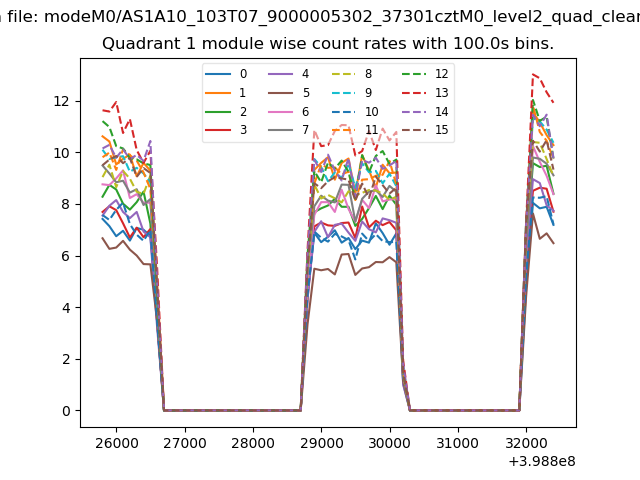
| Module-wise count rates for Quadrant A Data is divided into 100 sec bins |
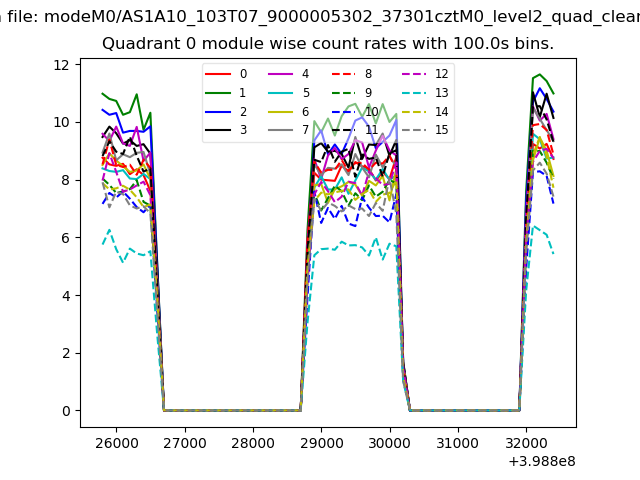 |
 |
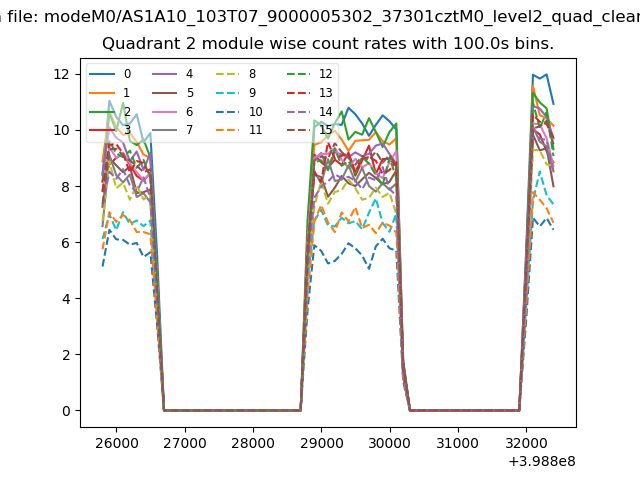
| Module-wise count rates for Quadrant B Data is divided into 100 sec bins |
 |
 |
| Module-wise count rates for Quadrant C Data is divided into 100 sec bins |
 |
 |
| Module-wise count rates for Quadrant D Data is divided into 100 sec bins |
 |
 |
| Parameter | Plot |
|---|---|
| CZT HV Monitor | 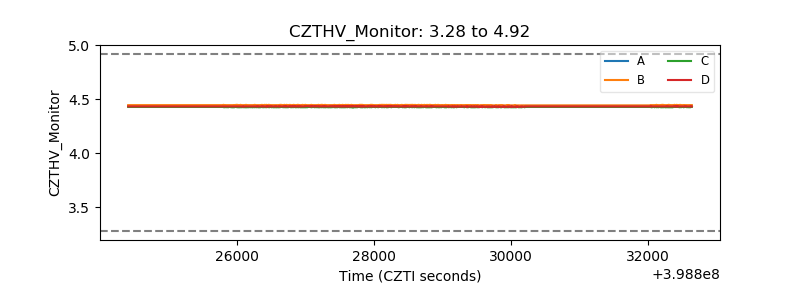 |
| D_VDD | 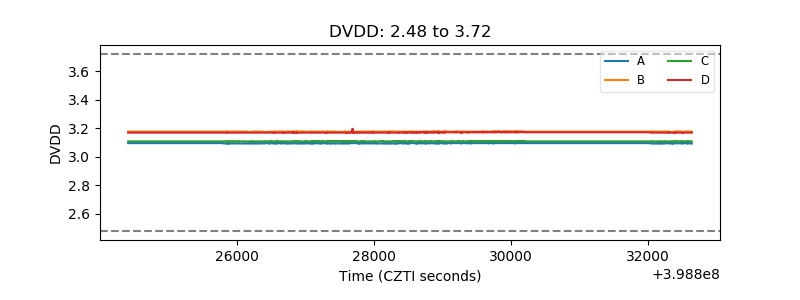 |
| Temperature 1 | 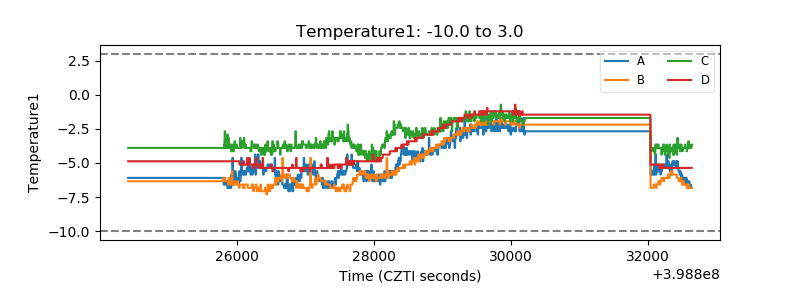 |
| Veto HV Monitor | 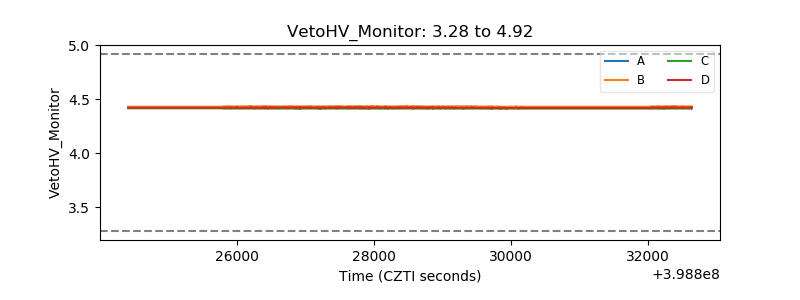 |
| Veto LLD | 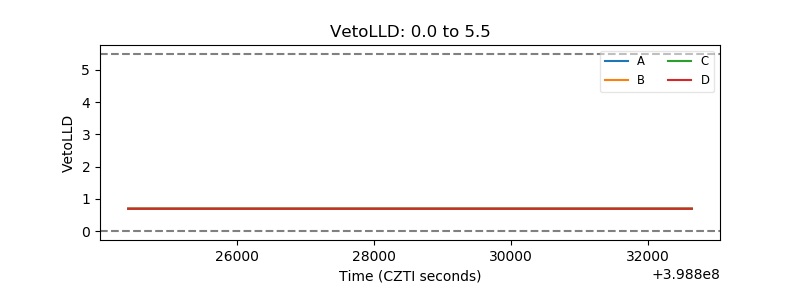 |
| Alpha Counter | 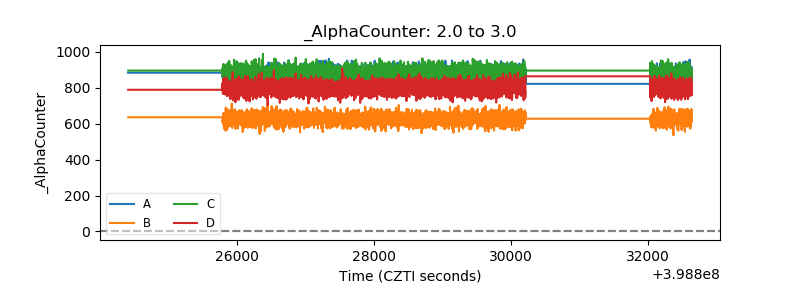 |
| _CPM_Rate | 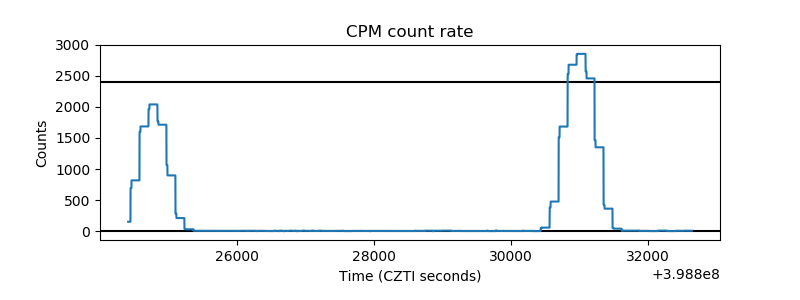 |
| CZT Counter | 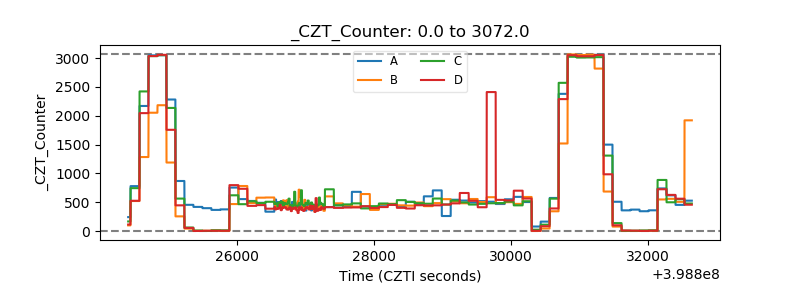 |
| +2.5 Volts monitor | 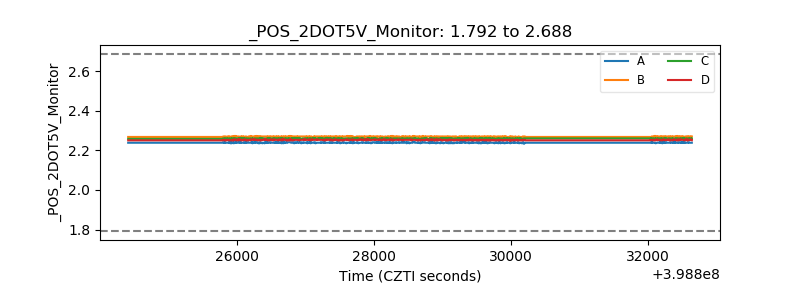 |
| +5 Volts monitor | 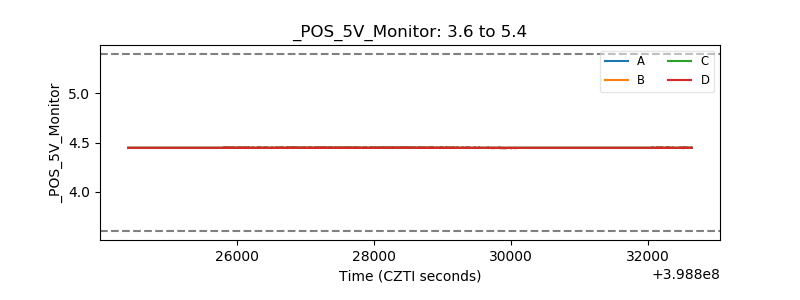 |
| _ROLL_ROT | 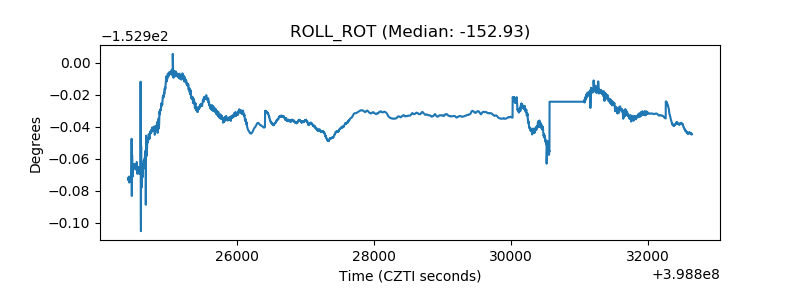 |
| _Roll_DEC | 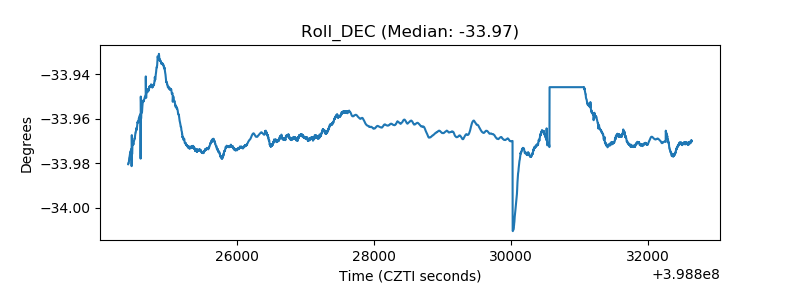 |
| _Roll_RA | 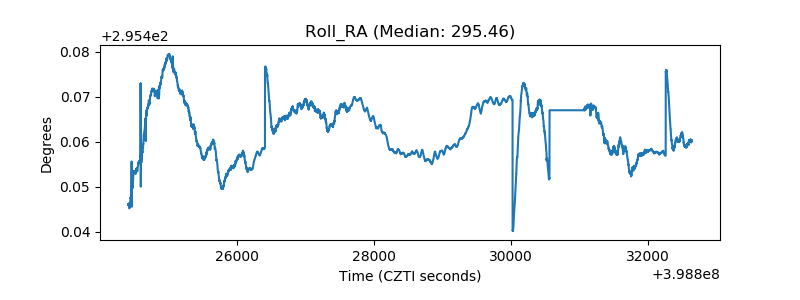 |
| Veto Counter | 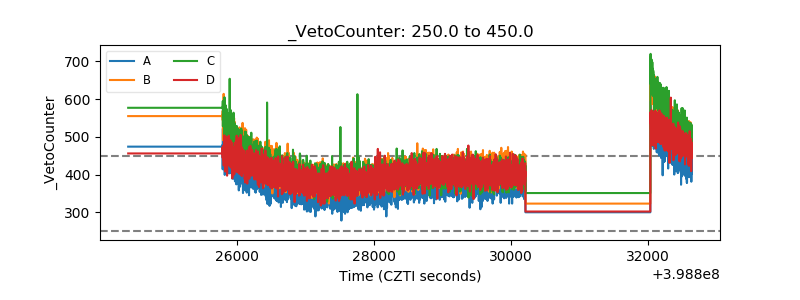 |