| Param | Original file | Final file |
|---|---|---|
| Filename | modeM0/AS1A10_103T07_9000005302_37302cztM0_level2.evt | modeM0/AS1A10_103T07_9000005302_37302cztM0_level2_quad_clean.evt |
| Size (bytes) | 392,909,760 | 51,796,800 |
| Size | 374.7 MB | 49.4 MB |
| Events in quadrant A | 2,842,226 | 295,947 |
| Events in quadrant B | 2,801,575 | 308,418 |
| Events in quadrant C | 2,975,818 | 305,407 |
| Events in quadrant D | 2,913,448 | 281,321 |
| Mode M0 | |||
|---|---|---|---|
| Quadrant | BADHDUFLAG | Total packets | Discarded packets |
| A | 0 | 11579 | 3 |
| B | 0 | 11468 | 2 |
| C | 0 | 11728 | 2 |
| D | 0 | 12133 | 2 |
| Mode M9 | |||
|---|---|---|---|
| Quadrant | BADHDUFLAG | Total packets | Discarded packets |
| A | 0 | 28 | 0 |
| B | 0 | 28 | 0 |
| C | 0 | 28 | 0 |
| D | 0 | 29 | 0 |
| Mode SS | |||
|---|---|---|---|
| Quadrant | BADHDUFLAG | Total packets | Discarded packets |
| A | 0 | 110 | 0 |
| B | 0 | 110 | 0 |
| C | 0 | 110 | 0 |
| D | 0 | 110 | 0 |
| Quadrant | Total seconds | Saturated seconds | Saturation percentage |
|---|---|---|---|
| A | 5381 | 9 | 0.167255% |
| B | 5381 | 50 | 0.929195% |
| C | 5381 | 61 | 1.133618% |
| D | 5381 | 127 | 2.360156% |
Noise dominated data is calculated using 1-second bins in cleaned event files. If a bin has >2000 counts, and if more than 50% of those come from <1% of pixels, then it is considered to be noise-dominated and hence unusable.
| Quadrant | # 1 sec bins | Bins with >0 counts | Bins with >2000 counts | High rate bins dominated by noise | Noise dominated (total time) | Noise dominated (detector-on time) | Marked lightcurve |
|---|---|---|---|---|---|---|---|
| A | 7324 | 5382 | 4 | 4 | 0.05% | 0.07% | 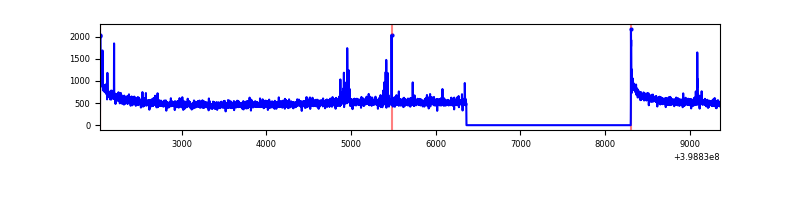 |
| B | 7324 | 5382 | 18 | 18 | 0.25% | 0.33% | 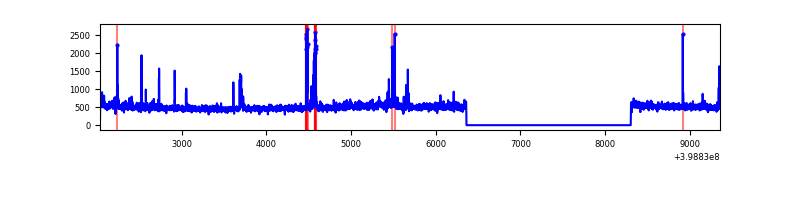 |
| C | 7324 | 5382 | 54 | 54 | 0.74% | 1.00% | 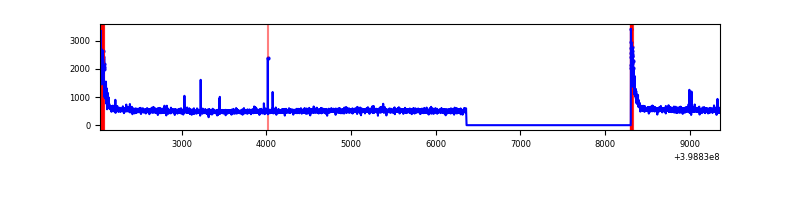 |
| D | 7324 | 5382 | 94 | 94 | 1.28% | 1.75% | 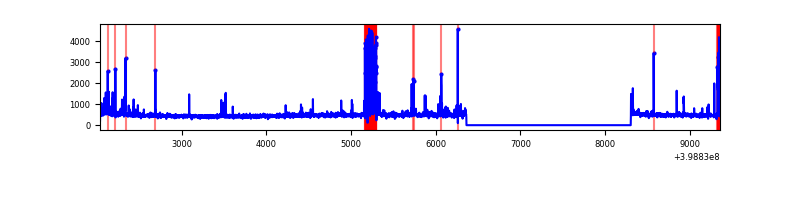 |
Top three noisy pixels from each quadrant. If the there are fewer than three noisy pixels in the level2.evt file, extra rows are filled as -1
| Pixel properties | Quadrant properties | ||||||
|---|---|---|---|---|---|---|---|
| Quadrant | DetID | PixID | Counts | Sigma | Mean | Median | Sigma |
| A | 10 | 83 | 265758 | 2024.04 | 651 | 641 | 131.0 |
| A | 9 | 143 | 30060 | 224.6 | 651 | 641 | 131.0 |
| A | 13 | 248 | 13871 | 101.0 | 651 | 641 | 131.0 |
| B | 12 | 18 | 112271 | 902.85 | 655 | 639 | 123.6 |
| B | 0 | 213 | 41419 | 329.82 | 655 | 639 | 123.6 |
| B | 4 | 171 | 23065 | 181.38 | 655 | 639 | 123.6 |
| C | 15 | 214 | 225922 | 1501.83 | 648 | 654 | 150.0 |
| C | 0 | 10 | 201584 | 1339.57 | 648 | 654 | 150.0 |
| C | 14 | 254 | 11039 | 69.24 | 648 | 654 | 150.0 |
| D | 10 | 199 | 296355 | 1933.05 | 633 | 617 | 153.0 |
| D | 13 | 249 | 88476 | 574.28 | 633 | 617 | 153.0 |
| D | 2 | 249 | 33708 | 216.29 | 633 | 617 | 153.0 |
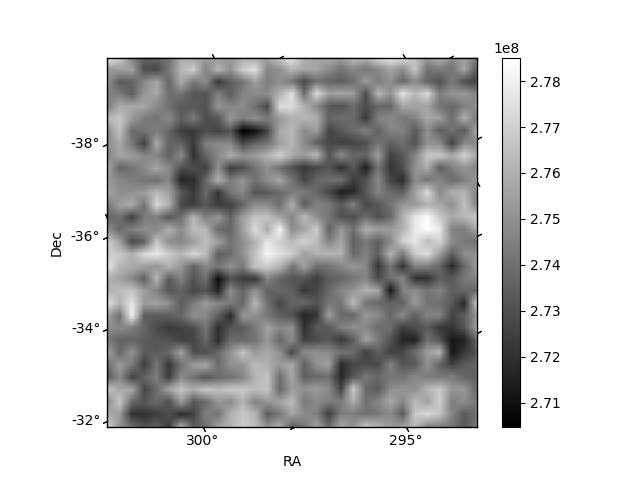
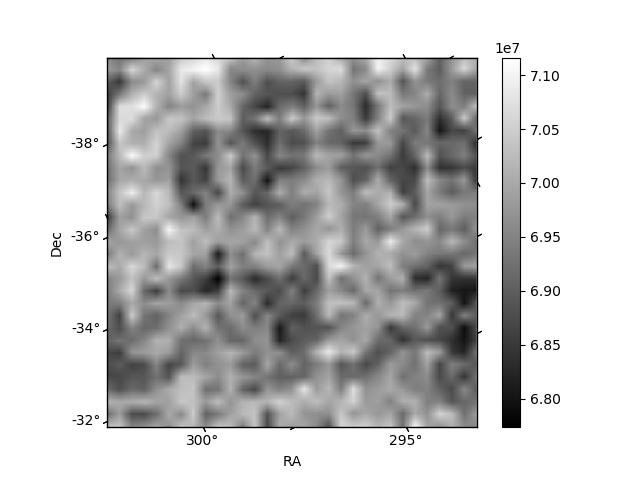
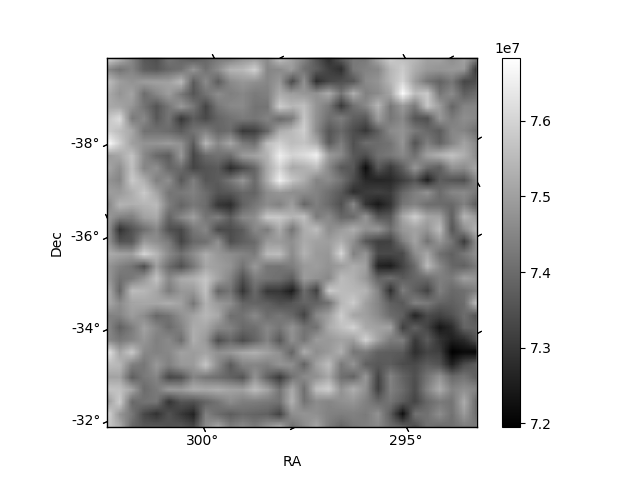
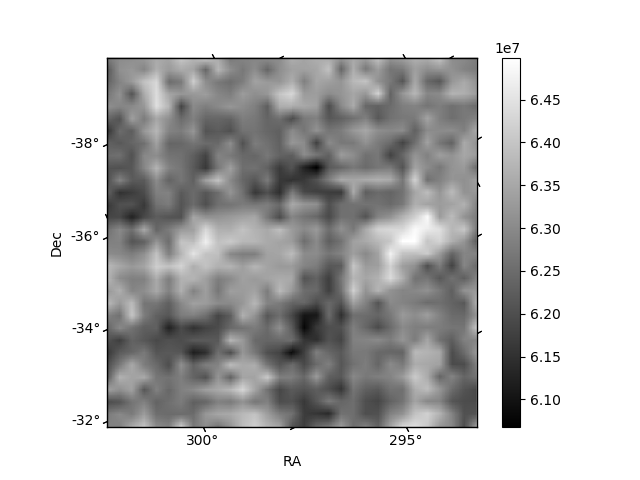
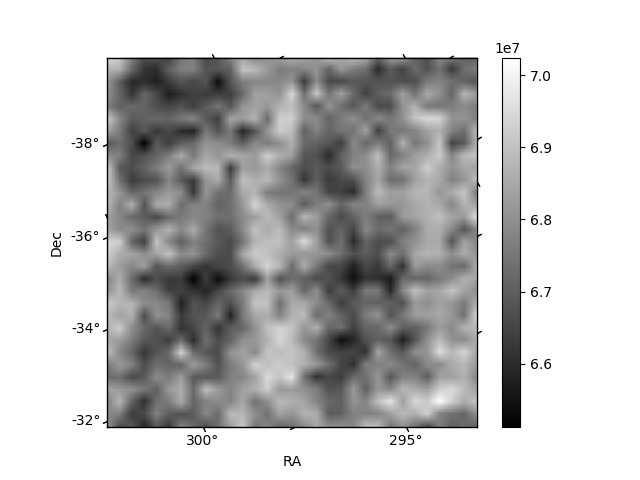
Histogram calculated using DETX and DETY for each event in the final _common_clean file
| Quadrant A | 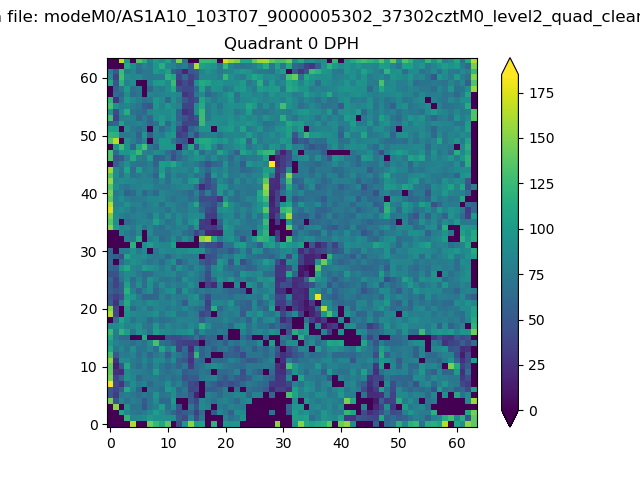 |
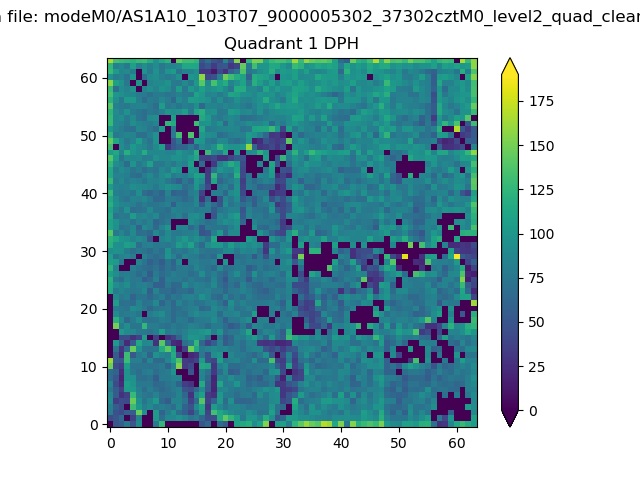 |
Quadrant B |
|---|---|---|---|
| Quadrant D |  |
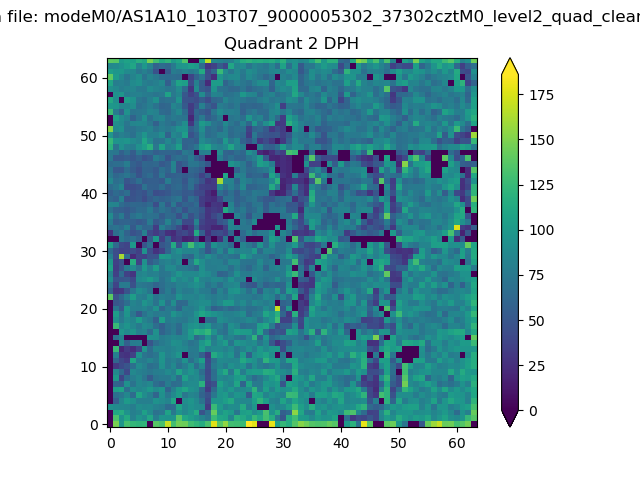 |
Quadrant C |
| Plot type | Count rate plots | Images |
|---|---|---|
| Comparison with Poisson distribution Blue bars denote a histogram of data divided into 1 sec bins. Red curve is a Poisson curve with rate = median count rate of data. |
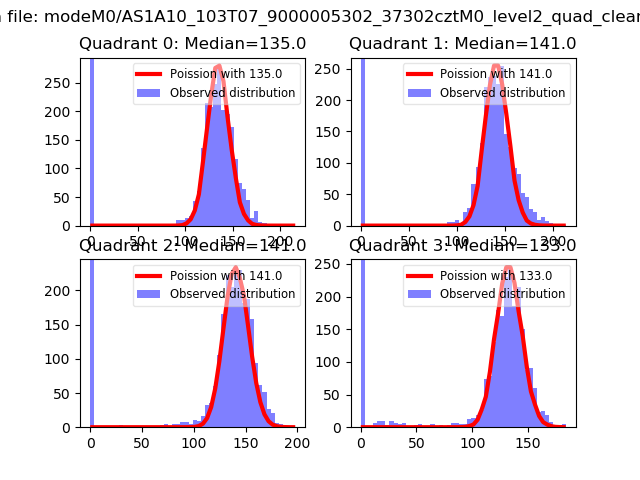 |
 |
| Quadrant-wise count rates Data is divided into 100 sec bins |
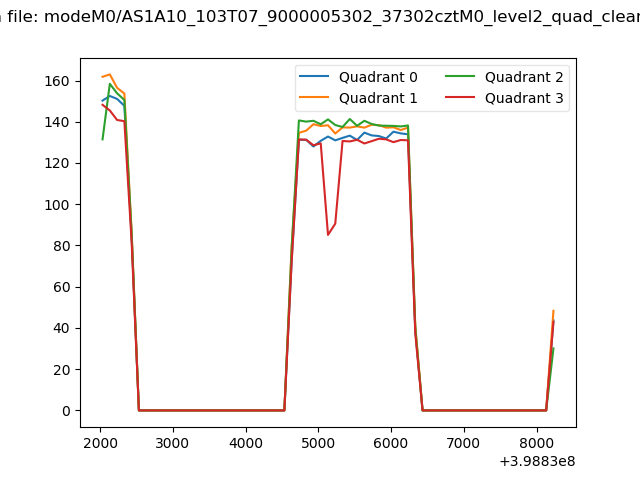 |
|
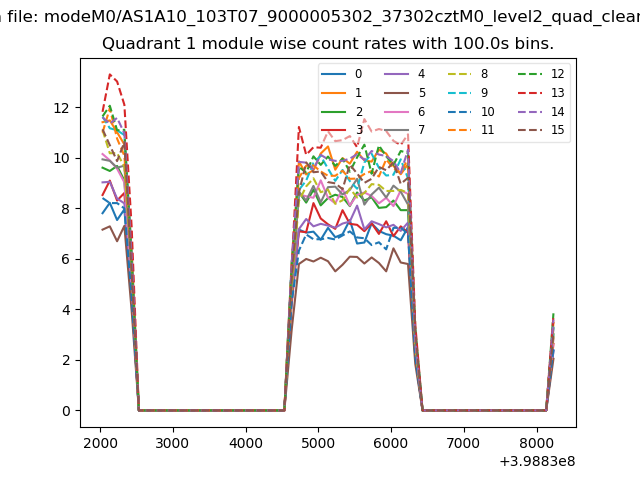
| Module-wise count rates for Quadrant A Data is divided into 100 sec bins |
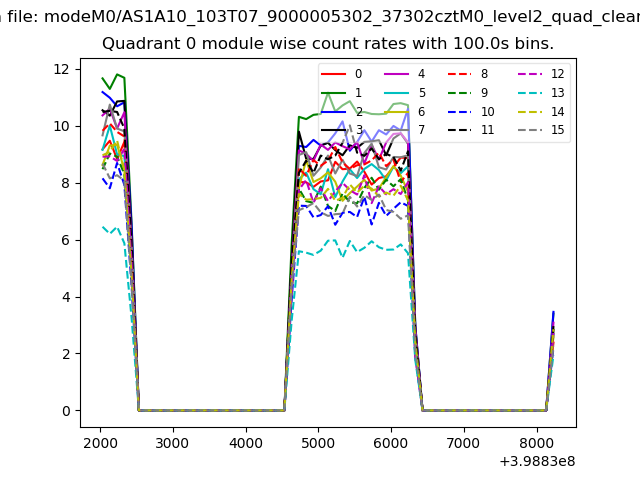 |
 |
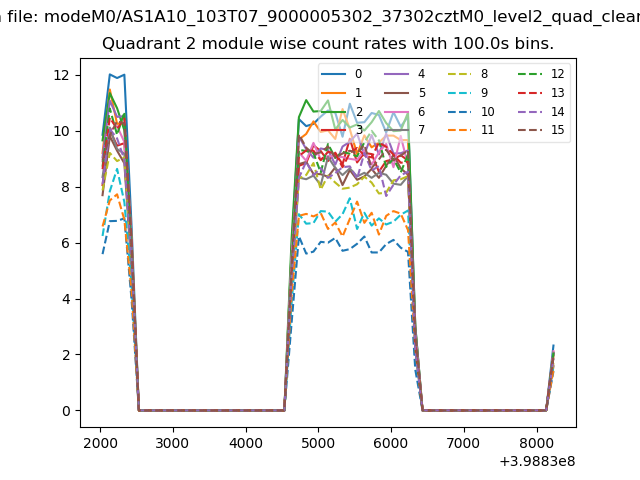
| Module-wise count rates for Quadrant B Data is divided into 100 sec bins |
 |
 |
| Module-wise count rates for Quadrant C Data is divided into 100 sec bins |
 |
 |
| Module-wise count rates for Quadrant D Data is divided into 100 sec bins |
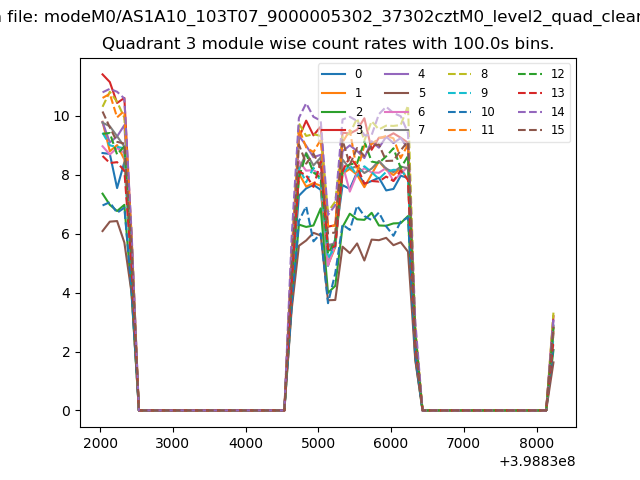 |
 |
| Parameter | Plot |
|---|---|
| CZT HV Monitor | 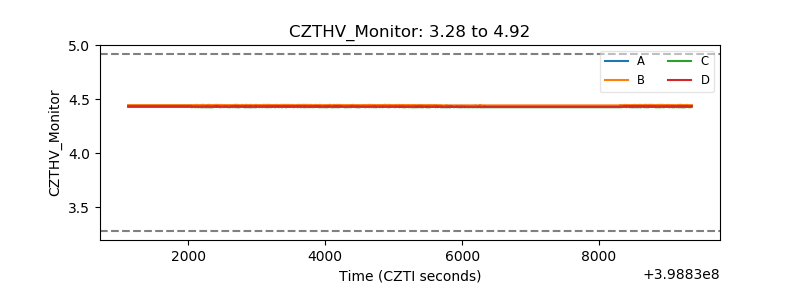 |
| D_VDD | 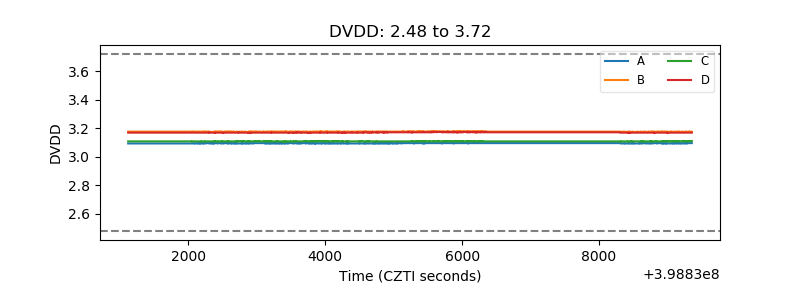 |
| Temperature 1 | 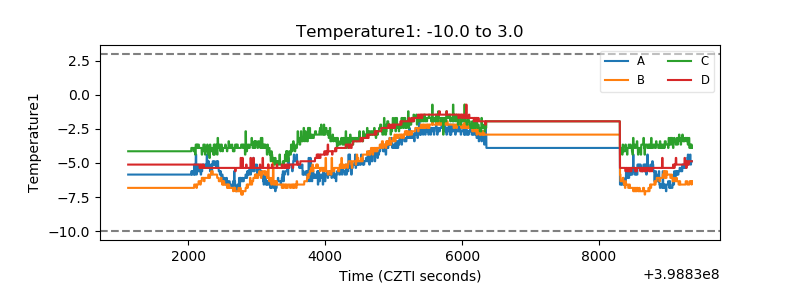 |
| Veto HV Monitor | 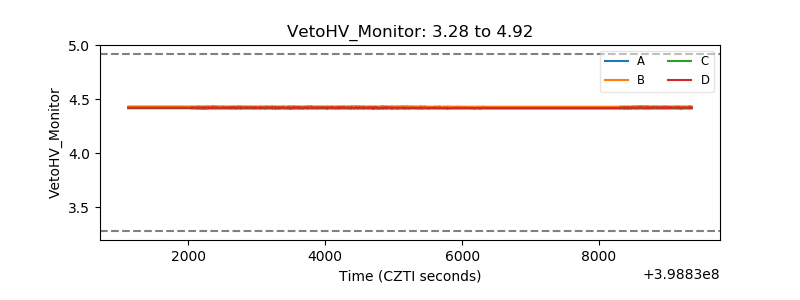 |
| Veto LLD | 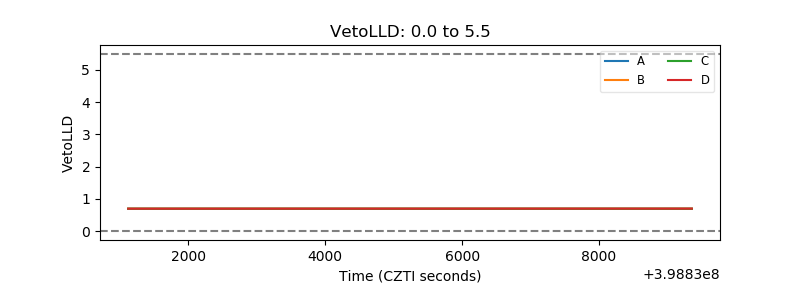 |
| Alpha Counter | 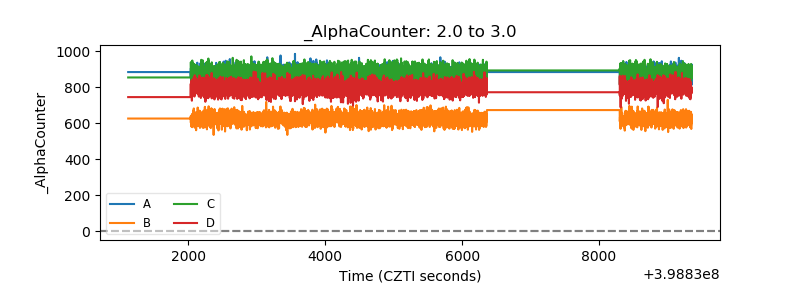 |
| _CPM_Rate | 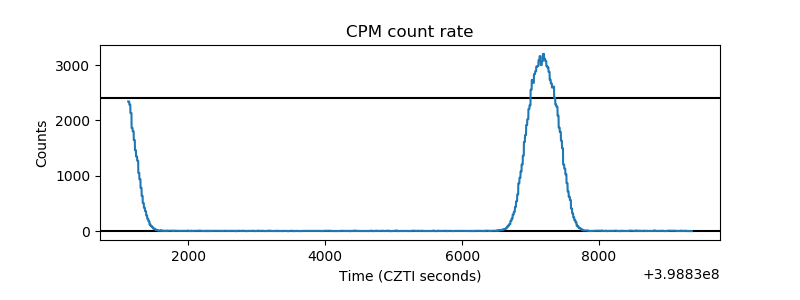 |
| CZT Counter | 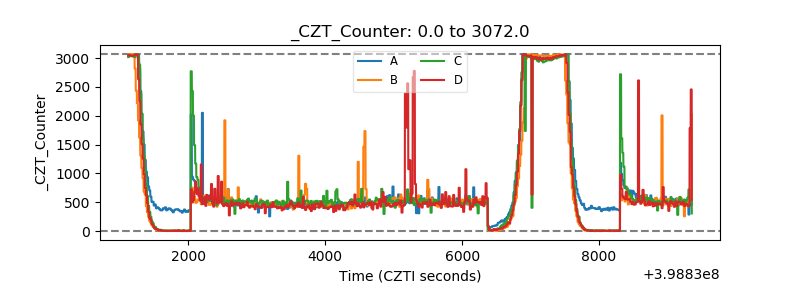 |
| +2.5 Volts monitor | 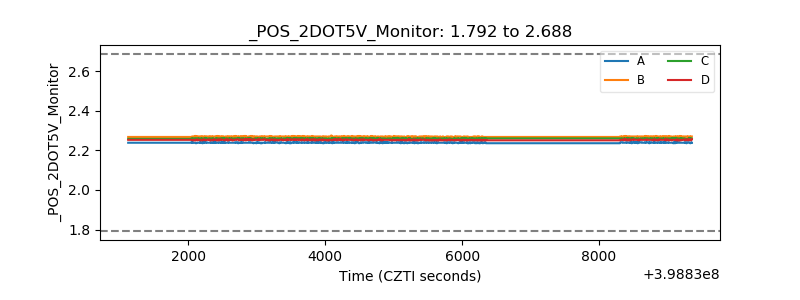 |
| +5 Volts monitor | 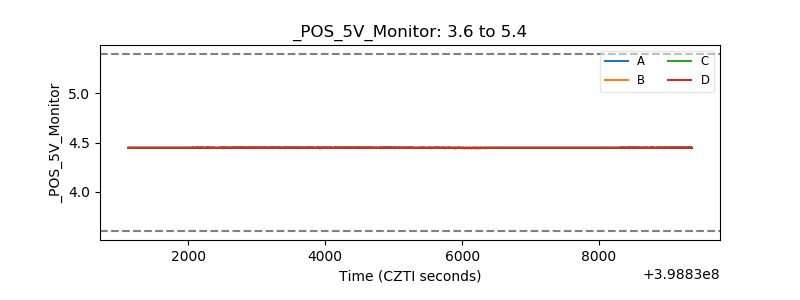 |
| _ROLL_ROT | 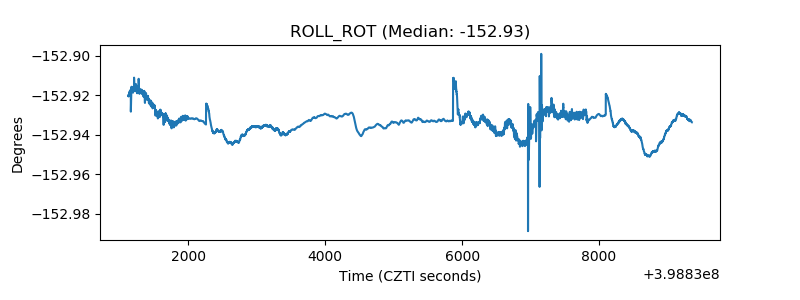 |
| _Roll_DEC | 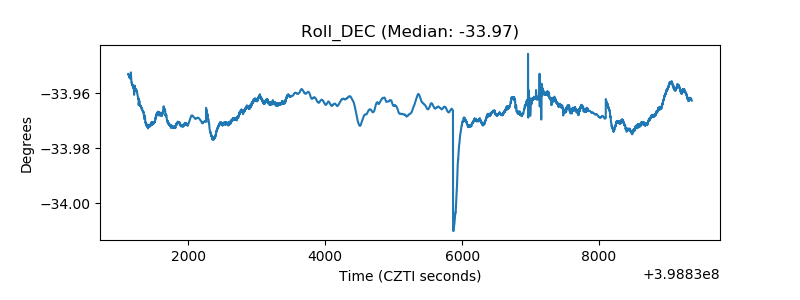 |
| _Roll_RA | 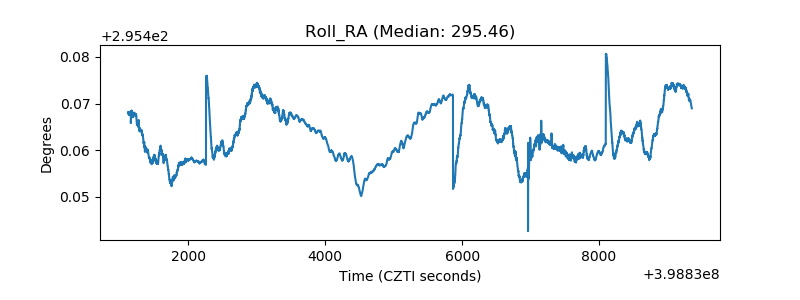 |
| Veto Counter | 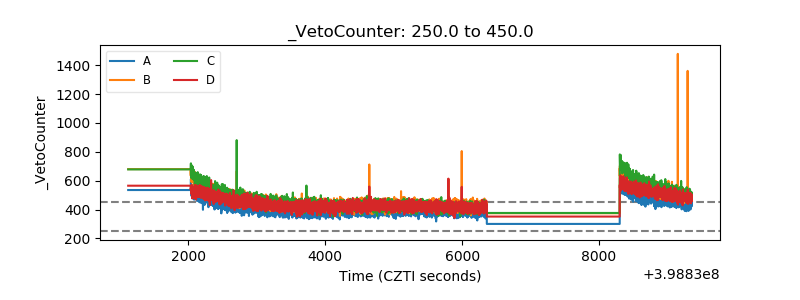 |