| Param | Original file | Final file |
|---|---|---|
| Filename | modeM0/AS1A10_094T14_9000005308cztM0_level2.fits | modeM0/AS1A10_094T14_9000005308cztM0_level2_quad_clean.evt |
| Size (bytes) | 31,325,760 | 46,054,080 |
| Size | 29.9 MB | 43.9 MB |
| Events in quadrant A | 189,840 | 304,030 |
| Events in quadrant B | 172,942 | 283,202 |
| Events in quadrant C | 186,158 | 305,692 |
| Events in quadrant D | 148,760 | 250,310 |
| Mode M9 | |||
|---|---|---|---|
| Quadrant | BADHDUFLAG | Total packets | Discarded packets |
| A | 0 | 20 | 0 |
| B | 0 | 20 | 0 |
| C | 0 | 20 | 0 |
| D | 0 | 20 | 0 |
| Mode M0 | |||
|---|---|---|---|
| Quadrant | BADHDUFLAG | Total packets | Discarded packets |
| A | 0 | 7545 | 0 |
| B | 0 | 10263 | 0 |
| C | 0 | 7455 | 0 |
| D | 0 | 12099 | 0 |
| Mode SS | |||
|---|---|---|---|
| Quadrant | BADHDUFLAG | Total packets | Discarded packets |
| A | 0 | 72 | 0 |
| B | 0 | 72 | 0 |
| C | 0 | 72 | 0 |
| D | 0 | 72 | 0 |
| Quadrant | Total seconds | Saturated seconds | Saturation percentage |
|---|---|---|---|
| A | 3544 | 22 | 0.620767% |
| B | 3544 | 245 | 6.913093% |
| C | 3544 | 27 | 0.761851% |
| D | 3544 | 604 | 17.042889% |
Noise dominated data is calculated using 1-second bins in cleaned event files. If a bin has >2000 counts, and if more than 50% of those come from <1% of pixels, then it is considered to be noise-dominated and hence unusable.
| Quadrant | # 1 sec bins | Bins with >0 counts | Bins with >2000 counts | High rate bins dominated by noise | Noise dominated (total time) | Noise dominated (detector-on time) | Marked lightcurve |
|---|---|---|---|---|---|---|---|
| A | 5517 | 3544 | 0 | 0 | 0.00% | 0.00% | 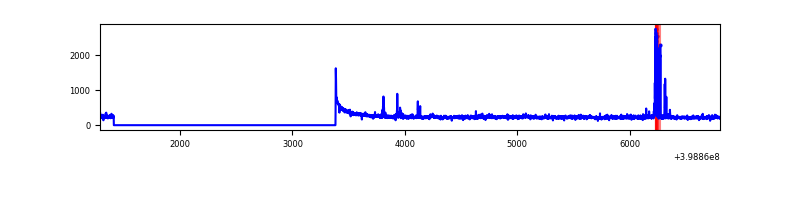 |
| B | 5517 | 3543 | 0 | 0 | 0.00% | 0.00% |  |
| C | 5517 | 3544 | 0 | 0 | 0.00% | 0.00% |  |
| D | 5517 | 3537 | 0 | 0 | 0.00% | 0.00% |  |
Top three noisy pixels from each quadrant. If the there are fewer than three noisy pixels in the level2.evt file, extra rows are filled as -1
| Pixel properties | Quadrant properties | ||||||
|---|---|---|---|---|---|---|---|
| Quadrant | DetID | PixID | Counts | Sigma | Mean | Median | Sigma |
| A | 0 | 29 | 165 | 8.45 | 49 | 46 | 14.1 |
| A | 9 | 19 | 162 | 8.23 | 49 | 46 | 14.1 |
| A | 7 | 110 | 160 | 8.09 | 49 | 46 | 14.1 |
| B | 2 | 9 | 156 | 10.17 | 45 | 44 | 11.0 |
| B | 3 | 17 | 137 | 8.45 | 45 | 44 | 11.0 |
| B | 3 | 80 | 132 | 7.99 | 45 | 44 | 11.0 |
| C | 3 | 202 | 143 | 6.59 | 49 | 46 | 14.7 |
| C | 3 | 203 | 142 | 6.52 | 49 | 46 | 14.7 |
| C | 12 | 241 | 134 | 5.98 | 49 | 46 | 14.7 |
| D | 6 | 83 | 119 | 6.21 | 42 | 38 | 13.0 |
| D | 15 | 94 | 116 | 5.98 | 42 | 38 | 13.0 |
| D | 1 | 3 | 114 | 5.83 | 42 | 38 | 13.0 |
Histogram calculated using DETX and DETY for each event in the final _common_clean file
| Quadrant A | 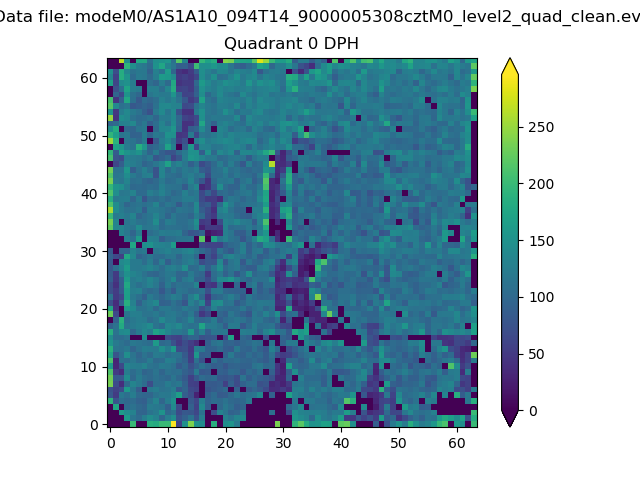 |
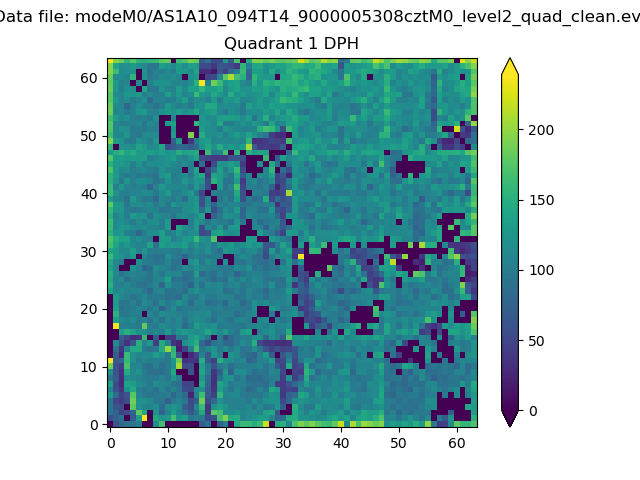 |
Quadrant B |
|---|---|---|---|
| Quadrant D | 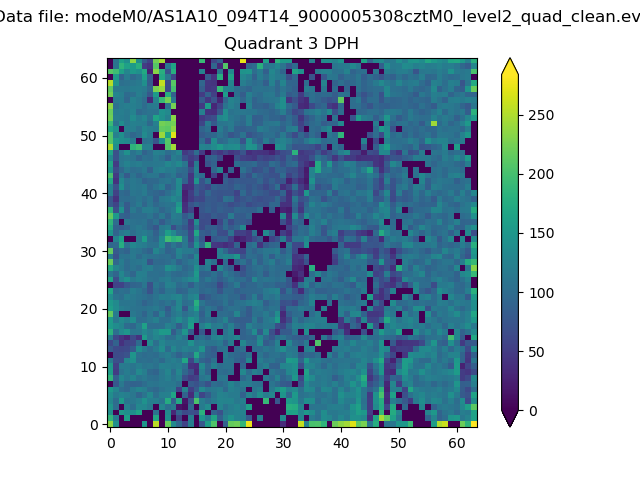 |
 |
Quadrant C |
| Plot type | Count rate plots | Images |
|---|---|---|
| Comparison with Poisson distribution Blue bars denote a histogram of data divided into 1 sec bins. Red curve is a Poisson curve with rate = median count rate of data. |
 |
 |
| Quadrant-wise count rates Data is divided into 100 sec bins |
 |
|
| Module-wise count rates for Quadrant A Data is divided into 100 sec bins |
 |
 |
| Module-wise count rates for Quadrant B Data is divided into 100 sec bins |
 |
 |
| Module-wise count rates for Quadrant C Data is divided into 100 sec bins |
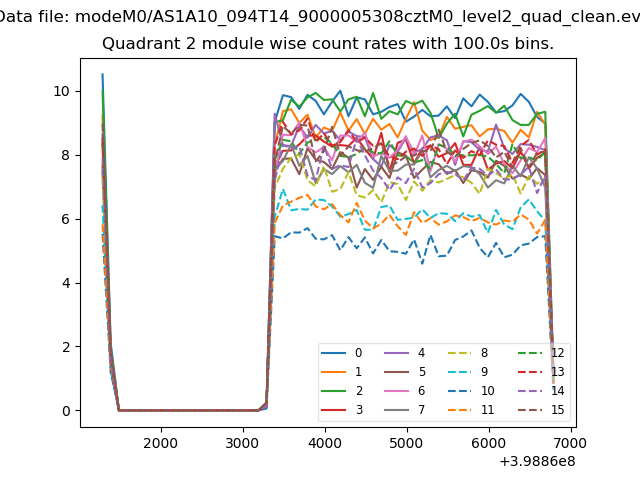 |
 |
| Module-wise count rates for Quadrant D Data is divided into 100 sec bins |
 |
 |
| Parameter | Plot |
|---|---|
| CZT HV Monitor | 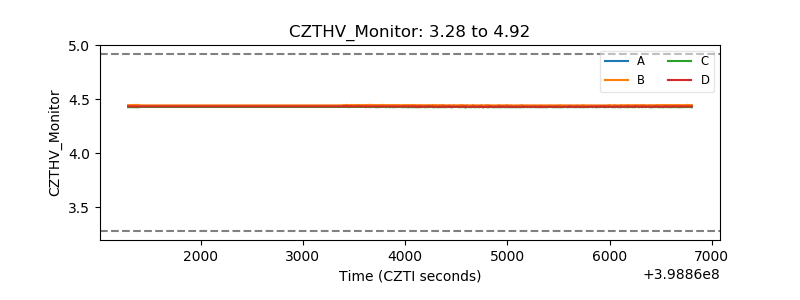 |
| D_VDD | 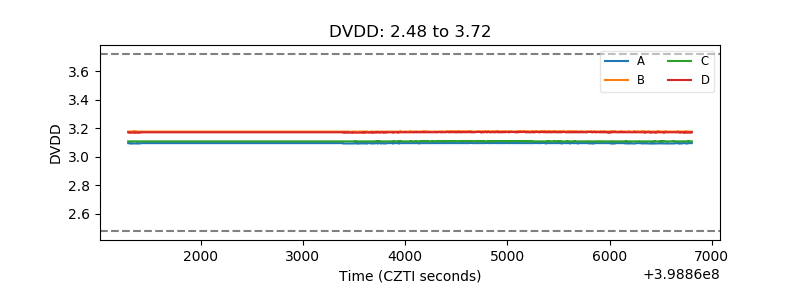 |
| Temperature 1 | 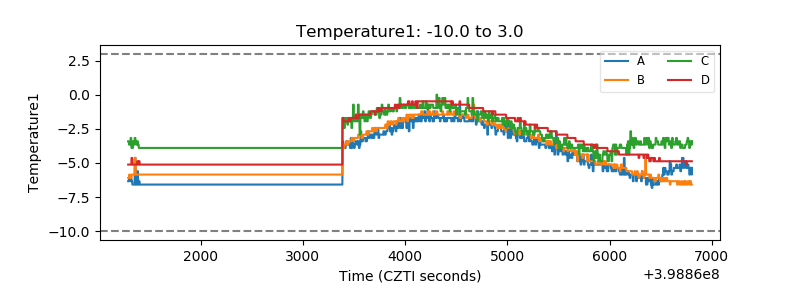 |
| Veto HV Monitor |  |
| Veto LLD |  |
| Alpha Counter |  |
| _CPM_Rate | 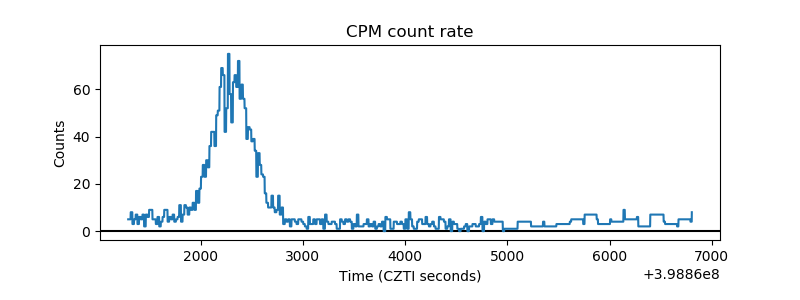 |
| CZT Counter | 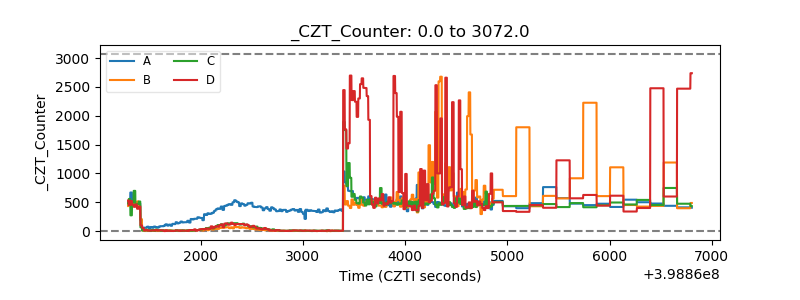 |
| +2.5 Volts monitor | 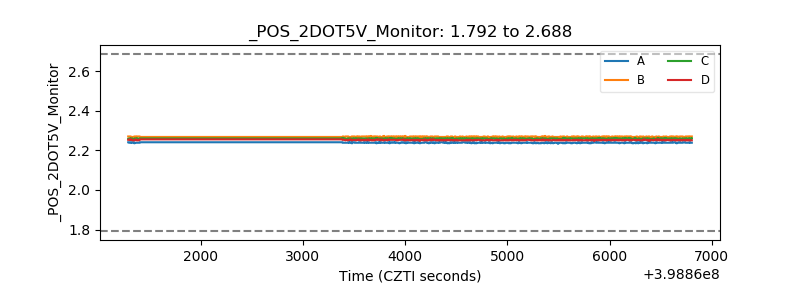 |
| +5 Volts monitor |  |
| _ROLL_ROT |  |
| _Roll_DEC |  |
| _Roll_RA | 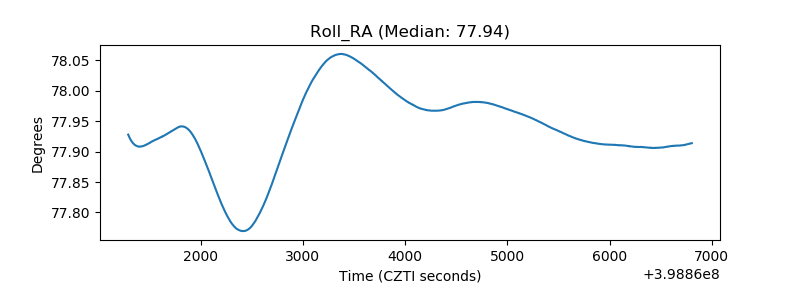 |
| Veto Counter | 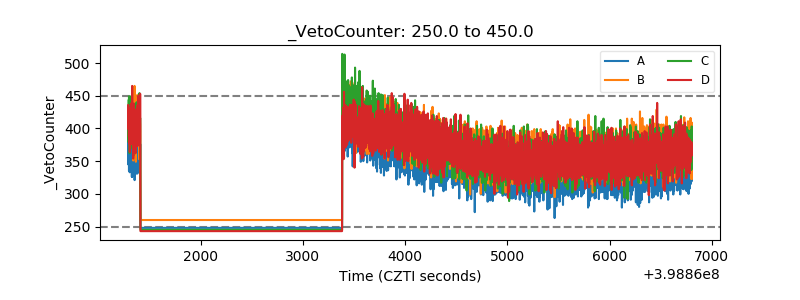 |