| Param | Original file | Final file |
|---|---|---|
| Filename | modeM0/AS1A10_094T14_9000005308_37306cztM0_level2.evt | modeM0/AS1A10_094T14_9000005308_37306cztM0_level2_quad_clean.evt |
| Size (bytes) | 114,330,240 | 22,196,160 |
| Size | 109.0 MB | 21.2 MB |
| Events in quadrant A | 647,926 | 146,241 |
| Events in quadrant B | 760,884 | 149,056 |
| Events in quadrant C | 687,205 | 152,740 |
| Events in quadrant D | 1,281,654 | 132,407 |
| Mode M9 | |||
|---|---|---|---|
| Quadrant | BADHDUFLAG | Total packets | Discarded packets |
| A | 0 | 20 | 0 |
| B | 0 | 20 | 0 |
| C | 0 | 20 | 0 |
| D | 0 | 20 | 0 |
| Mode M0 | |||
|---|---|---|---|
| Quadrant | BADHDUFLAG | Total packets | Discarded packets |
| A | 0 | 2672 | 2 |
| B | 0 | 3022 | 1 |
| C | 0 | 2743 | 1 |
| D | 0 | 4609 | 1 |
| Mode SS | |||
|---|---|---|---|
| Quadrant | BADHDUFLAG | Total packets | Discarded packets |
| A | 0 | 26 | 0 |
| B | 0 | 26 | 0 |
| C | 0 | 26 | 0 |
| D | 0 | 26 | 0 |
| Quadrant | Total seconds | Saturated seconds | Saturation percentage |
|---|---|---|---|
| A | 1206 | 3 | 0.248756% |
| B | 1206 | 34 | 2.819237% |
| C | 1206 | 27 | 2.238806% |
| D | 1206 | 284 | 23.548922% |
Noise dominated data is calculated using 1-second bins in cleaned event files. If a bin has >2000 counts, and if more than 50% of those come from <1% of pixels, then it is considered to be noise-dominated and hence unusable.
| Quadrant | # 1 sec bins | Bins with >0 counts | Bins with >2000 counts | High rate bins dominated by noise | Noise dominated (total time) | Noise dominated (detector-on time) | Marked lightcurve |
|---|---|---|---|---|---|---|---|
| A | 3179 | 1207 | 0 | 0 | 0.00% | 0.00% | 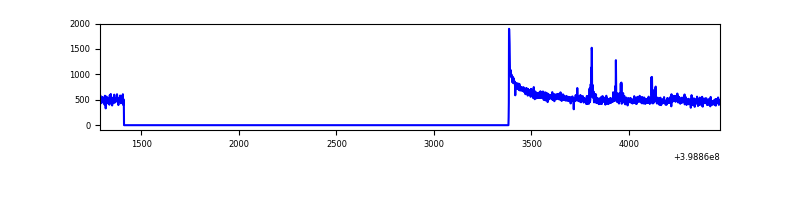 |
| B | 3179 | 1207 | 21 | 21 | 0.66% | 1.74% | 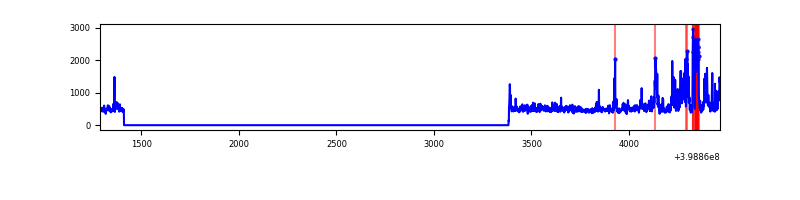 |
| C | 3179 | 1207 | 24 | 24 | 0.75% | 1.99% | 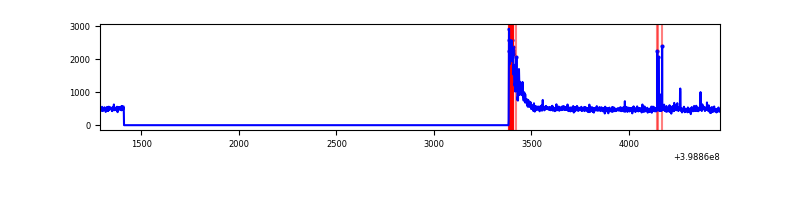 |
| D | 3179 | 1207 | 267 | 267 | 8.40% | 22.12% | 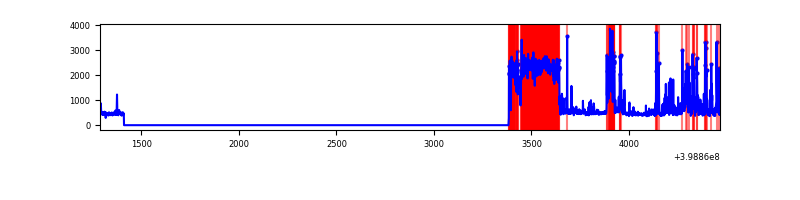 |
Top three noisy pixels from each quadrant. If the there are fewer than three noisy pixels in the level2.evt file, extra rows are filled as -1
| Pixel properties | Quadrant properties | ||||||
|---|---|---|---|---|---|---|---|
| Quadrant | DetID | PixID | Counts | Sigma | Mean | Median | Sigma |
| A | 10 | 83 | 95519 | 3234.9 | 136 | 133 | 29.5 |
| A | 13 | 248 | 14500 | 487.24 | 136 | 133 | 29.5 |
| A | 10 | 248 | 3700 | 120.97 | 136 | 133 | 29.5 |
| B | 4 | 171 | 116316 | 4227.23 | 133 | 129 | 27.5 |
| B | 12 | 18 | 50653 | 1838.21 | 133 | 129 | 27.5 |
| B | 0 | 213 | 48703 | 1767.27 | 133 | 129 | 27.5 |
| C | 0 | 10 | 90850 | 2815.53 | 133 | 134 | 32.2 |
| C | 15 | 214 | 53780 | 1664.99 | 133 | 134 | 32.2 |
| C | 14 | 254 | 12383 | 380.17 | 133 | 134 | 32.2 |
| D | 10 | 253 | 600449 | 18607.02 | 126 | 122 | 32.3 |
| D | 10 | 199 | 62973 | 1948.05 | 126 | 122 | 32.3 |
| D | 2 | 249 | 50786 | 1570.32 | 126 | 122 | 32.3 |
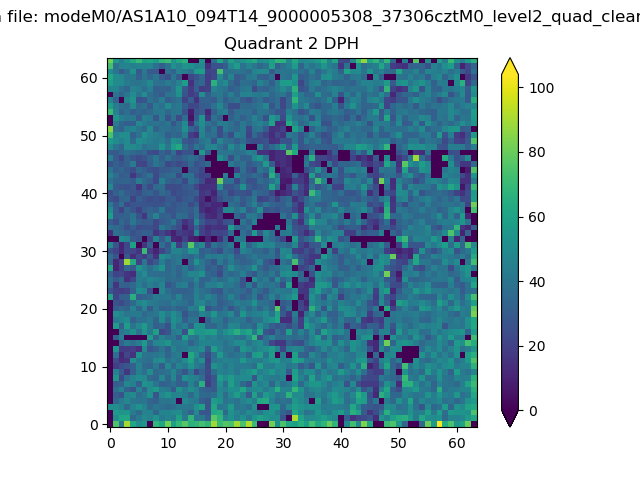
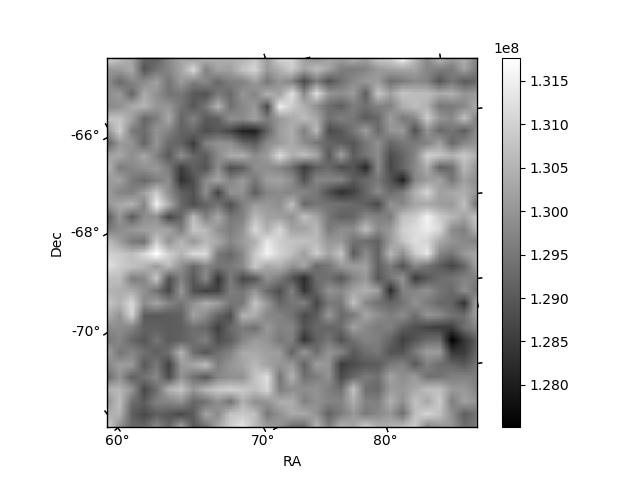
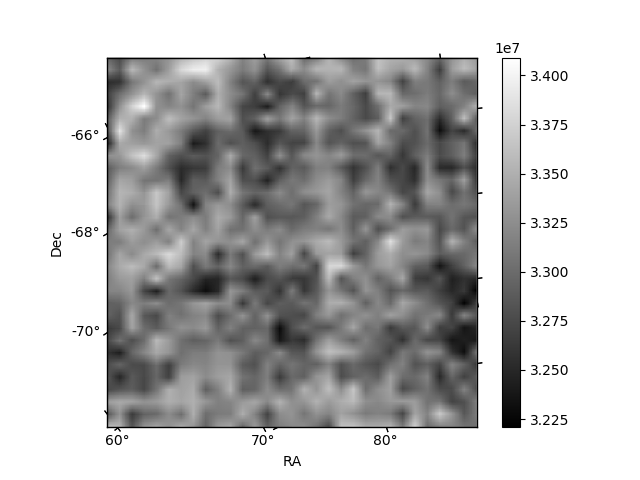
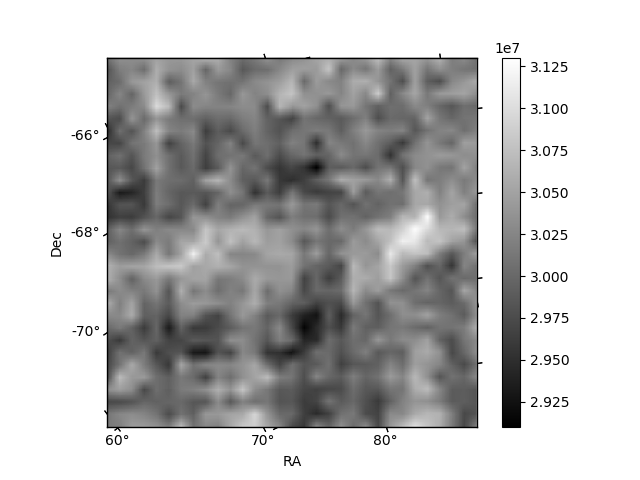
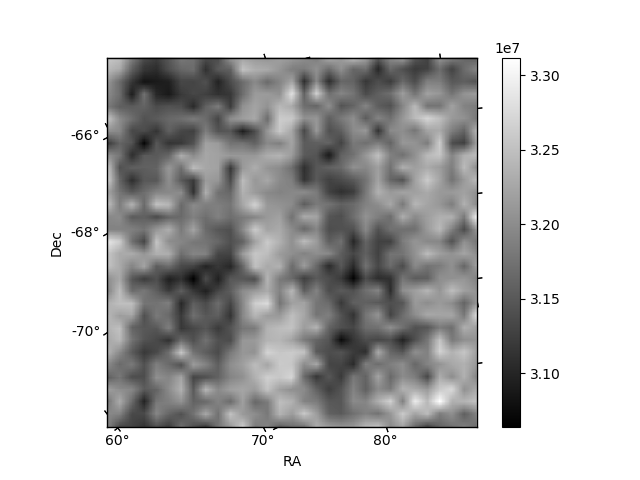
Histogram calculated using DETX and DETY for each event in the final _common_clean file
| Quadrant A | 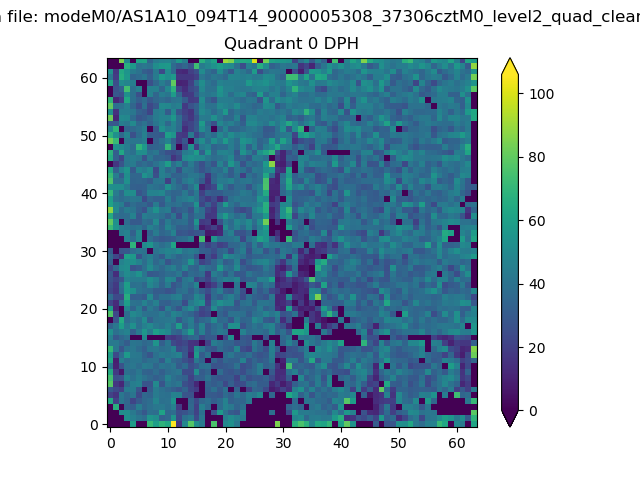 |
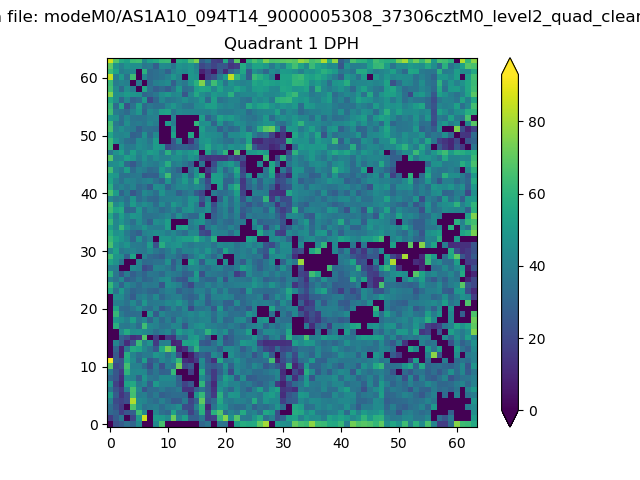 |
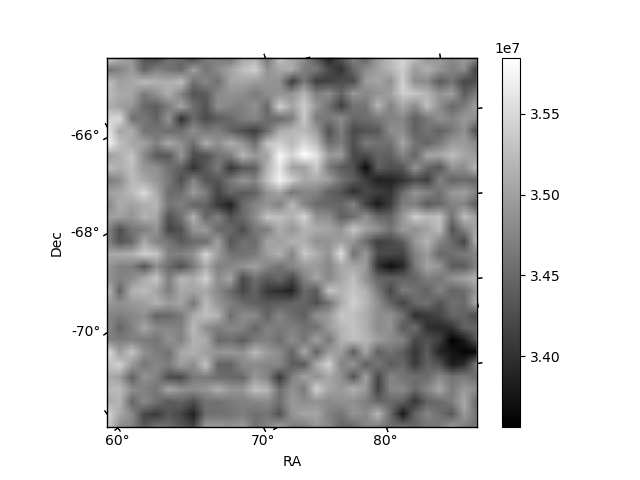
Quadrant B |
|---|---|---|---|
| Quadrant D | 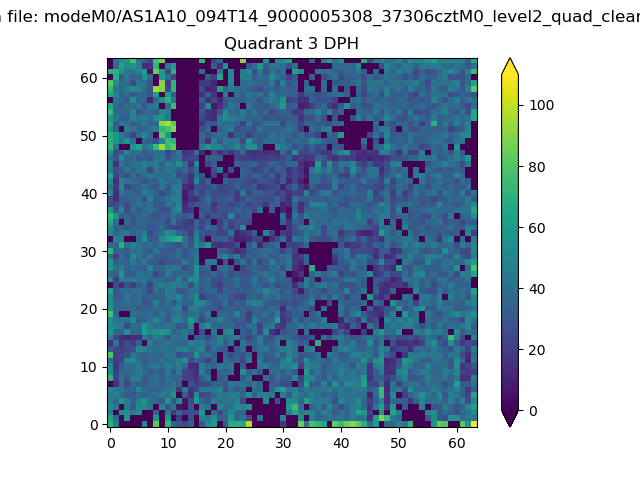 |
 |
Quadrant C |
| Plot type | Count rate plots | Images |
|---|---|---|
| Comparison with Poisson distribution Blue bars denote a histogram of data divided into 1 sec bins. Red curve is a Poisson curve with rate = median count rate of data. |
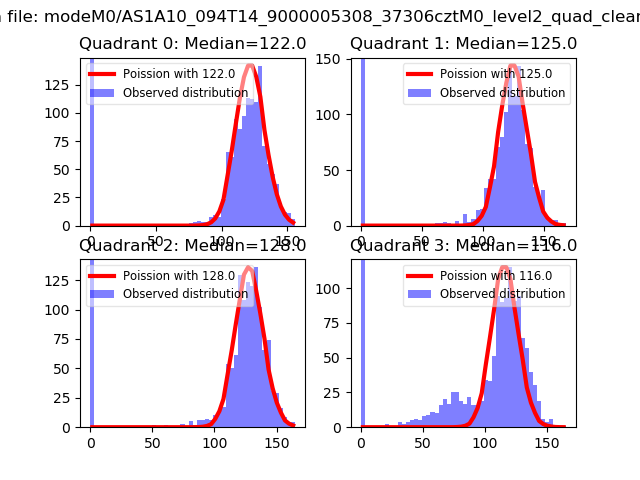 |
 |
| Quadrant-wise count rates Data is divided into 100 sec bins |
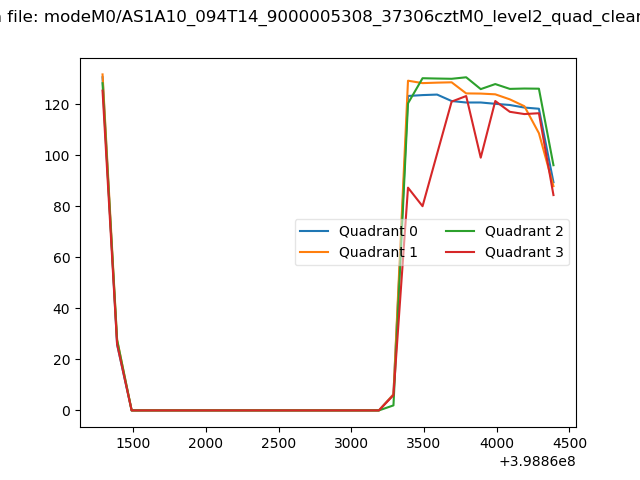 |
|
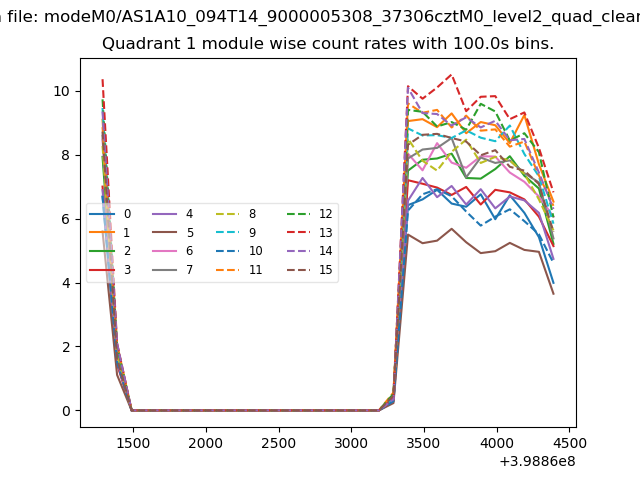
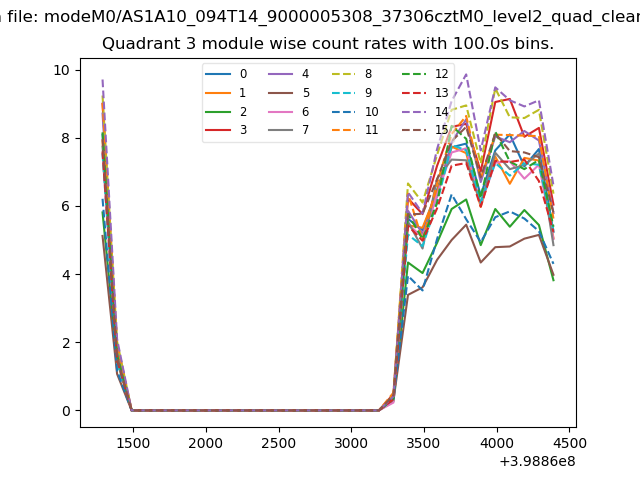
| Module-wise count rates for Quadrant A Data is divided into 100 sec bins |
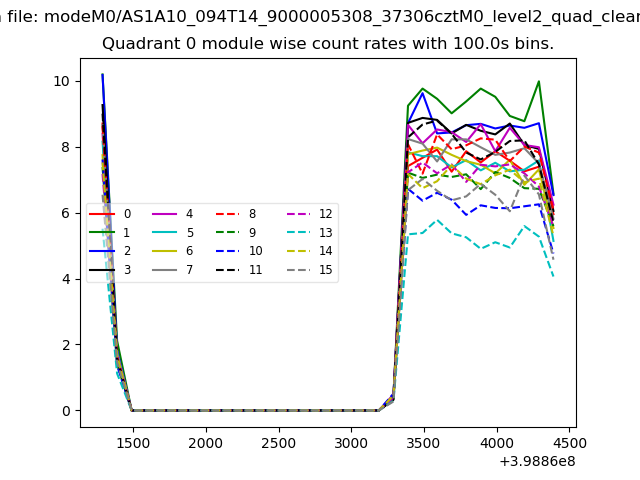 |
 |
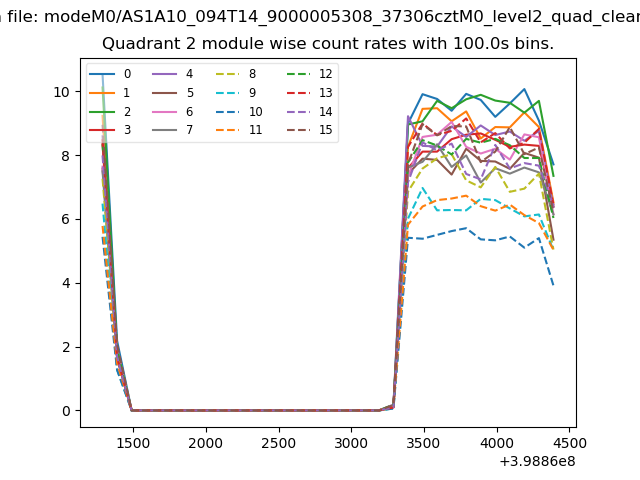
| Module-wise count rates for Quadrant B Data is divided into 100 sec bins |
 |
 |
| Module-wise count rates for Quadrant C Data is divided into 100 sec bins |
 |
 |
| Module-wise count rates for Quadrant D Data is divided into 100 sec bins |
 |
 |
| Parameter | Plot |
|---|---|
| CZT HV Monitor | 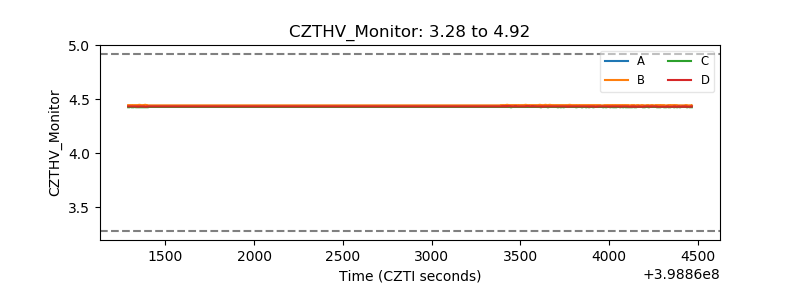 |
| D_VDD | 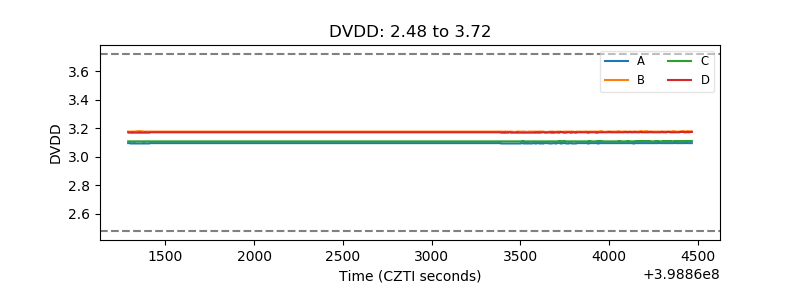 |
| Temperature 1 | 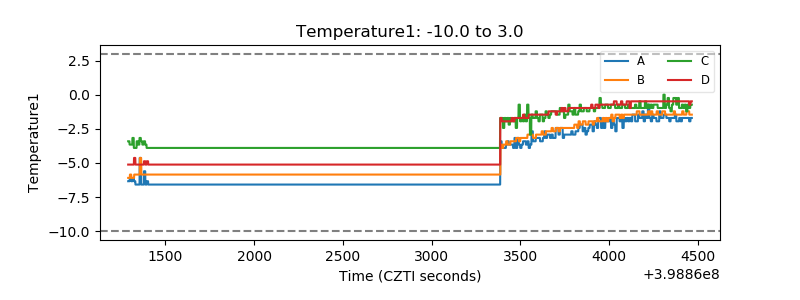 |
| Veto HV Monitor | 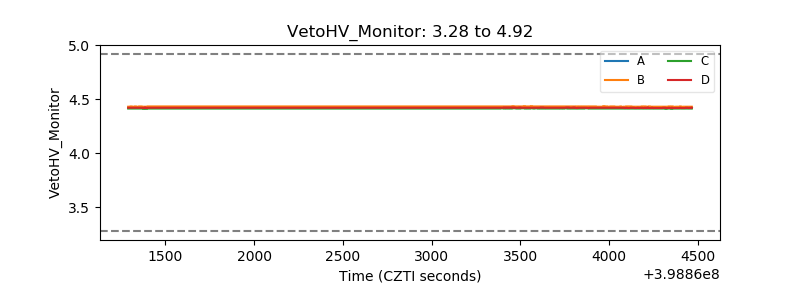 |
| Veto LLD | 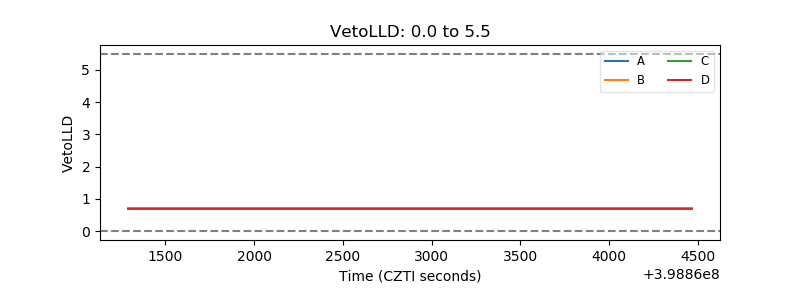 |
| Alpha Counter | 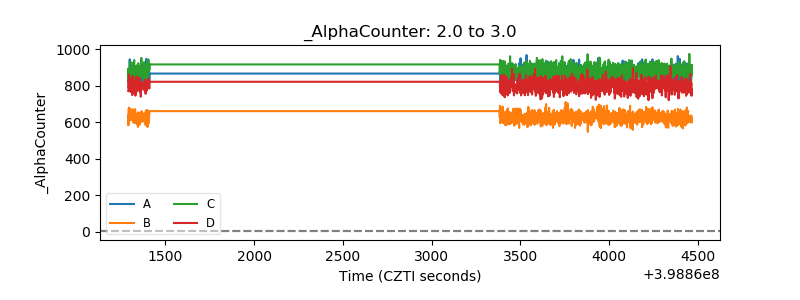 |
| _CPM_Rate | 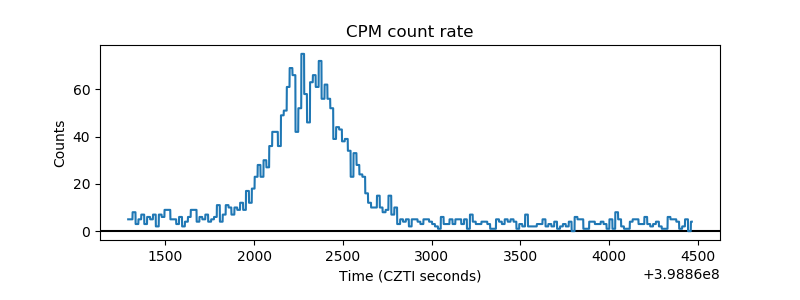 |
| CZT Counter | 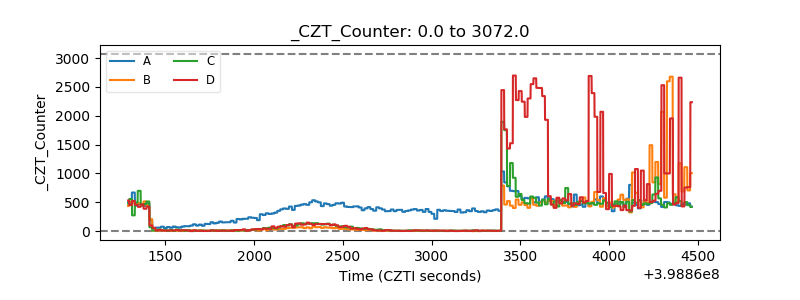 |
| +2.5 Volts monitor | 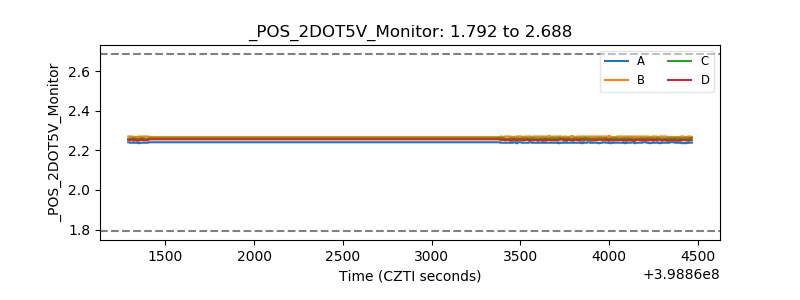 |
| +5 Volts monitor | 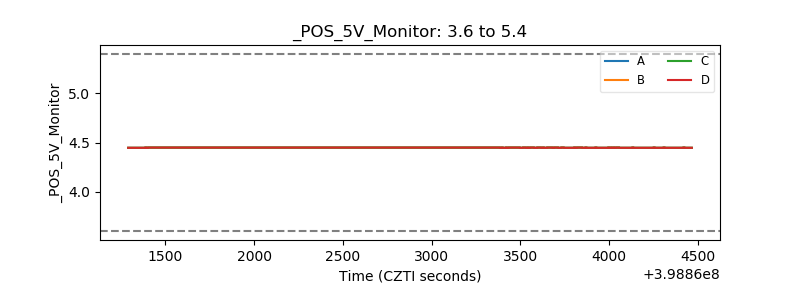 |
| _ROLL_ROT | 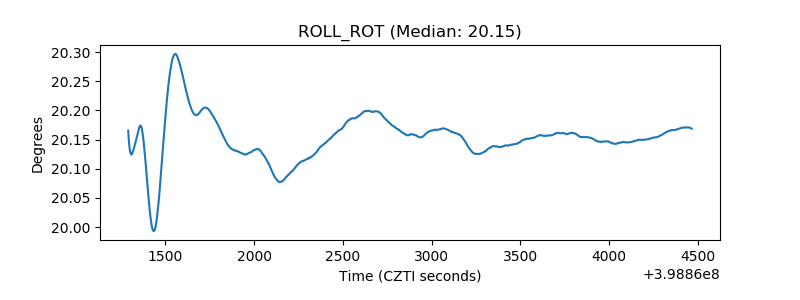 |
| _Roll_DEC | 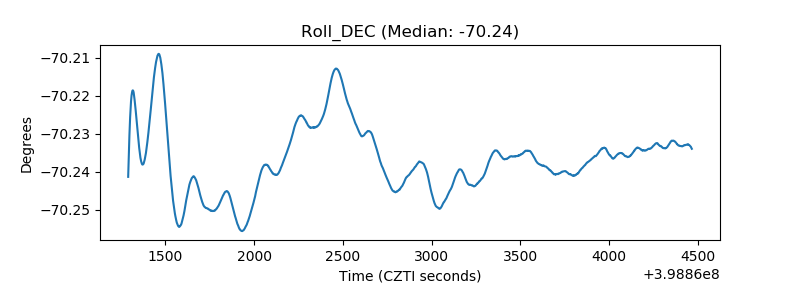 |
| _Roll_RA | 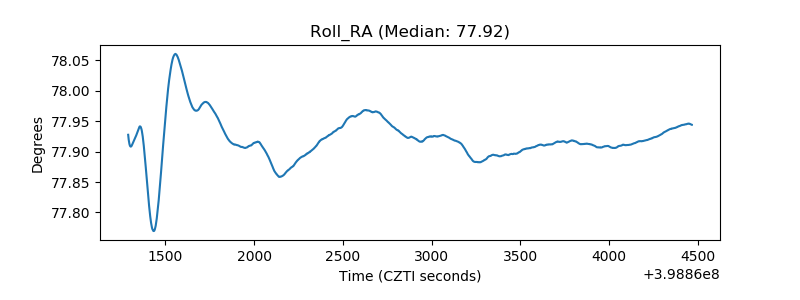 |
| Veto Counter | 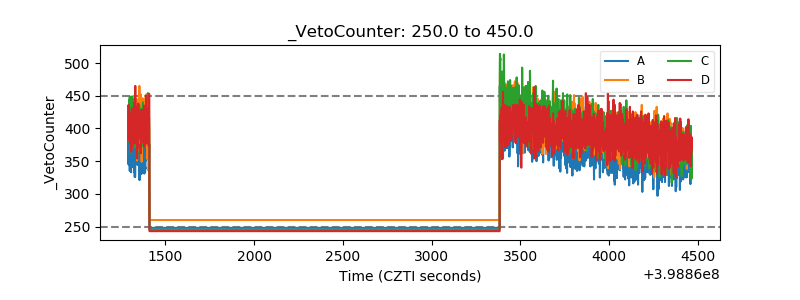 |