| Param | Original file | Final file |
|---|---|---|
| Filename | modeM0/AS1A10_094T14_9000005308_37307cztM0_level2.evt | modeM0/AS1A10_094T14_9000005308_37307cztM0_level2_quad_clean.evt |
| Size (bytes) | 275,497,920 | 56,710,080 |
| Size | 262.7 MB | 54.1 MB |
| Events in quadrant A | 1,538,236 | 379,255 |
| Events in quadrant B | 2,478,079 | 367,871 |
| Events in quadrant C | 1,471,527 | 393,754 |
| Events in quadrant D | 2,638,221 | 350,087 |
| Mode M0 | |||
|---|---|---|---|
| Quadrant | BADHDUFLAG | Total packets | Discarded packets |
| A | 0 | 6633 | 0 |
| B | 0 | 9502 | 0 |
| C | 0 | 6446 | 0 |
| D | 0 | 10090 | 0 |
| Mode SS | |||
|---|---|---|---|
| Quadrant | BADHDUFLAG | Total packets | Discarded packets |
| A | 0 | 62 | 0 |
| B | 0 | 62 | 0 |
| C | 0 | 62 | 0 |
| D | 0 | 62 | 0 |
| Quadrant | Total seconds | Saturated seconds | Saturation percentage |
|---|---|---|---|
| A | 3183 | 20 | 0.628338% |
| B | 3183 | 243 | 7.634307% |
| C | 3183 | 3 | 0.094251% |
| D | 3183 | 398 | 12.503927% |
Noise dominated data is calculated using 1-second bins in cleaned event files. If a bin has >2000 counts, and if more than 50% of those come from <1% of pixels, then it is considered to be noise-dominated and hence unusable.
| Quadrant | # 1 sec bins | Bins with >0 counts | Bins with >2000 counts | High rate bins dominated by noise | Noise dominated (total time) | Noise dominated (detector-on time) | Marked lightcurve |
|---|---|---|---|---|---|---|---|
| A | 3183 | 3183 | 17 | 17 | 0.53% | 0.53% | 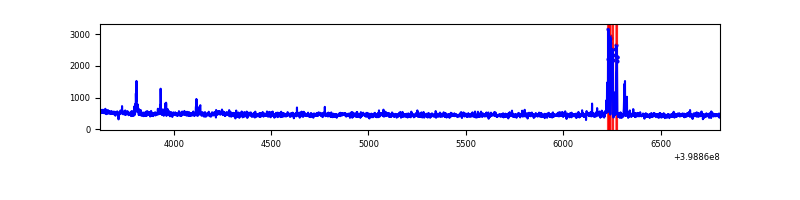 |
| B | 3183 | 3183 | 175 | 175 | 5.50% | 5.50% | 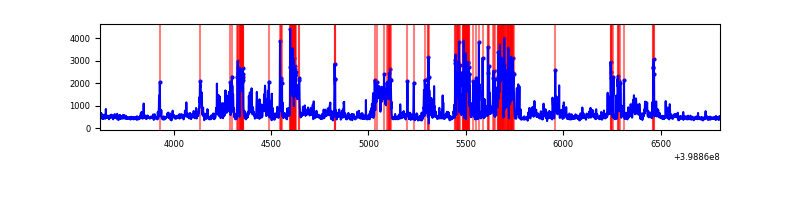 |
| C | 3183 | 3183 | 3 | 3 | 0.09% | 0.09% | 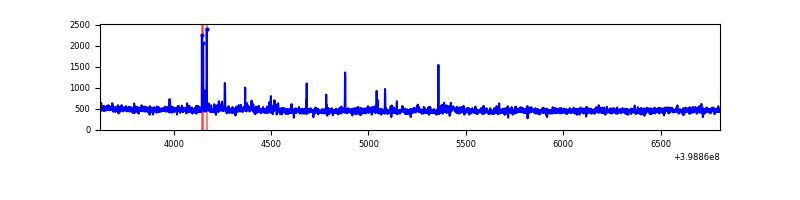 |
| D | 3183 | 3183 | 379 | 379 | 11.91% | 11.91% | 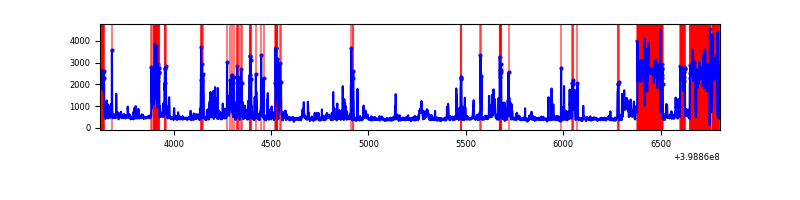 |
Top three noisy pixels from each quadrant. If the there are fewer than three noisy pixels in the level2.evt file, extra rows are filled as -1
| Pixel properties | Quadrant properties | ||||||
|---|---|---|---|---|---|---|---|
| Quadrant | DetID | PixID | Counts | Sigma | Mean | Median | Sigma |
| A | 10 | 83 | 109974 | 1567.52 | 340 | 332 | 69.9 |
| A | 13 | 248 | 81729 | 1163.71 | 340 | 332 | 69.9 |
| A | 15 | 222 | 13093 | 182.44 | 340 | 332 | 69.9 |
| B | 5 | 172 | 419518 | 6562.27 | 327 | 319 | 63.9 |
| B | 4 | 171 | 335753 | 5250.99 | 327 | 319 | 63.9 |
| B | 0 | 213 | 168226 | 2628.47 | 327 | 319 | 63.9 |
| C | 15 | 214 | 130826 | 1661.21 | 331 | 332 | 78.6 |
| C | 14 | 254 | 24308 | 305.22 | 331 | 332 | 78.6 |
| C | 1 | 23 | 18781 | 234.86 | 331 | 332 | 78.6 |
| D | 13 | 249 | 855631 | 11194.0 | 311 | 301 | 76.4 |
| D | 10 | 253 | 222899 | 2913.22 | 311 | 301 | 76.4 |
| D | 2 | 249 | 158750 | 2073.68 | 311 | 301 | 76.4 |
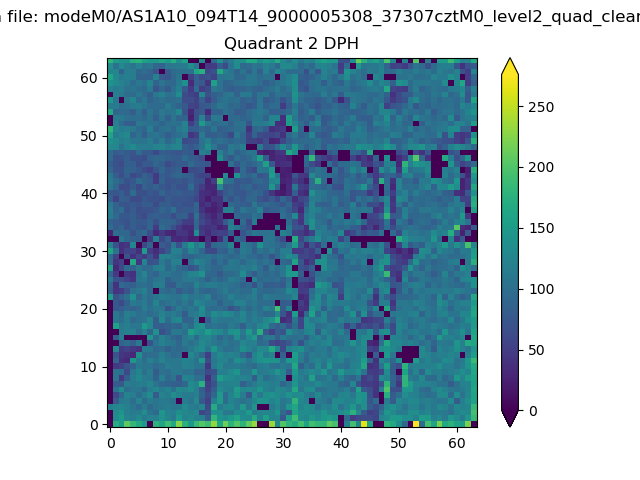
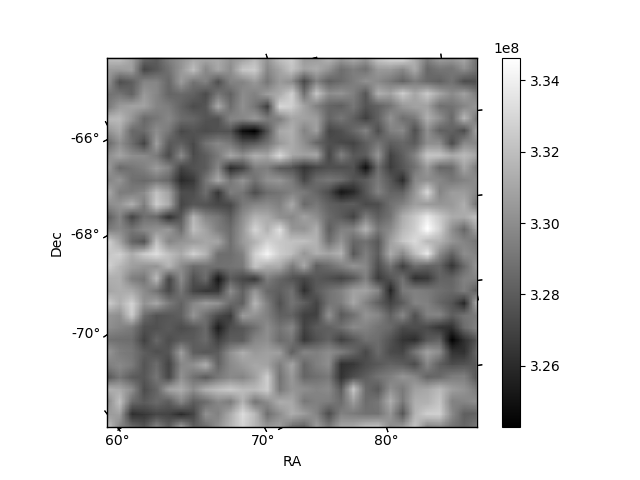
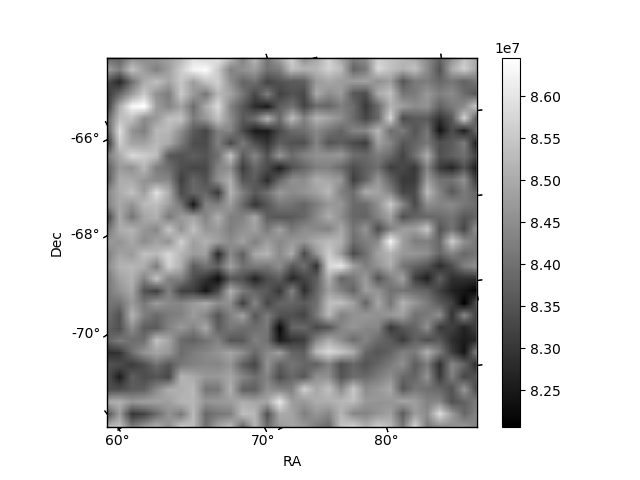
Histogram calculated using DETX and DETY for each event in the final _common_clean file
| Quadrant A | 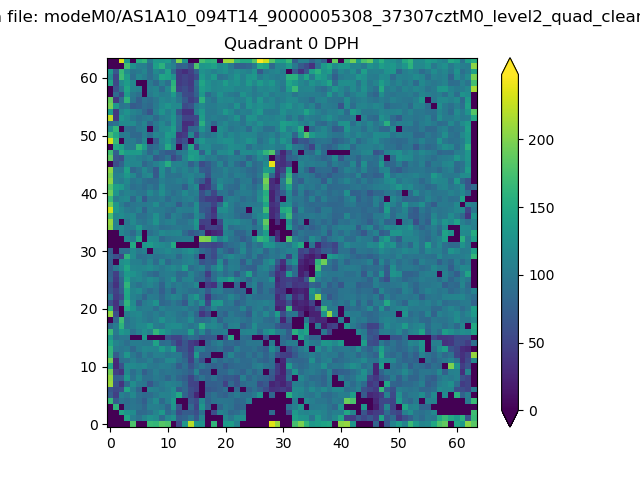 |
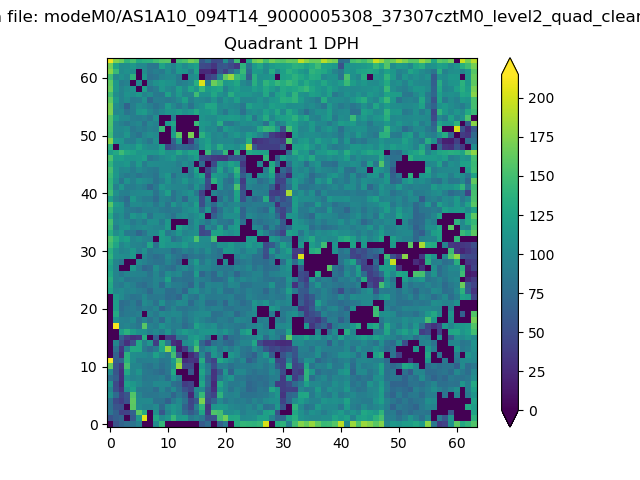 |
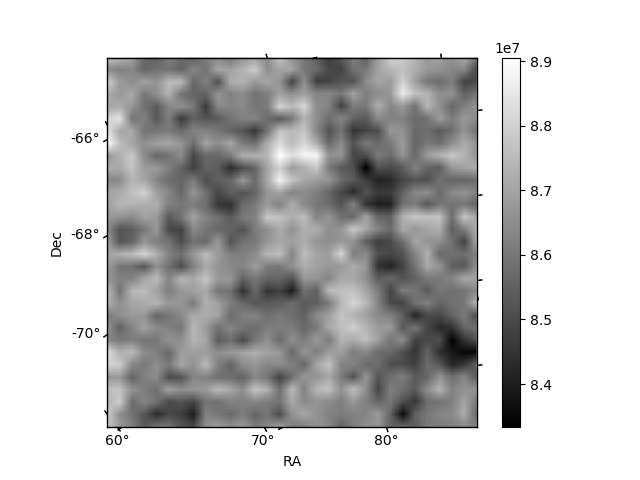
Quadrant B |
|---|---|---|---|
| Quadrant D | 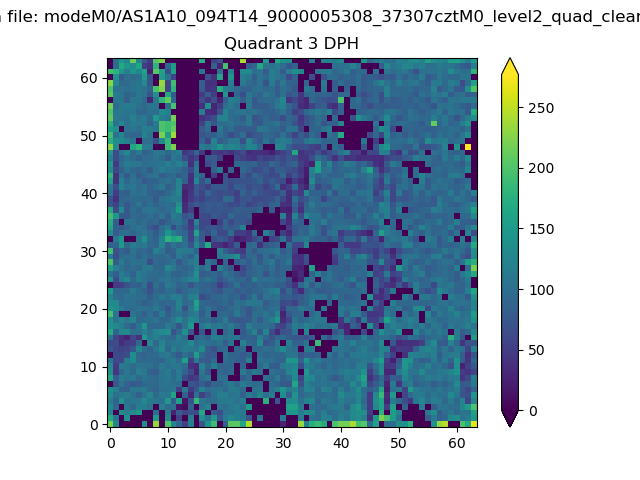 |
 |
Quadrant C |
| Plot type | Count rate plots | Images |
|---|---|---|
| Comparison with Poisson distribution Blue bars denote a histogram of data divided into 1 sec bins. Red curve is a Poisson curve with rate = median count rate of data. |
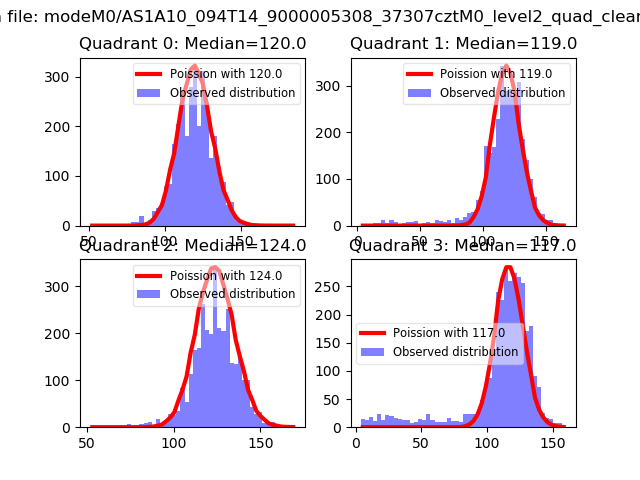 |
 |
| Quadrant-wise count rates Data is divided into 100 sec bins |
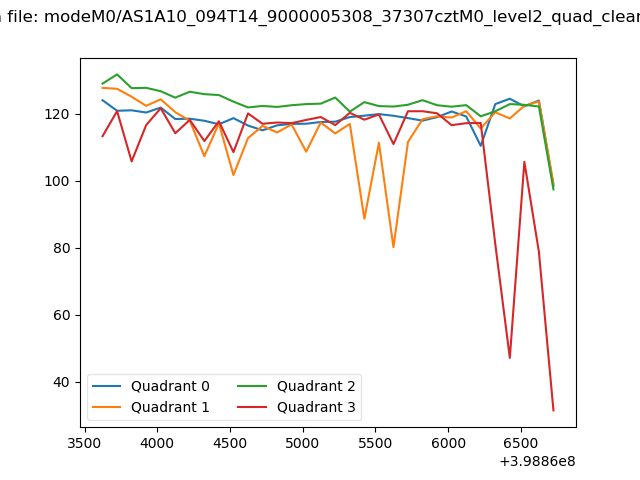 |
|
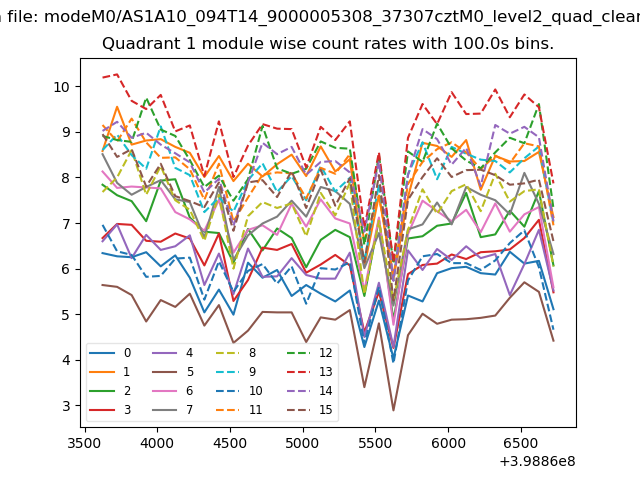
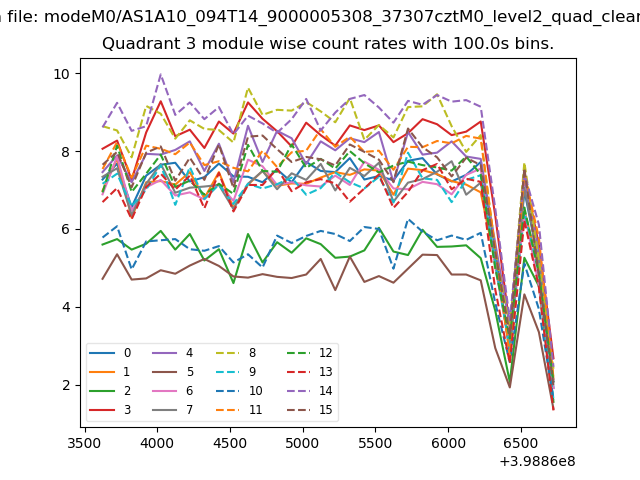
| Module-wise count rates for Quadrant A Data is divided into 100 sec bins |
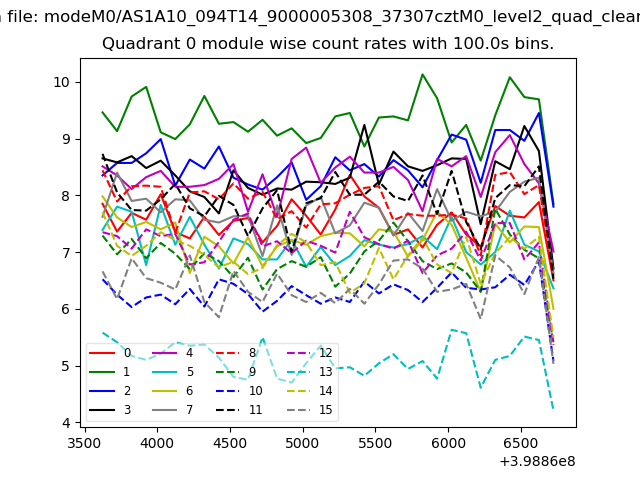 |
 |
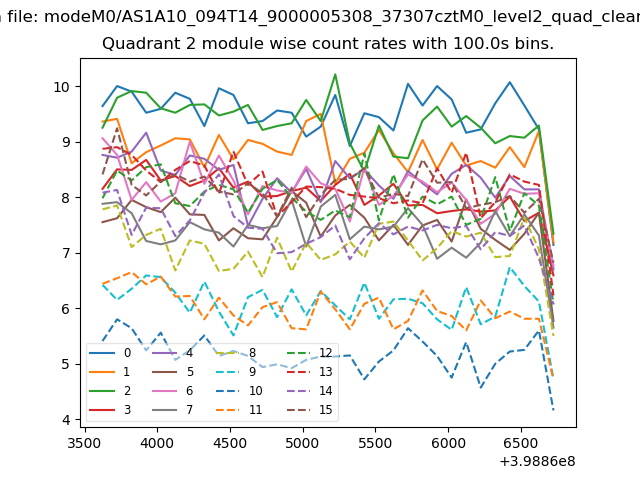
| Module-wise count rates for Quadrant B Data is divided into 100 sec bins |
 |
 |
| Module-wise count rates for Quadrant C Data is divided into 100 sec bins |
 |
 |
| Module-wise count rates for Quadrant D Data is divided into 100 sec bins |
 |
 |
| Parameter | Plot |
|---|---|
| CZT HV Monitor | 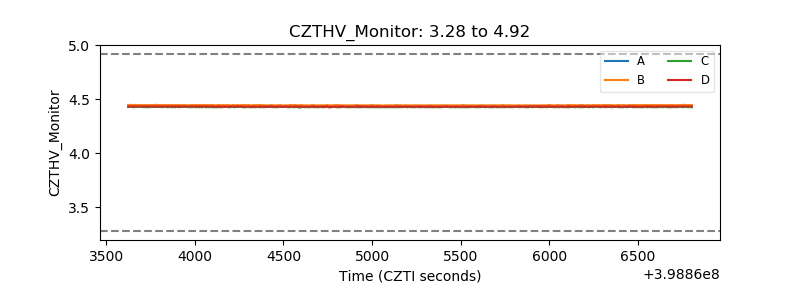 |
| D_VDD | 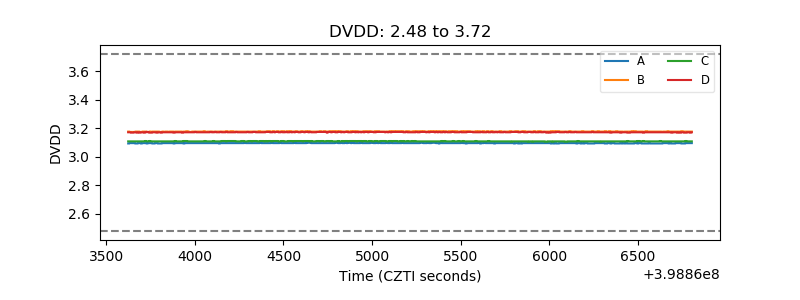 |
| Temperature 1 | 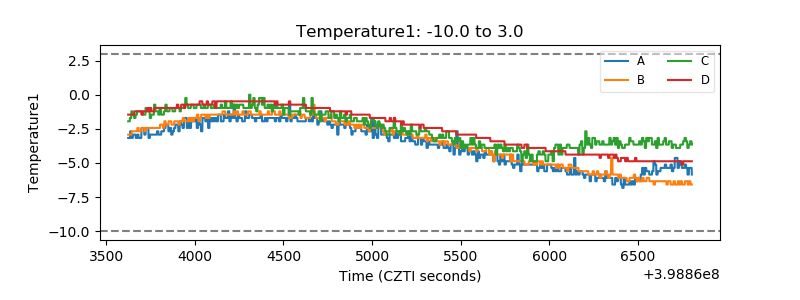 |
| Veto HV Monitor | 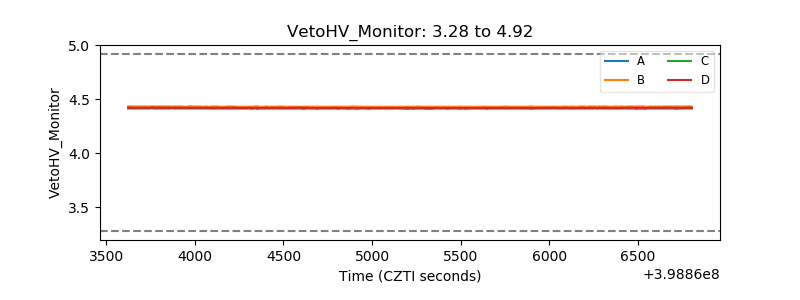 |
| Veto LLD | 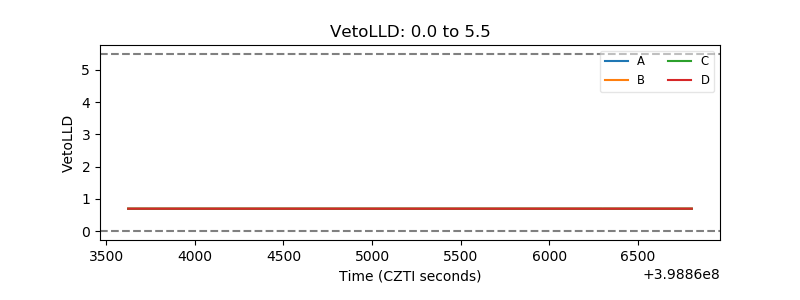 |
| Alpha Counter | 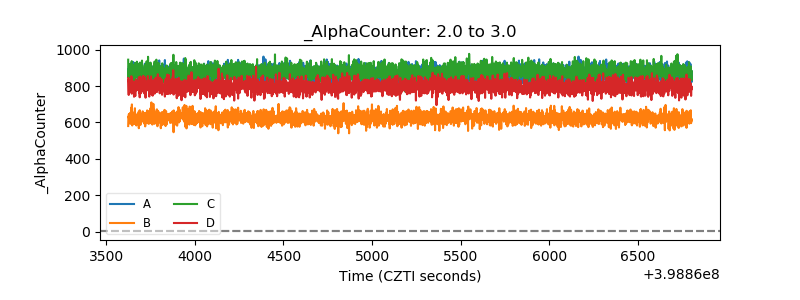 |
| _CPM_Rate | 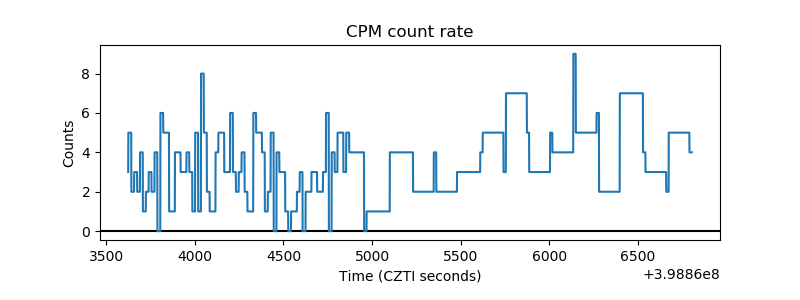 |
| CZT Counter | 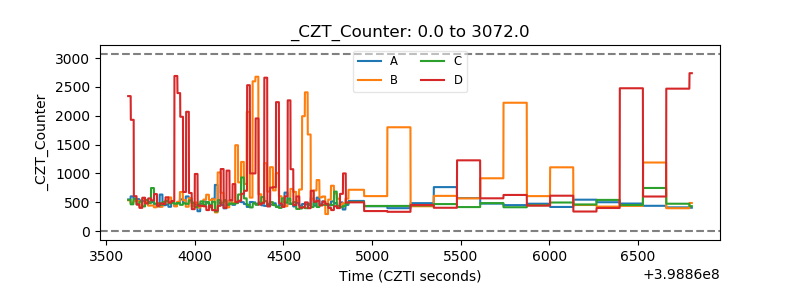 |
| +2.5 Volts monitor | 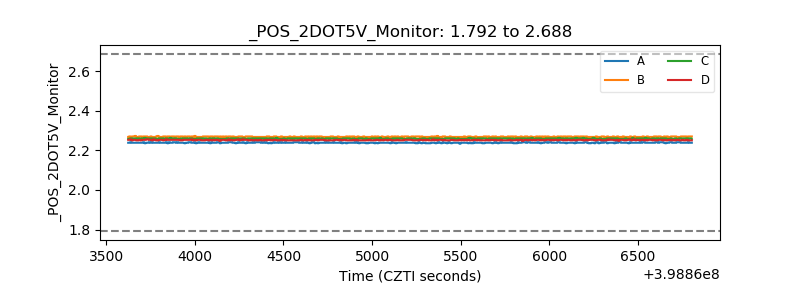 |
| +5 Volts monitor | 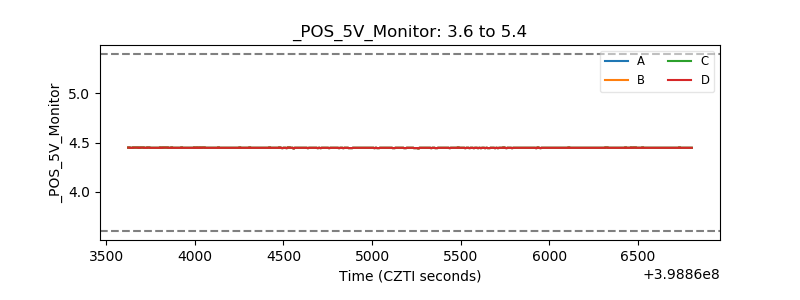 |
| _ROLL_ROT | 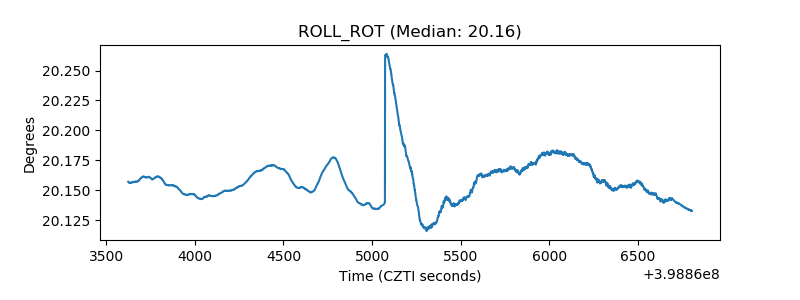 |
| _Roll_DEC | 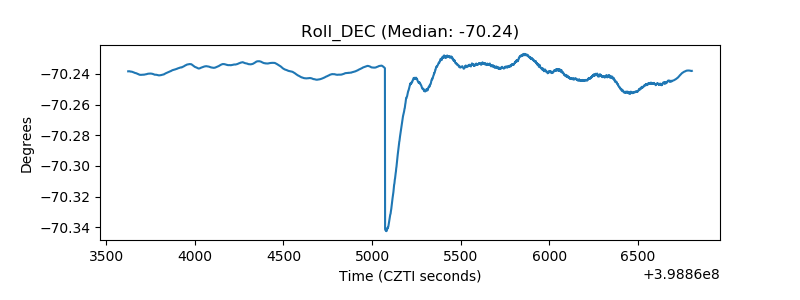 |
| _Roll_RA | 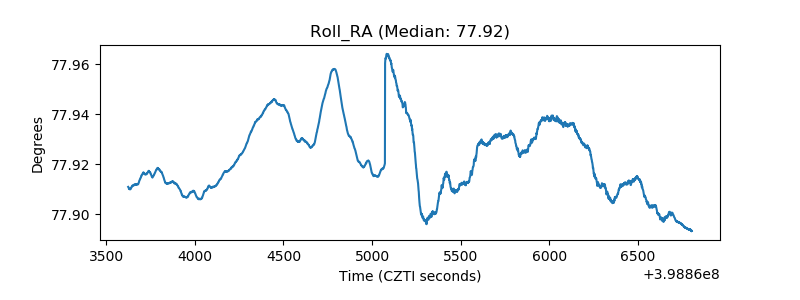 |
| Veto Counter | 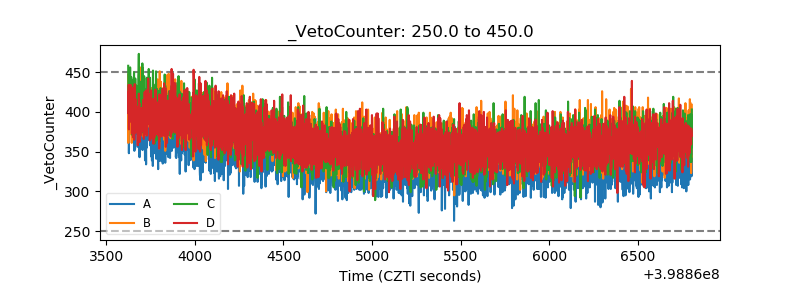 |