| Param | Original file | Final file |
|---|---|---|
| Filename | modeM0/AS1A10_094T23_9000005304cztM0_level2.fits | modeM0/AS1A10_094T23_9000005304cztM0_level2_quad_clean.evt |
| Size (bytes) | 82,192,320 | 98,763,840 |
| Size | 78.4 MB | 94.2 MB |
| Events in quadrant A | 505,084 | 625,900 |
| Events in quadrant B | 476,048 | 605,037 |
| Events in quadrant C | 502,220 | 628,986 |
| Events in quadrant D | 433,926 | 558,335 |
| Mode SS | |||
|---|---|---|---|
| Quadrant | BADHDUFLAG | Total packets | Discarded packets |
| A | 0 | 168 | 0 |
| B | 0 | 168 | 0 |
| C | 0 | 168 | 0 |
| D | 0 | 168 | 0 |
| Mode M0 | |||
|---|---|---|---|
| Quadrant | BADHDUFLAG | Total packets | Discarded packets |
| A | 0 | 17307 | 0 |
| B | 0 | 19091 | 0 |
| C | 0 | 17343 | 0 |
| D | 0 | 22154 | 0 |
| Mode M9 | |||
|---|---|---|---|
| Quadrant | BADHDUFLAG | Total packets | Discarded packets |
| A | 0 | 35 | 0 |
| B | 0 | 35 | 0 |
| C | 0 | 35 | 0 |
| D | 0 | 35 | 0 |
| Quadrant | Total seconds | Saturated seconds | Saturation percentage |
|---|---|---|---|
| A | 8229 | 13 | 0.157978% |
| B | 8229 | 250 | 3.038036% |
| C | 8229 | 43 | 0.522542% |
| D | 8229 | 356 | 4.326164% |
Noise dominated data is calculated using 1-second bins in cleaned event files. If a bin has >2000 counts, and if more than 50% of those come from <1% of pixels, then it is considered to be noise-dominated and hence unusable.
| Quadrant | # 1 sec bins | Bins with >0 counts | Bins with >2000 counts | High rate bins dominated by noise | Noise dominated (total time) | Noise dominated (detector-on time) | Marked lightcurve |
|---|---|---|---|---|---|---|---|
| A | 10351 | 8228 | 0 | 0 | 0.00% | 0.00% |  |
| B | 10351 | 8228 | 0 | 0 | 0.00% | 0.00% |  |
| C | 10351 | 8228 | 0 | 0 | 0.00% | 0.00% |  |
| D | 10351 | 8228 | 0 | 0 | 0.00% | 0.00% |  |
Top three noisy pixels from each quadrant. If the there are fewer than three noisy pixels in the level2.evt file, extra rows are filled as -1
| Pixel properties | Quadrant properties | ||||||
|---|---|---|---|---|---|---|---|
| Quadrant | DetID | PixID | Counts | Sigma | Mean | Median | Sigma |
| A | 7 | 110 | 416 | 8.55 | 132 | 125 | 34.0 |
| A | 0 | 29 | 396 | 7.96 | 132 | 125 | 34.0 |
| A | 9 | 19 | 395 | 7.93 | 132 | 125 | 34.0 |
| B | 3 | 80 | 400 | 10.37 | 126 | 121 | 26.9 |
| B | 2 | 9 | 389 | 9.96 | 126 | 121 | 26.9 |
| B | 5 | 128 | 362 | 8.96 | 126 | 121 | 26.9 |
| C | 3 | 203 | 427 | 8.42 | 132 | 126 | 35.7 |
| C | 3 | 202 | 419 | 8.2 | 132 | 126 | 35.7 |
| C | 1 | 80 | 405 | 7.81 | 132 | 126 | 35.7 |
| D | 10 | 189 | 351 | 6.77 | 124 | 114 | 35.0 |
| D | 7 | 3 | 320 | 5.88 | 124 | 114 | 35.0 |
| D | 6 | 231 | 309 | 5.57 | 124 | 114 | 35.0 |
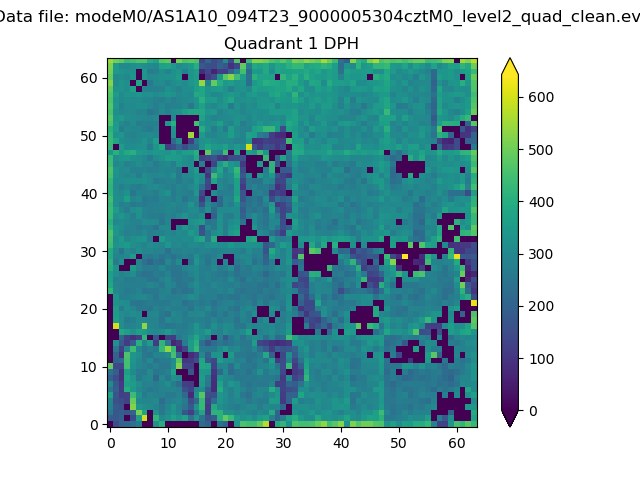
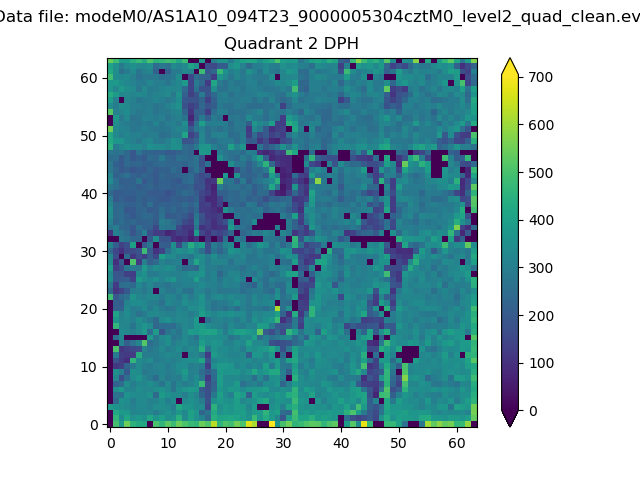
Histogram calculated using DETX and DETY for each event in the final _common_clean file
| Quadrant A |  |
 |
Quadrant B |
|---|---|---|---|
| Quadrant D |  |
 |
Quadrant C |
| Plot type | Count rate plots | Images |
|---|---|---|
| Comparison with Poisson distribution Blue bars denote a histogram of data divided into 1 sec bins. Red curve is a Poisson curve with rate = median count rate of data. |
 |
 |
| Quadrant-wise count rates Data is divided into 100 sec bins |
 |
|
| Module-wise count rates for Quadrant A Data is divided into 100 sec bins |
 |
 |
| Module-wise count rates for Quadrant B Data is divided into 100 sec bins |
 |
 |
| Module-wise count rates for Quadrant C Data is divided into 100 sec bins |
 |
 |
| Module-wise count rates for Quadrant D Data is divided into 100 sec bins |
 |
 |
| Parameter | Plot |
|---|---|
| CZT HV Monitor |  |
| D_VDD |  |
| Temperature 1 |  |
| Veto HV Monitor |  |
| Veto LLD |  |
| Alpha Counter |  |
| _CPM_Rate |  |
| CZT Counter |  |
| +2.5 Volts monitor |  |
| +5 Volts monitor |  |
| _ROLL_ROT |  |
| _Roll_DEC |  |
| _Roll_RA |  |
| Veto Counter |  |