| Param | Original file | Final file |
|---|---|---|
| Filename | modeM0/AS1A10_094T23_9000005304_37303cztM0_level2.evt | modeM0/AS1A10_094T23_9000005304_37303cztM0_level2_quad_clean.evt |
| Size (bytes) | 73,215,360 | 18,187,200 |
| Size | 69.8 MB | 17.3 MB |
| Events in quadrant A | 483,205 | 121,994 |
| Events in quadrant B | 418,878 | 126,510 |
| Events in quadrant C | 519,407 | 124,318 |
| Events in quadrant D | 738,058 | 113,786 |
| Mode SS | |||
|---|---|---|---|
| Quadrant | BADHDUFLAG | Total packets | Discarded packets |
| A | 0 | 16 | 0 |
| B | 0 | 16 | 0 |
| C | 0 | 16 | 0 |
| D | 0 | 16 | 0 |
| Mode M0 | |||
|---|---|---|---|
| Quadrant | BADHDUFLAG | Total packets | Discarded packets |
| A | 0 | 1919 | 2 |
| B | 0 | 1672 | 1 |
| C | 0 | 2005 | 1 |
| D | 0 | 2708 | 1 |
| Mode M9 | |||
|---|---|---|---|
| Quadrant | BADHDUFLAG | Total packets | Discarded packets |
| A | 0 | 14 | 0 |
| B | 0 | 14 | 0 |
| C | 0 | 14 | 0 |
| D | 0 | 14 | 0 |
| Quadrant | Total seconds | Saturated seconds | Saturation percentage |
|---|---|---|---|
| A | 806 | 2 | 0.248139% |
| B | 806 | 3 | 0.372208% |
| C | 806 | 23 | 2.853598% |
| D | 806 | 107 | 13.275434% |
Noise dominated data is calculated using 1-second bins in cleaned event files. If a bin has >2000 counts, and if more than 50% of those come from <1% of pixels, then it is considered to be noise-dominated and hence unusable.
| Quadrant | # 1 sec bins | Bins with >0 counts | Bins with >2000 counts | High rate bins dominated by noise | Noise dominated (total time) | Noise dominated (detector-on time) | Marked lightcurve |
|---|---|---|---|---|---|---|---|
| A | 806 | 806 | 1 | 1 | 0.12% | 0.12% | 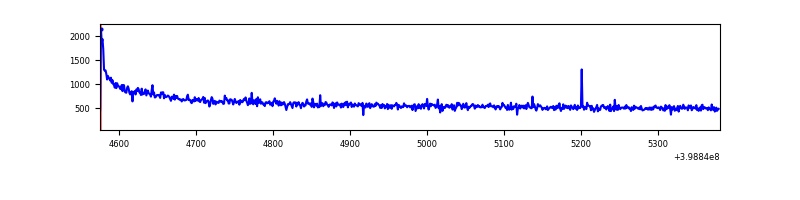 |
| B | 806 | 806 | 1 | 1 | 0.12% | 0.12% | 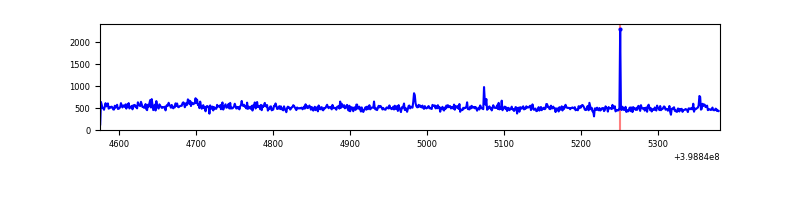 |
| C | 806 | 806 | 17 | 17 | 2.11% | 2.11% | 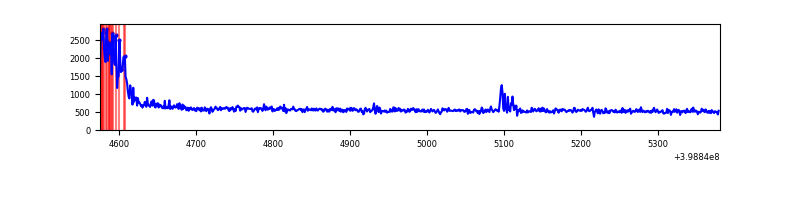 |
| D | 806 | 806 | 106 | 106 | 13.15% | 13.15% | 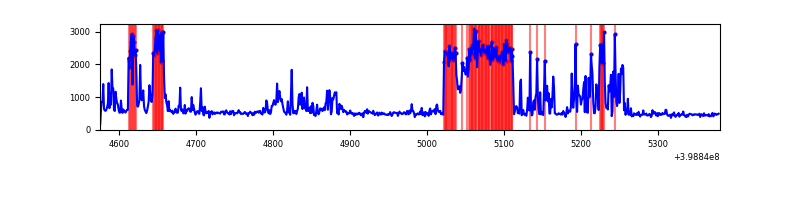 |
Top three noisy pixels from each quadrant. If the there are fewer than three noisy pixels in the level2.evt file, extra rows are filled as -1
| Pixel properties | Quadrant properties | ||||||
|---|---|---|---|---|---|---|---|
| Quadrant | DetID | PixID | Counts | Sigma | Mean | Median | Sigma |
| A | 10 | 83 | 84305 | 3817.68 | 102 | 100 | 22.1 |
| A | 10 | 67 | 2200 | 95.21 | 102 | 100 | 22.1 |
| A | 13 | 254 | 1296 | 54.22 | 102 | 100 | 22.1 |
| B | 0 | 213 | 12350 | 587.44 | 101 | 99 | 20.9 |
| B | 5 | 255 | 3855 | 180.1 | 101 | 99 | 20.9 |
| B | 12 | 18 | 2551 | 117.57 | 101 | 99 | 20.9 |
| C | 0 | 10 | 68234 | 2670.07 | 103 | 104 | 25.5 |
| C | 15 | 214 | 38713 | 1513.12 | 103 | 104 | 25.5 |
| C | 1 | 23 | 6503 | 250.78 | 103 | 104 | 25.5 |
| D | 12 | 227 | 201708 | 7796.23 | 99 | 96 | 25.9 |
| D | 2 | 249 | 104185 | 4025.07 | 99 | 96 | 25.9 |
| D | 10 | 253 | 27291 | 1051.62 | 99 | 96 | 25.9 |
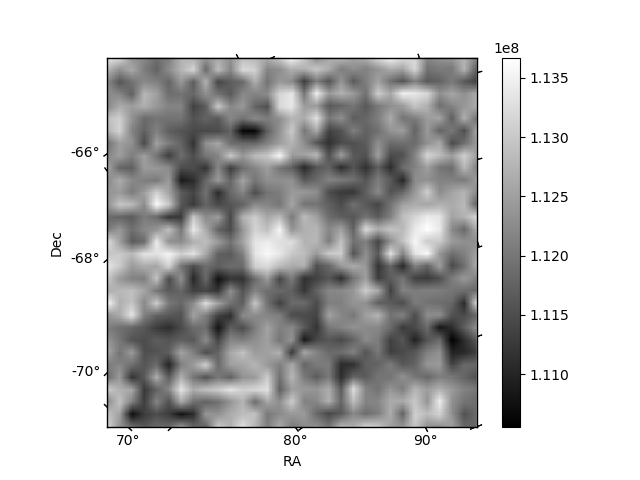
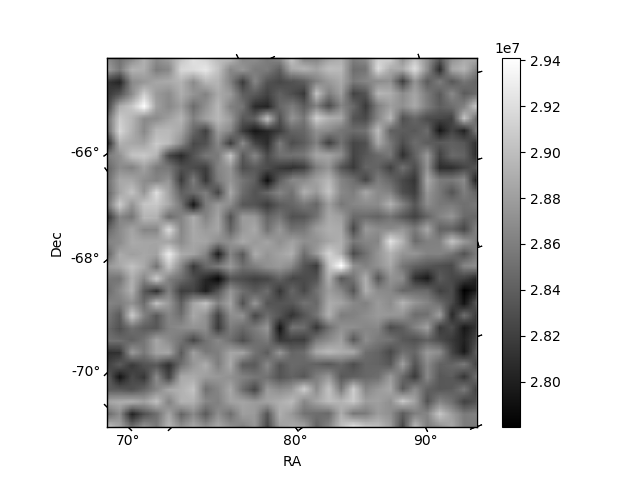
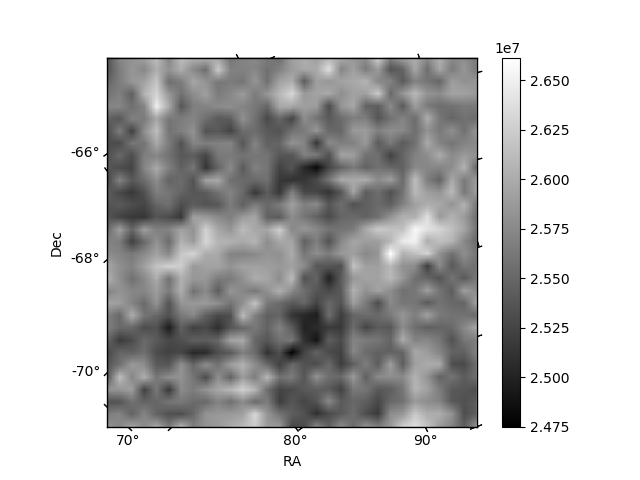
Histogram calculated using DETX and DETY for each event in the final _common_clean file
| Quadrant A | 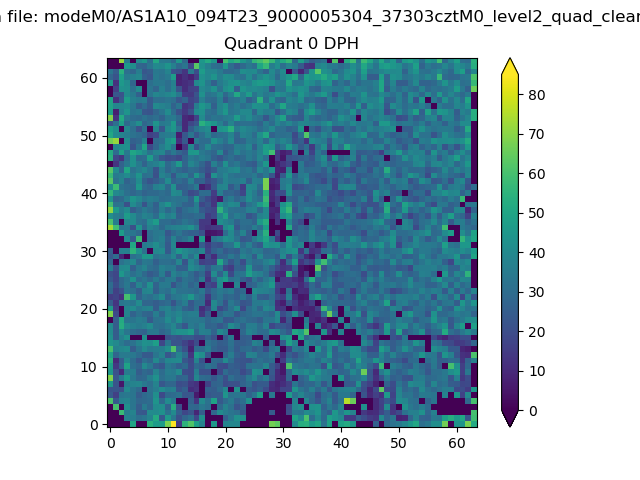 |
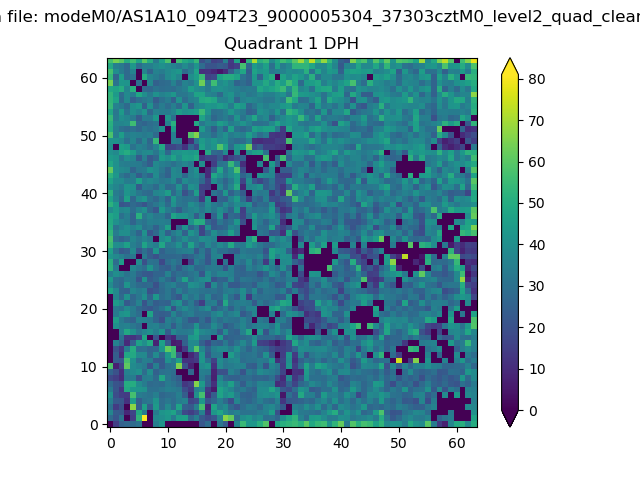 |
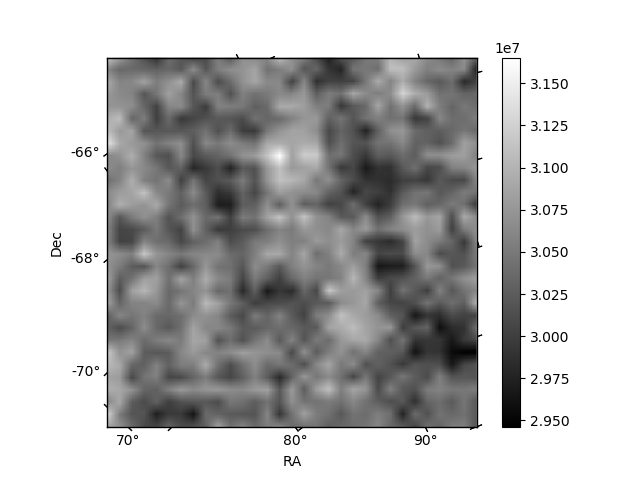
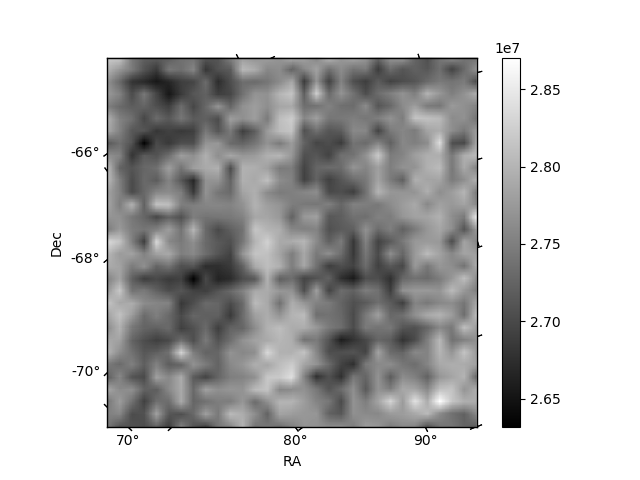
Quadrant B |
|---|---|---|---|
| Quadrant D | 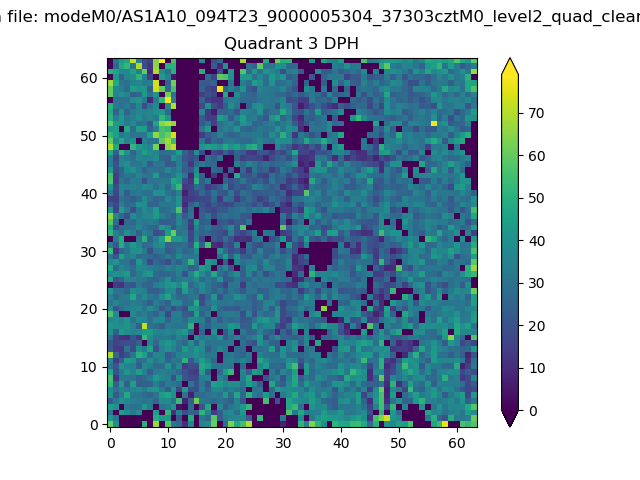 |
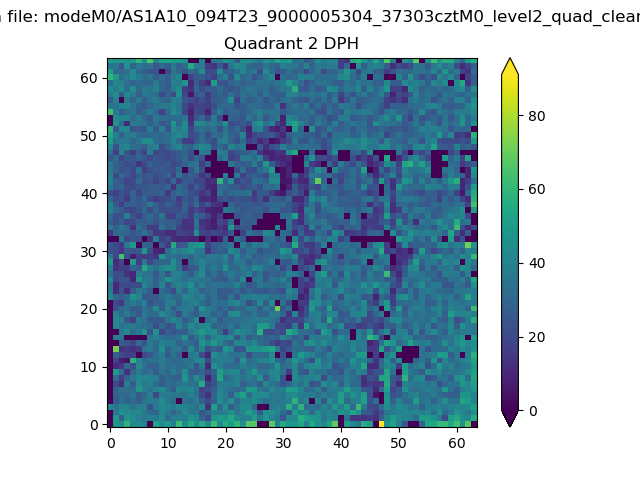 |
Quadrant C |
| Plot type | Count rate plots | Images |
|---|---|---|
| Comparison with Poisson distribution Blue bars denote a histogram of data divided into 1 sec bins. Red curve is a Poisson curve with rate = median count rate of data. |
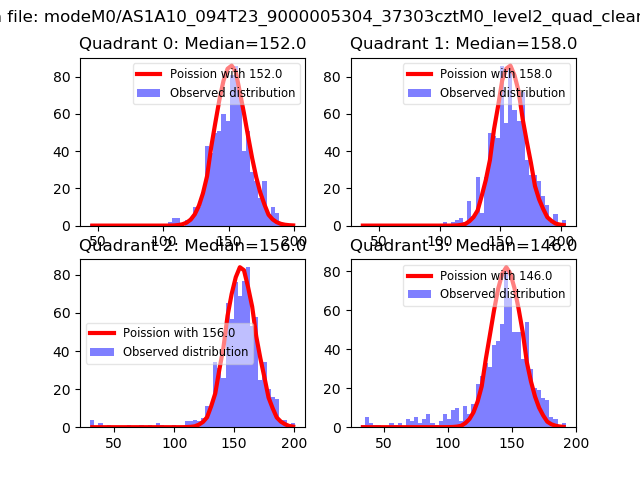 |
 |
| Quadrant-wise count rates Data is divided into 100 sec bins |
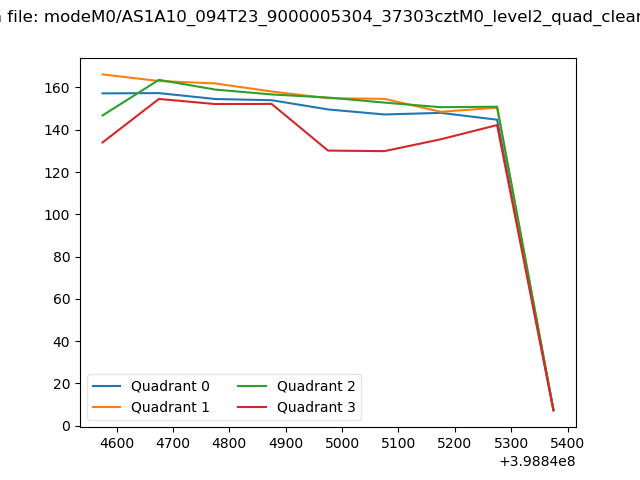 |
|
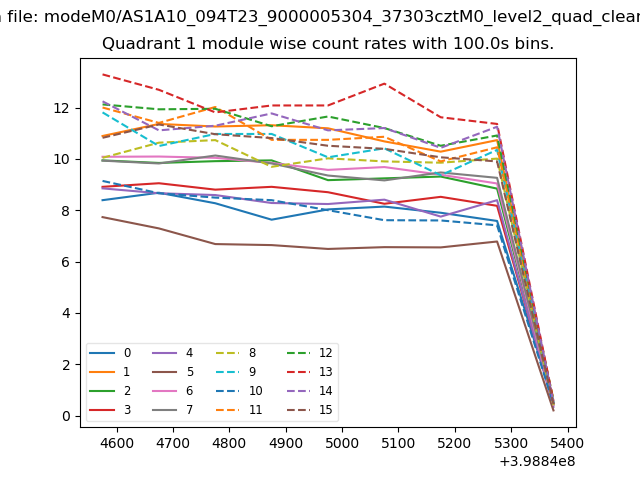
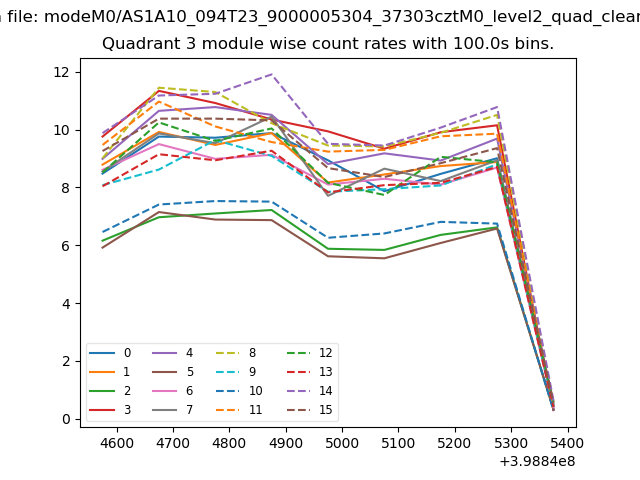
| Module-wise count rates for Quadrant A Data is divided into 100 sec bins |
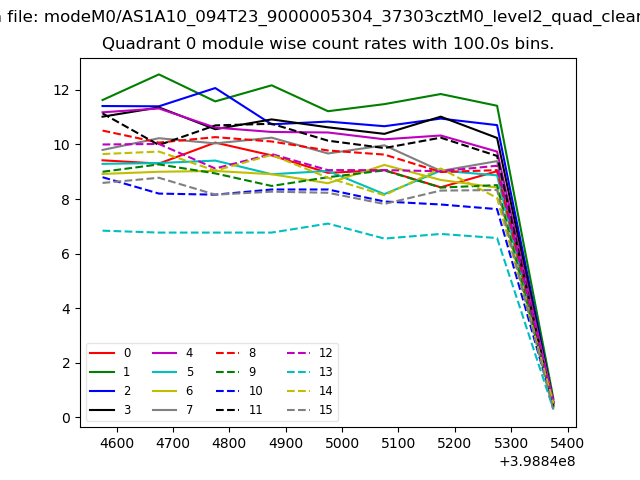 |
 |
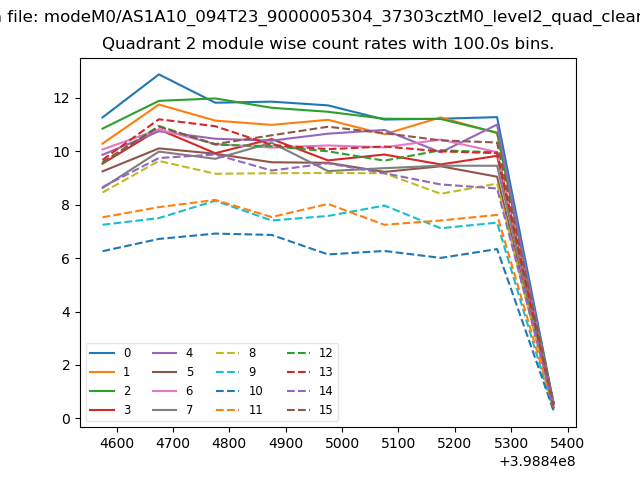
| Module-wise count rates for Quadrant B Data is divided into 100 sec bins |
 |
 |
| Module-wise count rates for Quadrant C Data is divided into 100 sec bins |
 |
 |
| Module-wise count rates for Quadrant D Data is divided into 100 sec bins |
 |
 |
| Parameter | Plot |
|---|---|
| CZT HV Monitor | 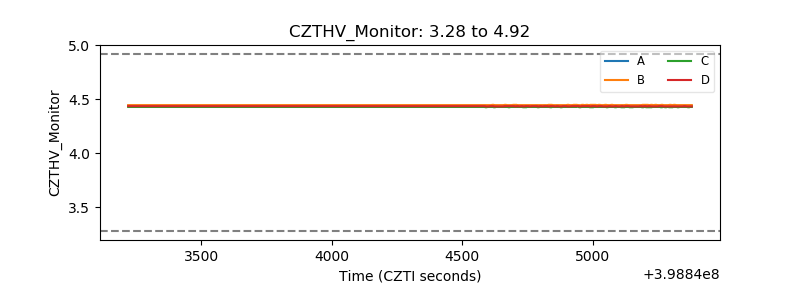 |
| D_VDD | 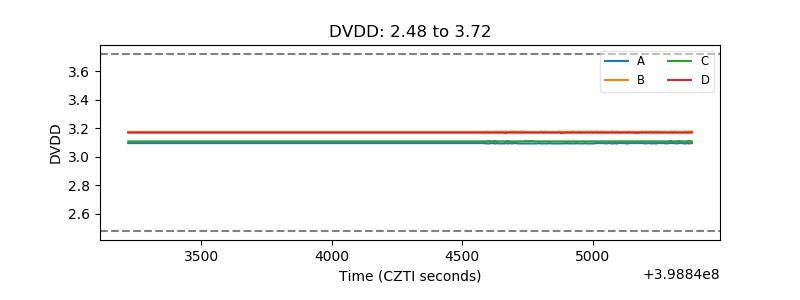 |
| Temperature 1 | 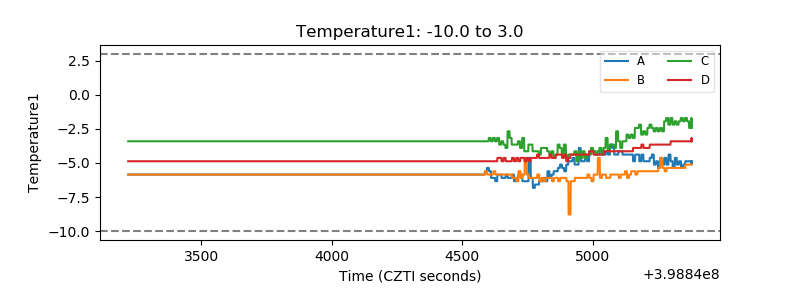 |
| Veto HV Monitor | 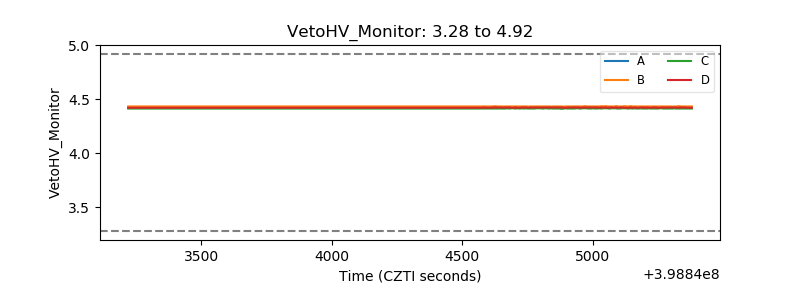 |
| Veto LLD | 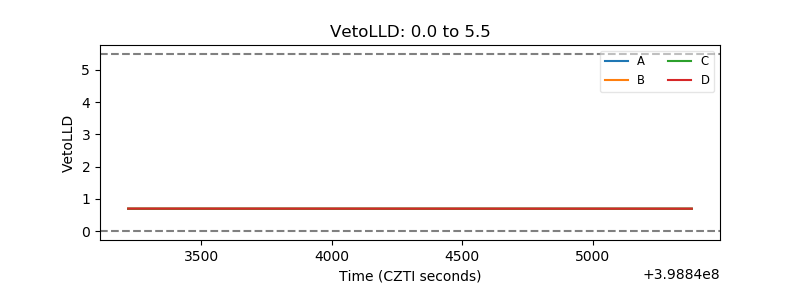 |
| Alpha Counter | 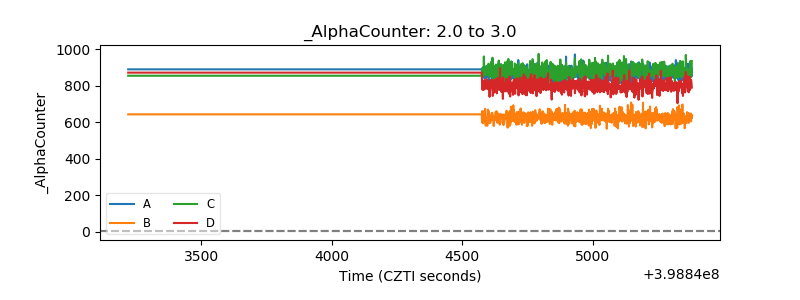 |
| _CPM_Rate |  |
| CZT Counter | 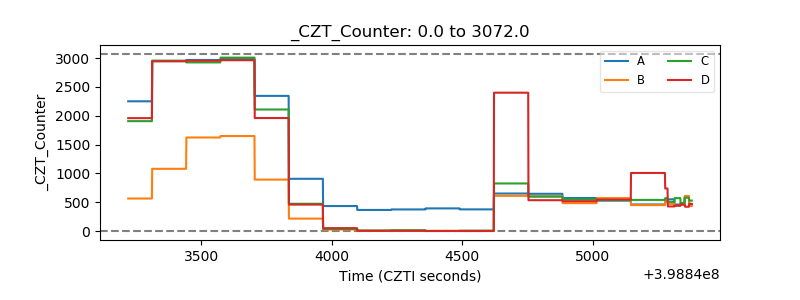 |
| +2.5 Volts monitor | 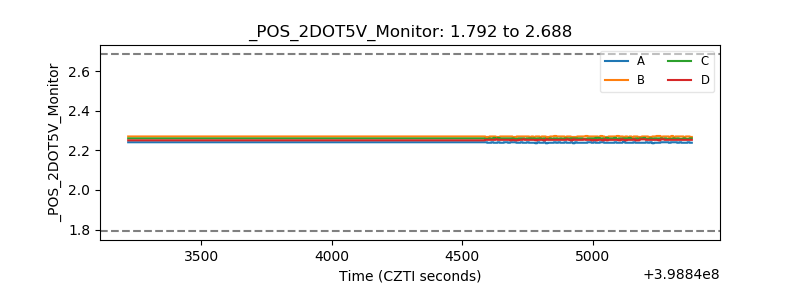 |
| +5 Volts monitor | 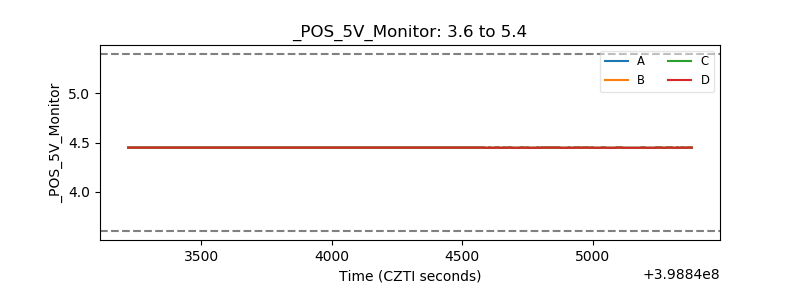 |
| _ROLL_ROT | 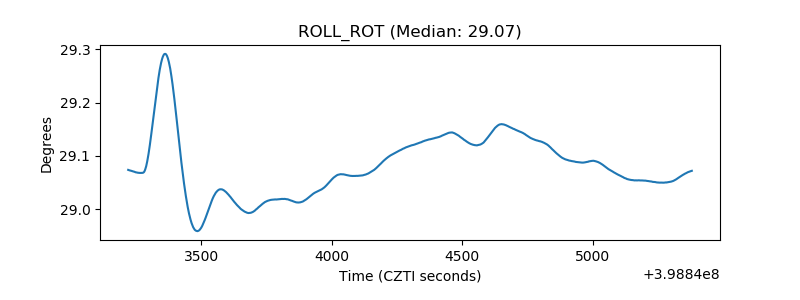 |
| _Roll_DEC | 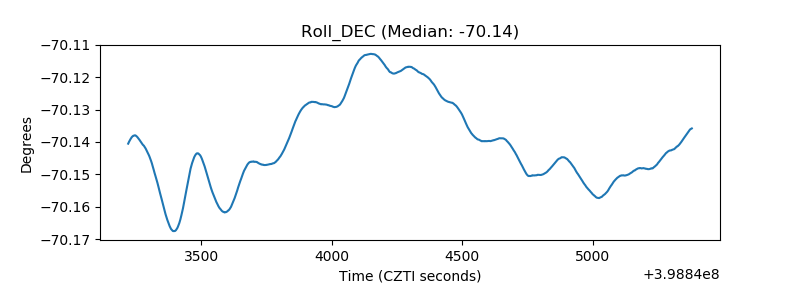 |
| _Roll_RA | 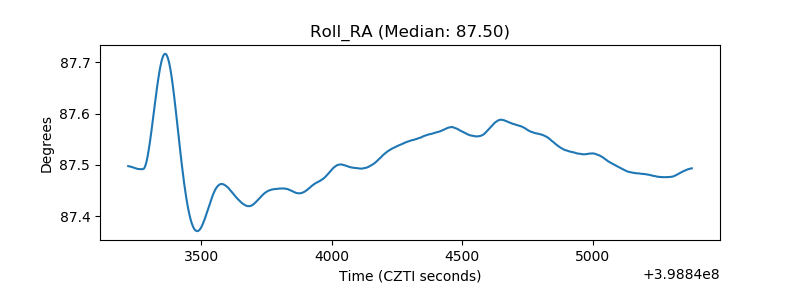 |
| Veto Counter | 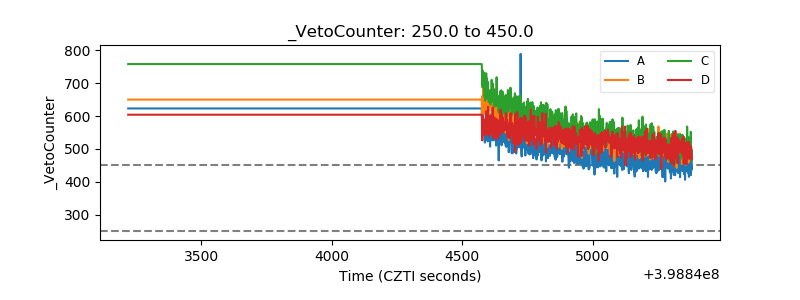 |