| Param | Original file | Final file |
|---|---|---|
| Filename | modeM0/AS1A10_094T23_9000005304_37304cztM0_level2.evt | modeM0/AS1A10_094T23_9000005304_37304cztM0_level2_quad_clean.evt |
| Size (bytes) | 393,416,640 | 101,373,120 |
| Size | 375.2 MB | 96.7 MB |
| Events in quadrant A | 2,596,857 | 679,200 |
| Events in quadrant B | 2,639,002 | 691,230 |
| Events in quadrant C | 2,667,804 | 703,711 |
| Events in quadrant D | 3,677,124 | 651,543 |
| Mode SS | |||
|---|---|---|---|
| Quadrant | BADHDUFLAG | Total packets | Discarded packets |
| A | 0 | 100 | 0 |
| B | 0 | 100 | 0 |
| C | 0 | 100 | 0 |
| D | 0 | 100 | 0 |
| Mode M0 | |||
|---|---|---|---|
| Quadrant | BADHDUFLAG | Total packets | Discarded packets |
| A | 0 | 10580 | 3 |
| B | 0 | 10851 | 2 |
| C | 0 | 10672 | 2 |
| D | 0 | 14112 | 2 |
| Mode M9 | |||
|---|---|---|---|
| Quadrant | BADHDUFLAG | Total packets | Discarded packets |
| A | 0 | 22 | 0 |
| B | 0 | 22 | 0 |
| C | 0 | 22 | 0 |
| D | 0 | 23 | 0 |
| Quadrant | Total seconds | Saturated seconds | Saturation percentage |
|---|---|---|---|
| A | 4911 | 9 | 0.183262% |
| B | 4911 | 66 | 1.343922% |
| C | 4911 | 43 | 0.875585% |
| D | 4911 | 267 | 5.436775% |
Noise dominated data is calculated using 1-second bins in cleaned event files. If a bin has >2000 counts, and if more than 50% of those come from <1% of pixels, then it is considered to be noise-dominated and hence unusable.
| Quadrant | # 1 sec bins | Bins with >0 counts | Bins with >2000 counts | High rate bins dominated by noise | Noise dominated (total time) | Noise dominated (detector-on time) | Marked lightcurve |
|---|---|---|---|---|---|---|---|
| A | 7034 | 4912 | 5 | 5 | 0.07% | 0.10% | 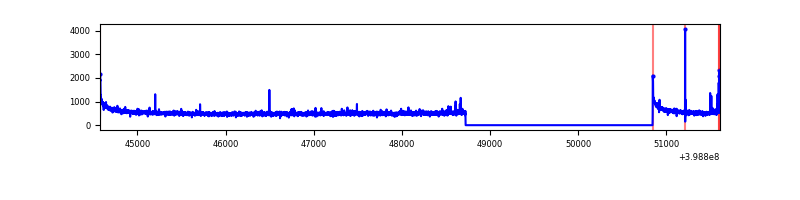 |
| B | 7034 | 4912 | 34 | 34 | 0.48% | 0.69% | 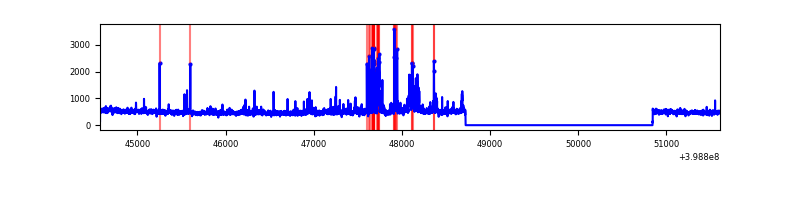 |
| C | 7034 | 4912 | 33 | 33 | 0.47% | 0.67% | 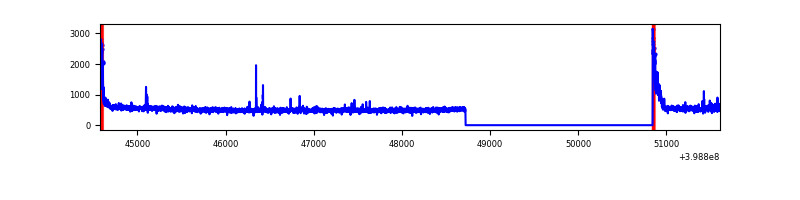 |
| D | 7034 | 4912 | 256 | 256 | 3.64% | 5.21% | 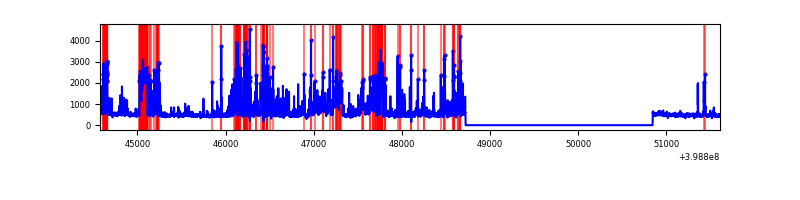 |
Top three noisy pixels from each quadrant. If the there are fewer than three noisy pixels in the level2.evt file, extra rows are filled as -1
| Pixel properties | Quadrant properties | ||||||
|---|---|---|---|---|---|---|---|
| Quadrant | DetID | PixID | Counts | Sigma | Mean | Median | Sigma |
| A | 10 | 83 | 267540 | 2294.07 | 585 | 574 | 116.4 |
| A | 13 | 248 | 33406 | 282.13 | 585 | 574 | 116.4 |
| A | 9 | 143 | 12198 | 99.89 | 585 | 574 | 116.4 |
| B | 12 | 18 | 200423 | 1869.78 | 577 | 562 | 106.9 |
| B | 0 | 213 | 77031 | 715.4 | 577 | 562 | 106.9 |
| B | 5 | 200 | 24169 | 220.85 | 577 | 562 | 106.9 |
| C | 15 | 214 | 210274 | 1583.84 | 579 | 583 | 132.4 |
| C | 0 | 10 | 165702 | 1247.18 | 579 | 583 | 132.4 |
| C | 1 | 23 | 20412 | 149.77 | 579 | 583 | 132.4 |
| D | 2 | 249 | 532674 | 3868.33 | 573 | 558 | 137.6 |
| D | 12 | 227 | 452200 | 3283.31 | 573 | 558 | 137.6 |
| D | 2 | 153 | 145888 | 1056.51 | 573 | 558 | 137.6 |
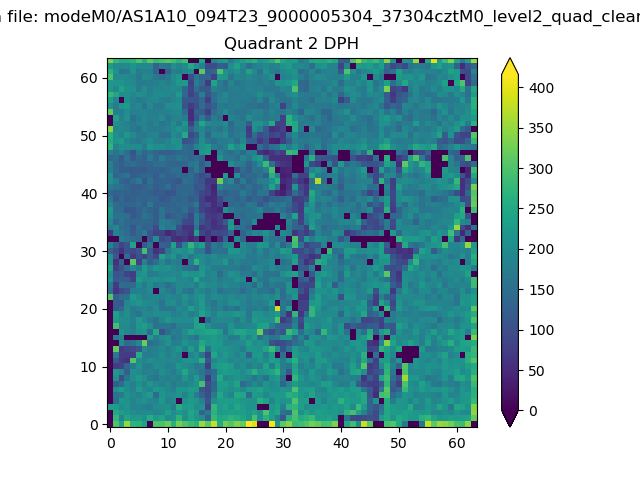
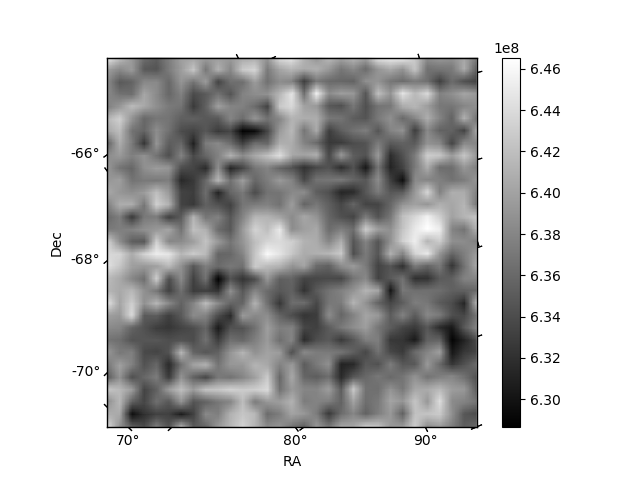
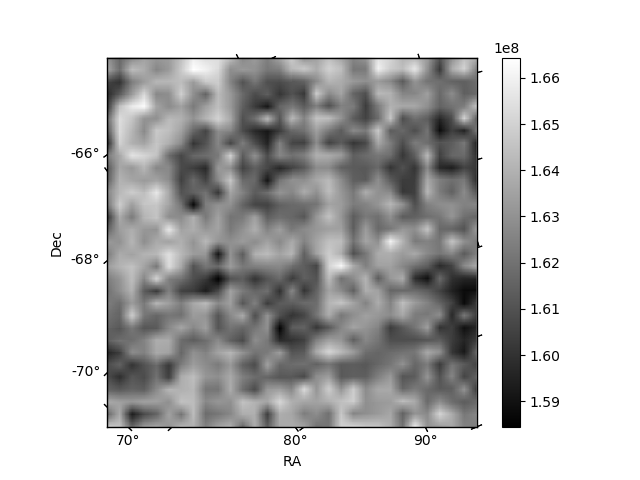
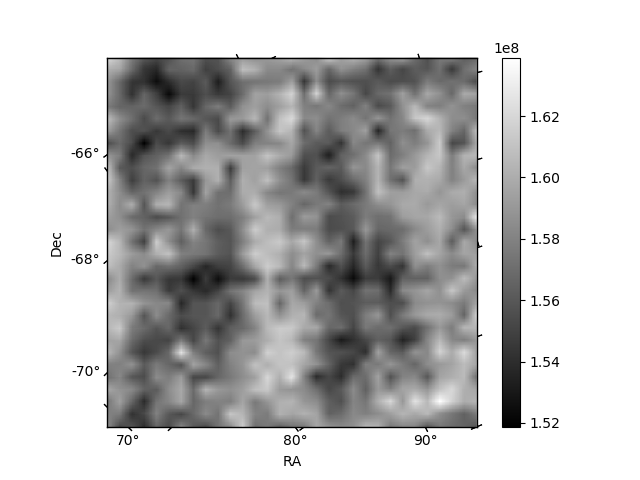
Histogram calculated using DETX and DETY for each event in the final _common_clean file
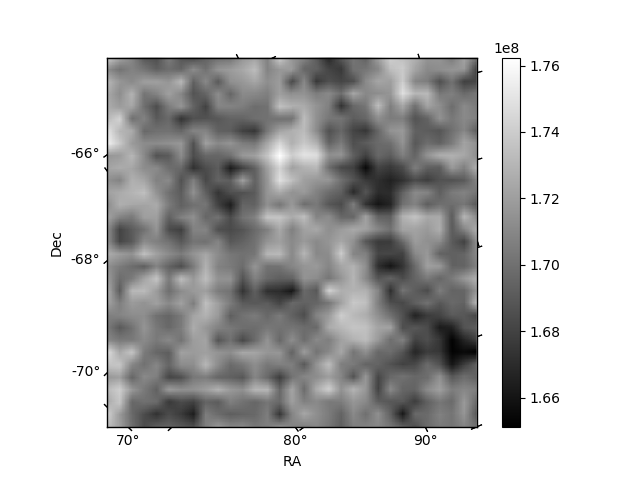
| Quadrant A | 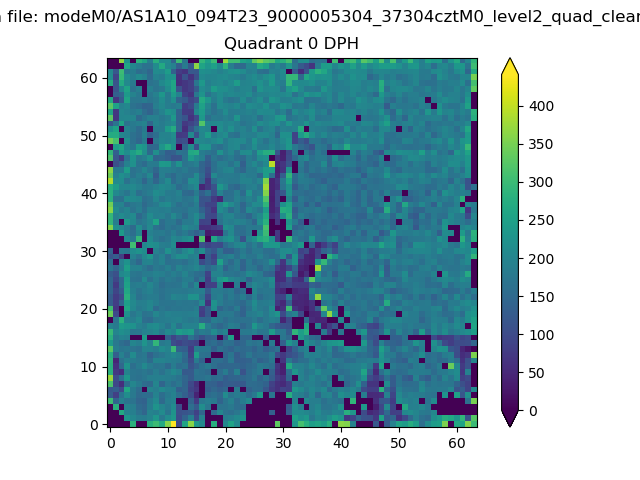 |
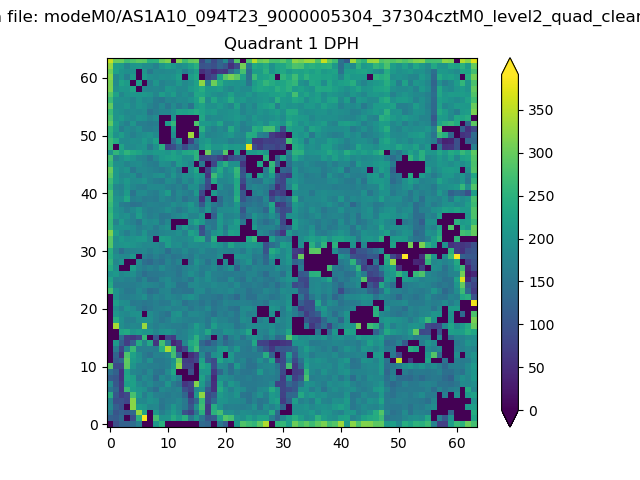 |
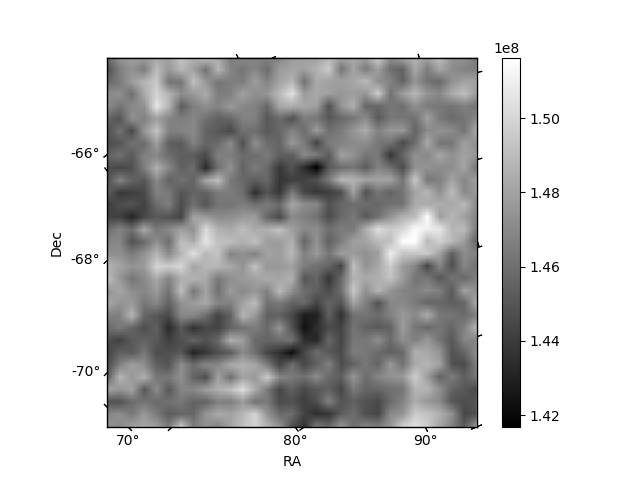
Quadrant B |
|---|---|---|---|
| Quadrant D | 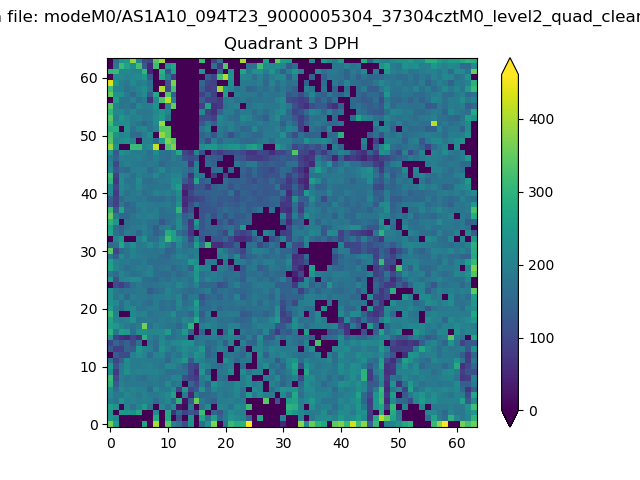 |
 |
Quadrant C |
| Plot type | Count rate plots | Images |
|---|---|---|
| Comparison with Poisson distribution Blue bars denote a histogram of data divided into 1 sec bins. Red curve is a Poisson curve with rate = median count rate of data. |
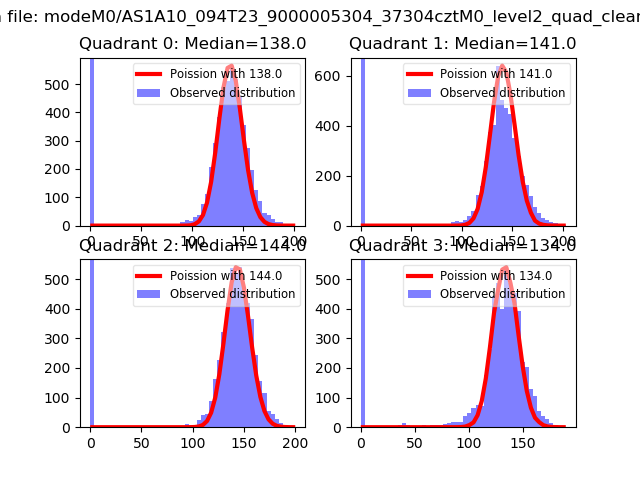 |
 |
| Quadrant-wise count rates Data is divided into 100 sec bins |
 |
|
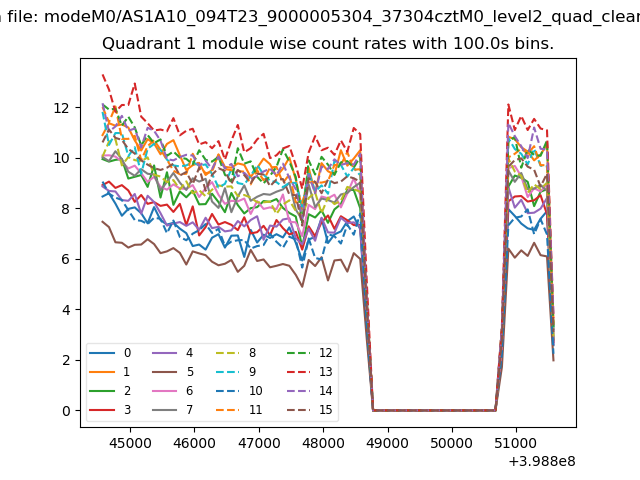
| Module-wise count rates for Quadrant A Data is divided into 100 sec bins |
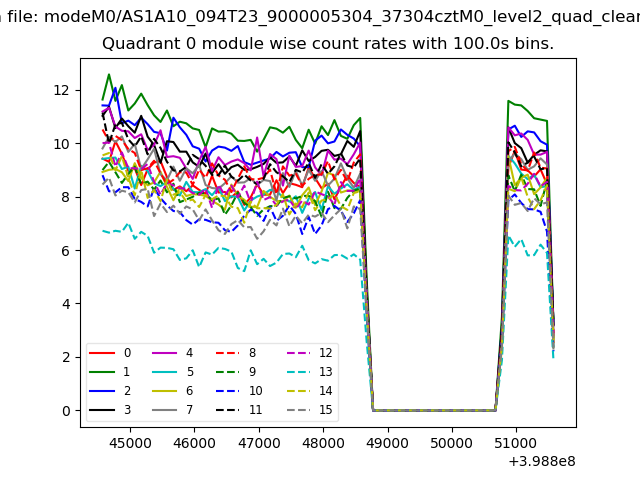 |
 |
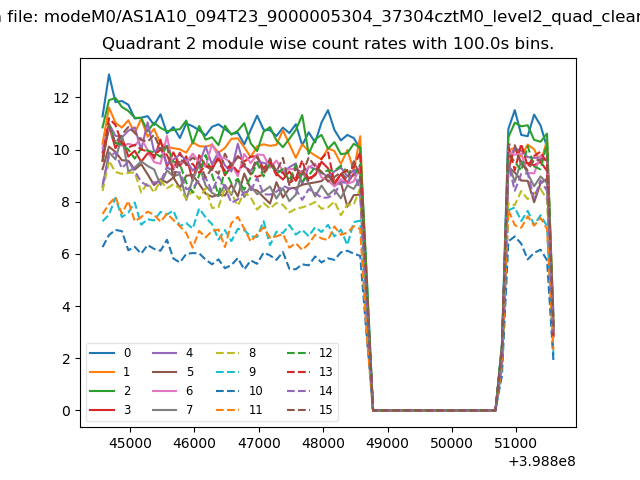
| Module-wise count rates for Quadrant B Data is divided into 100 sec bins |
 |
 |
| Module-wise count rates for Quadrant C Data is divided into 100 sec bins |
 |
 |
| Module-wise count rates for Quadrant D Data is divided into 100 sec bins |
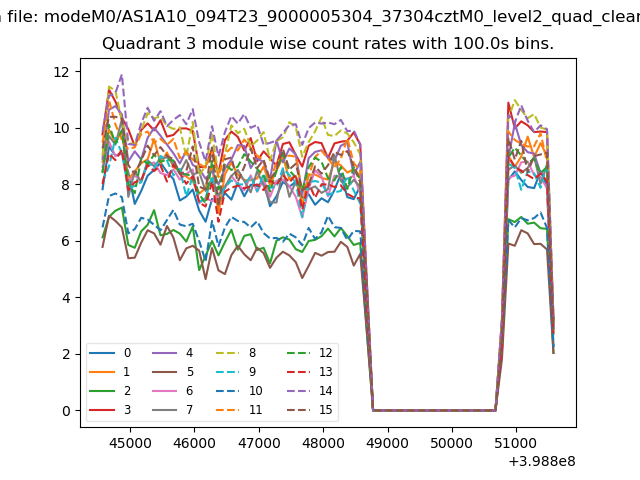 |
 |
| Parameter | Plot |
|---|---|
| CZT HV Monitor | 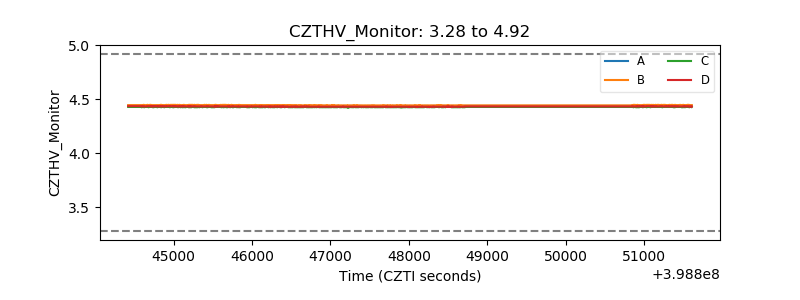 |
| D_VDD | 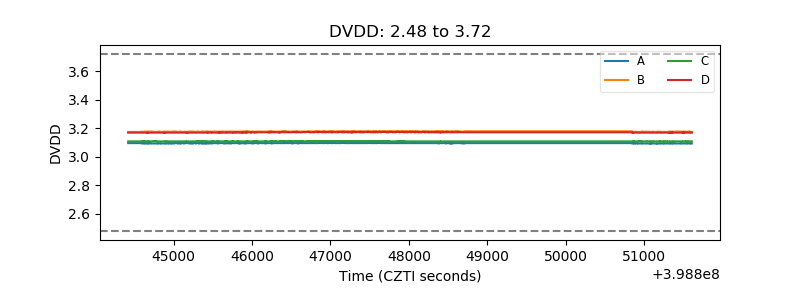 |
| Temperature 1 | 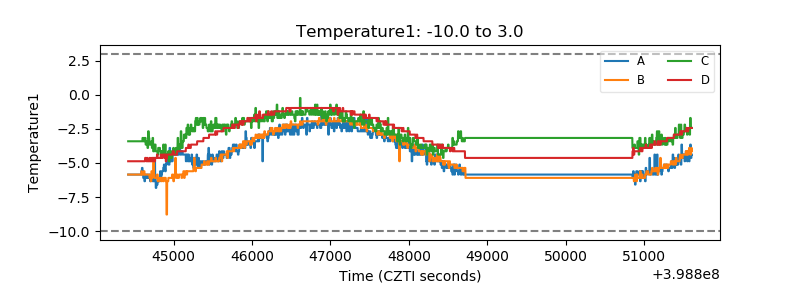 |
| Veto HV Monitor |  |
| Veto LLD | 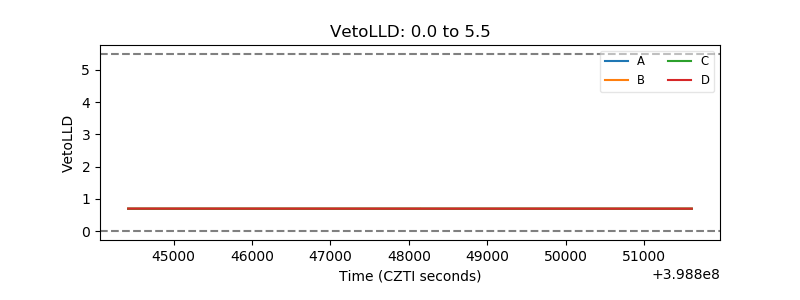 |
| Alpha Counter | 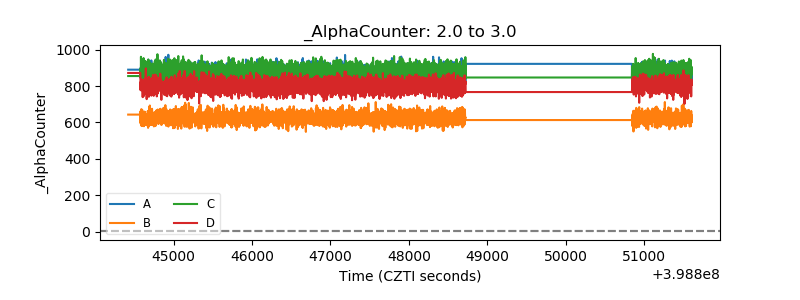 |
| _CPM_Rate | 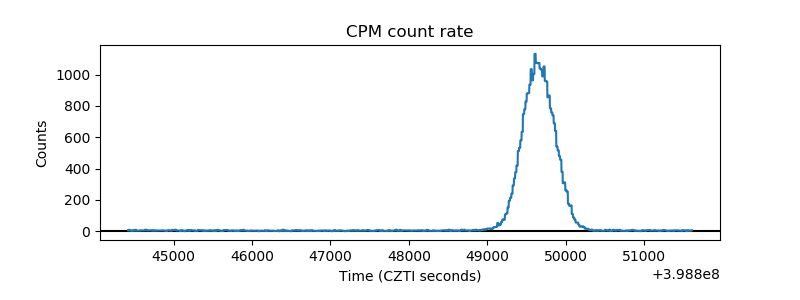 |
| CZT Counter | 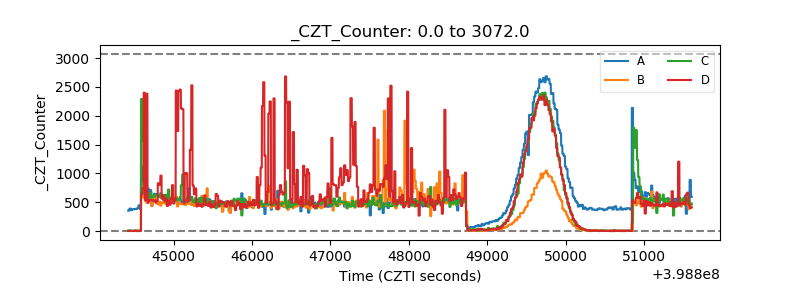 |
| +2.5 Volts monitor | 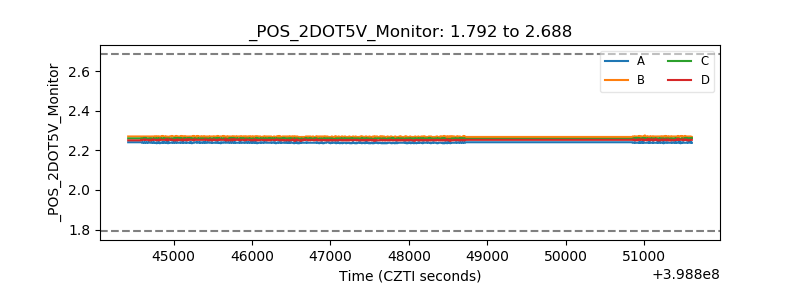 |
| +5 Volts monitor | 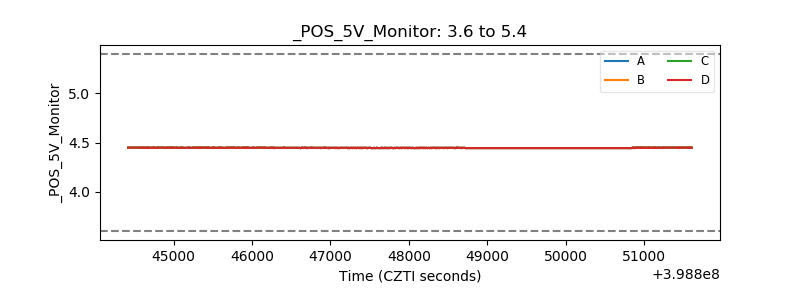 |
| _ROLL_ROT | 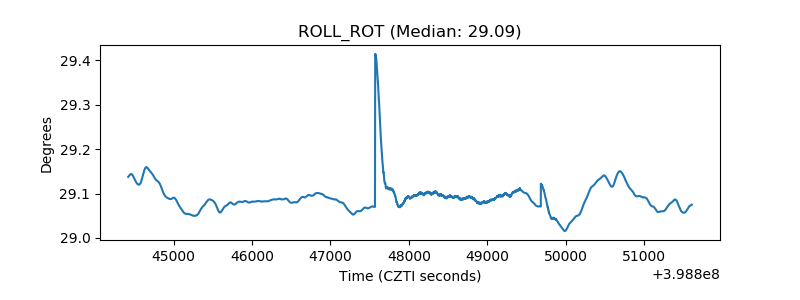 |
| _Roll_DEC | 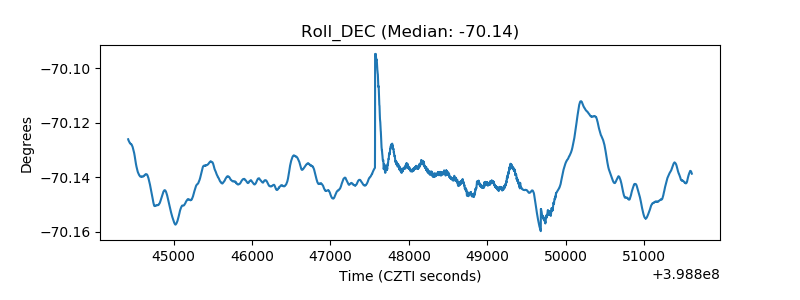 |
| _Roll_RA | 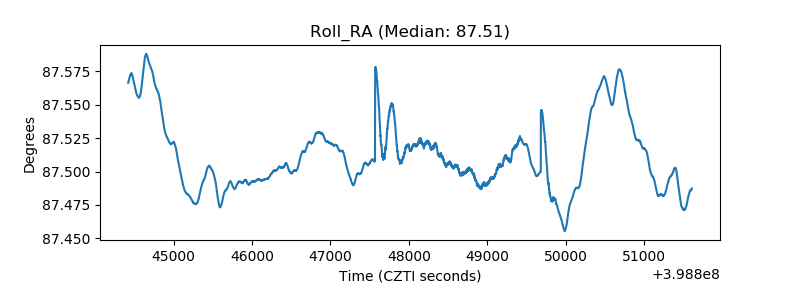 |
| Veto Counter | 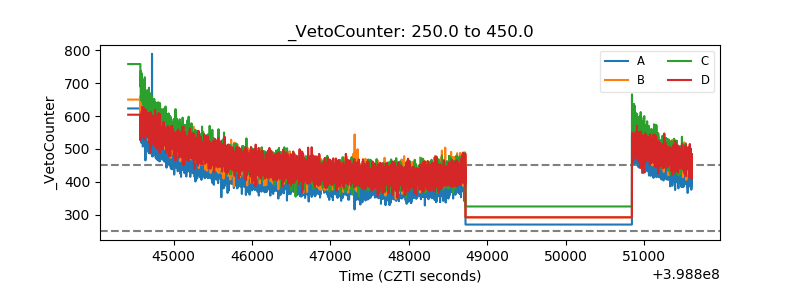 |