| Param | Original file | Final file |
|---|---|---|
| Filename | modeM0/AS1A10_094T23_9000005304_37305cztM0_level2.evt | modeM0/AS1A10_094T23_9000005304_37305cztM0_level2_quad_clean.evt |
| Size (bytes) | 303,995,520 | 80,899,200 |
| Size | 289.9 MB | 77.2 MB |
| Events in quadrant A | 2,079,972 | 541,215 |
| Events in quadrant B | 2,417,286 | 535,131 |
| Events in quadrant C | 2,086,147 | 557,626 |
| Events in quadrant D | 2,344,356 | 528,055 |
| Mode SS | |||
|---|---|---|---|
| Quadrant | BADHDUFLAG | Total packets | Discarded packets |
| A | 0 | 82 | 0 |
| B | 0 | 82 | 0 |
| C | 0 | 82 | 0 |
| D | 0 | 82 | 0 |
| Mode M0 | |||
|---|---|---|---|
| Quadrant | BADHDUFLAG | Total packets | Discarded packets |
| A | 0 | 8626 | 1 |
| B | 0 | 9778 | 1 |
| C | 0 | 8600 | 1 |
| D | 0 | 9658 | 1 |
| Mode M9 | |||
|---|---|---|---|
| Quadrant | BADHDUFLAG | Total packets | Discarded packets |
| A | 0 | 6 | 0 |
| B | 0 | 6 | 0 |
| C | 0 | 6 | 0 |
| D | 0 | 7 | 0 |
| Quadrant | Total seconds | Saturated seconds | Saturation percentage |
|---|---|---|---|
| A | 4082 | 11 | 0.269476% |
| B | 4082 | 185 | 4.532092% |
| C | 4082 | 19 | 0.465458% |
| D | 4082 | 93 | 2.278295% |
Noise dominated data is calculated using 1-second bins in cleaned event files. If a bin has >2000 counts, and if more than 50% of those come from <1% of pixels, then it is considered to be noise-dominated and hence unusable.
| Quadrant | # 1 sec bins | Bins with >0 counts | Bins with >2000 counts | High rate bins dominated by noise | Noise dominated (total time) | Noise dominated (detector-on time) | Marked lightcurve |
|---|---|---|---|---|---|---|---|
| A | 4082 | 4082 | 6 | 6 | 0.15% | 0.15% | 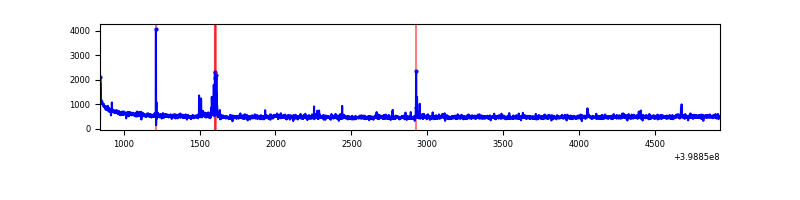 |
| B | 4082 | 4082 | 102 | 102 | 2.50% | 2.50% | 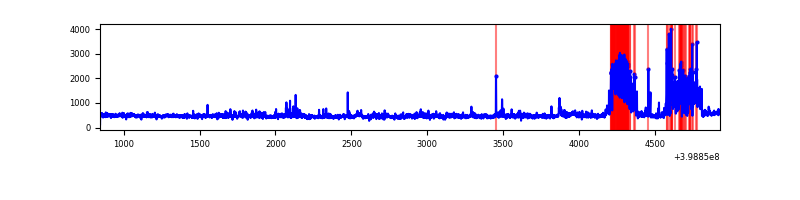 |
| C | 4082 | 4082 | 16 | 16 | 0.39% | 0.39% | 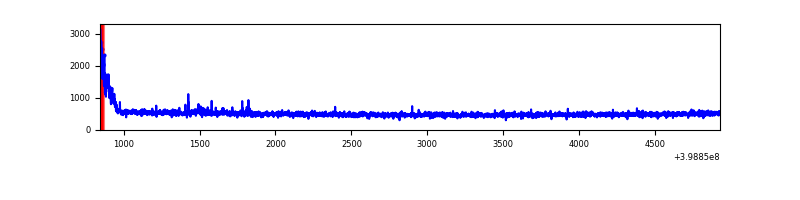 |
| D | 4082 | 4082 | 70 | 70 | 1.71% | 1.71% | 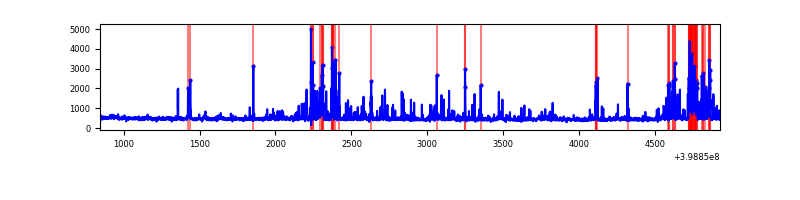 |
Top three noisy pixels from each quadrant. If the there are fewer than three noisy pixels in the level2.evt file, extra rows are filled as -1
| Pixel properties | Quadrant properties | ||||||
|---|---|---|---|---|---|---|---|
| Quadrant | DetID | PixID | Counts | Sigma | Mean | Median | Sigma |
| A | 10 | 83 | 178899 | 1878.48 | 471 | 464 | 95.0 |
| A | 13 | 248 | 44040 | 458.75 | 471 | 464 | 95.0 |
| A | 9 | 143 | 13702 | 139.36 | 471 | 464 | 95.0 |
| B | 12 | 18 | 264490 | 3059.78 | 455 | 443 | 86.3 |
| B | 5 | 255 | 155521 | 1797.05 | 455 | 443 | 86.3 |
| B | 0 | 213 | 78613 | 905.83 | 455 | 443 | 86.3 |
| C | 15 | 214 | 167870 | 1568.2 | 461 | 464 | 106.8 |
| C | 0 | 10 | 97711 | 910.97 | 461 | 464 | 106.8 |
| C | 15 | 208 | 12106 | 109.06 | 461 | 464 | 106.8 |
| D | 2 | 249 | 394935 | 3518.72 | 461 | 448 | 112.1 |
| D | 10 | 199 | 49568 | 438.14 | 461 | 448 | 112.1 |
| D | 2 | 153 | 44071 | 389.11 | 461 | 448 | 112.1 |
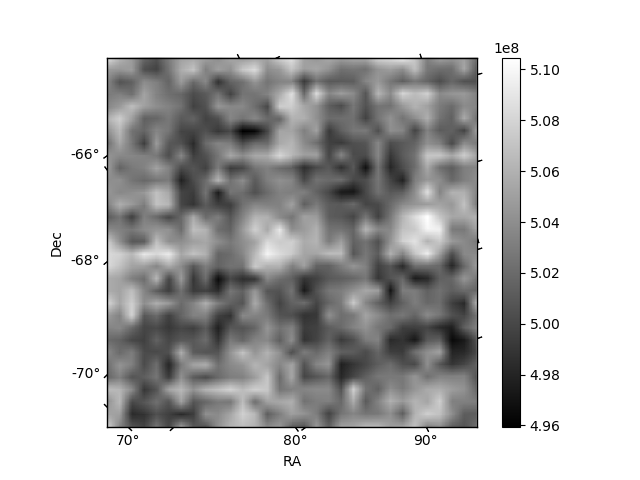
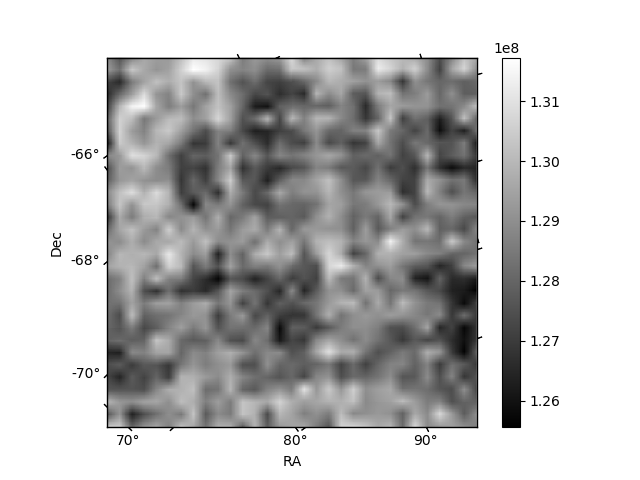
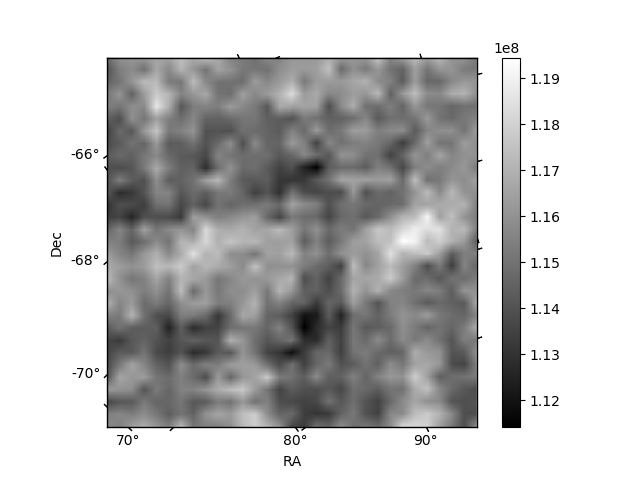
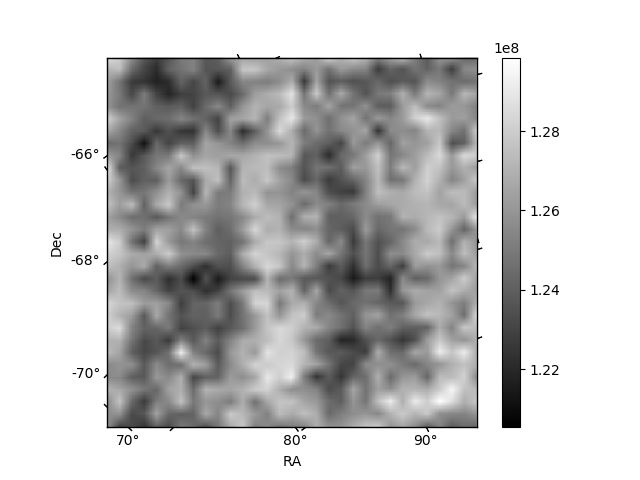
Histogram calculated using DETX and DETY for each event in the final _common_clean file
| Quadrant A | 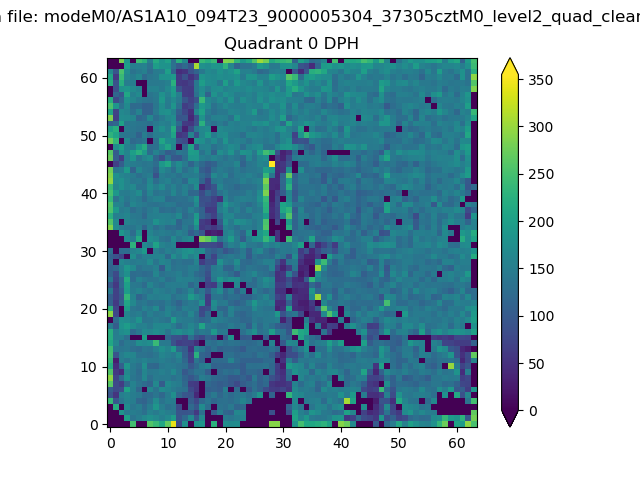 |
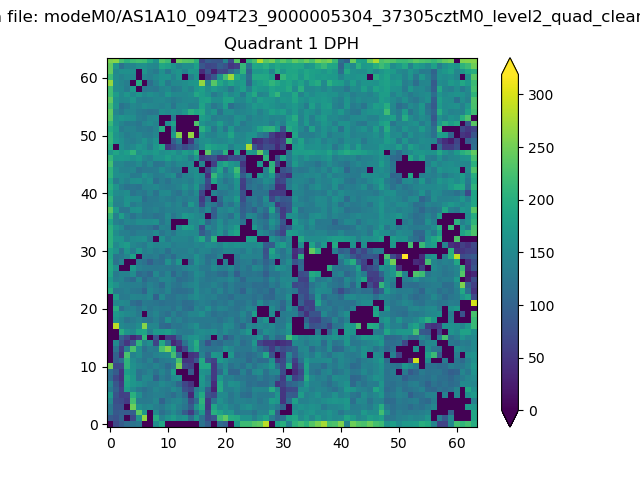 |
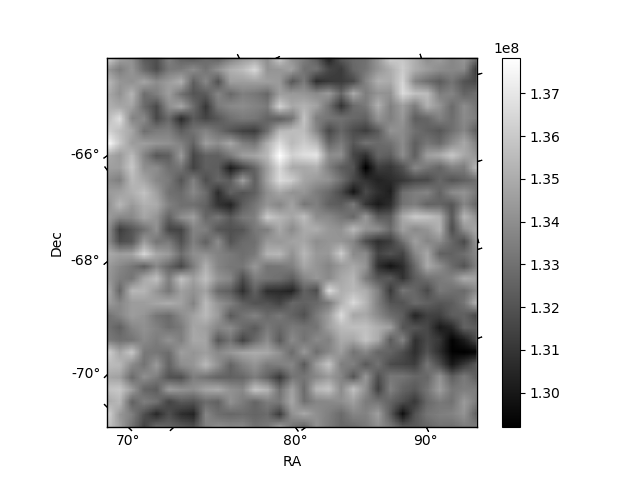
Quadrant B |
|---|---|---|---|
| Quadrant D | 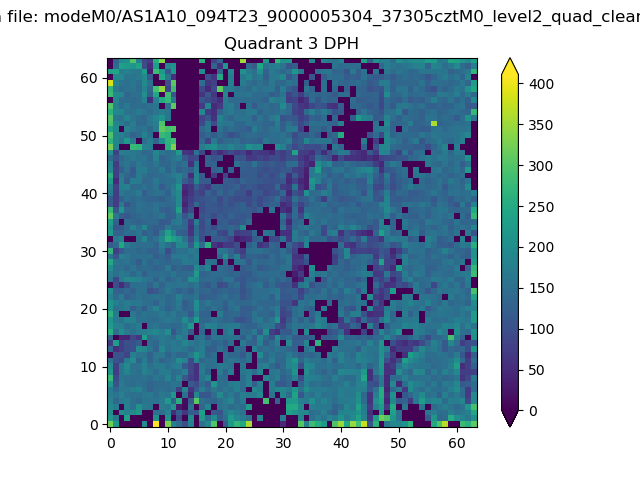 |
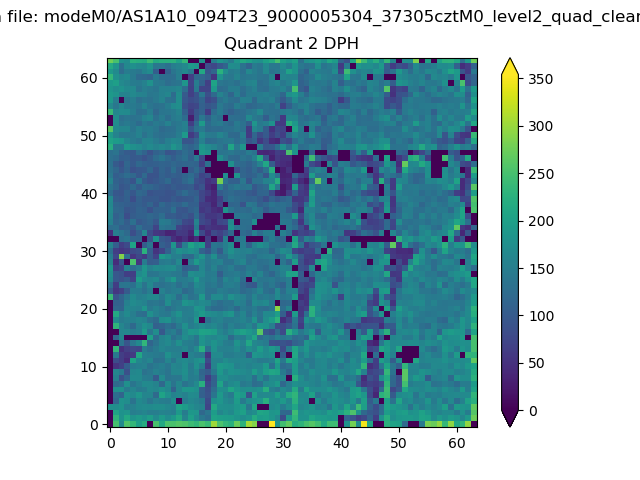 |
Quadrant C |
| Plot type | Count rate plots | Images |
|---|---|---|
| Comparison with Poisson distribution Blue bars denote a histogram of data divided into 1 sec bins. Red curve is a Poisson curve with rate = median count rate of data. |
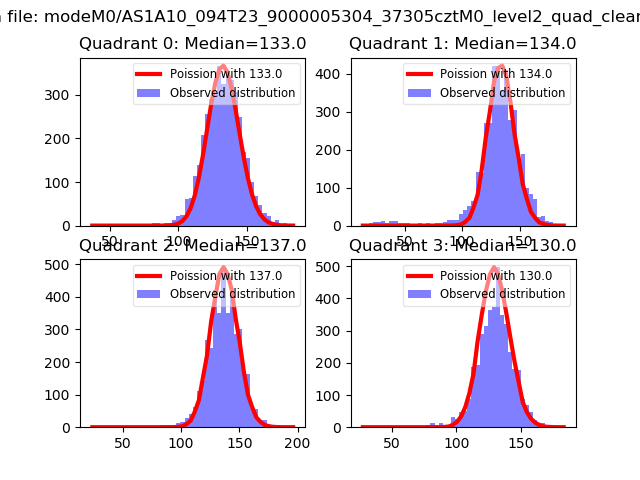 |
 |
| Quadrant-wise count rates Data is divided into 100 sec bins |
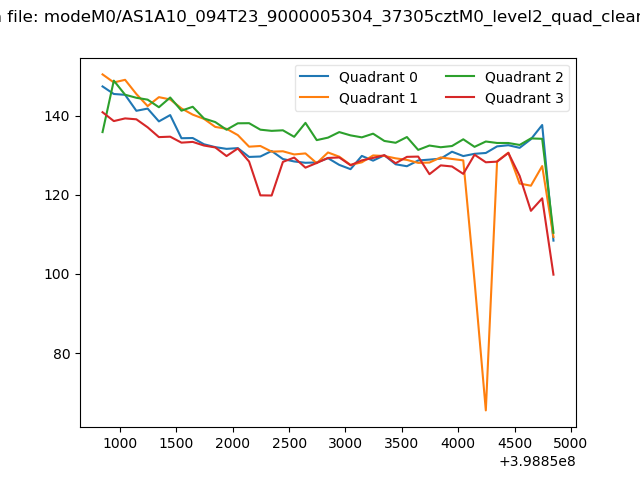 |
|
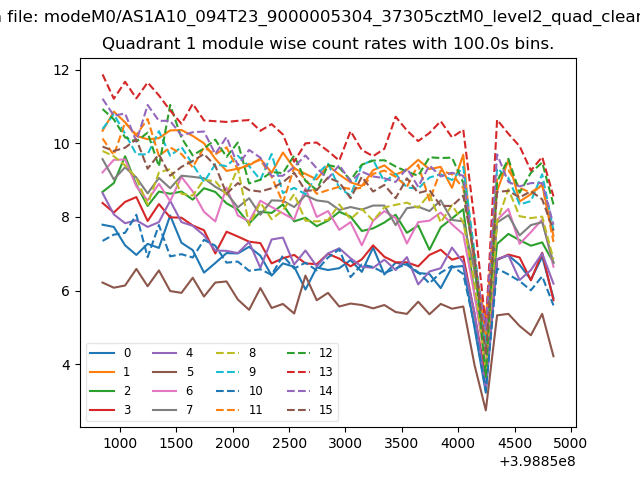
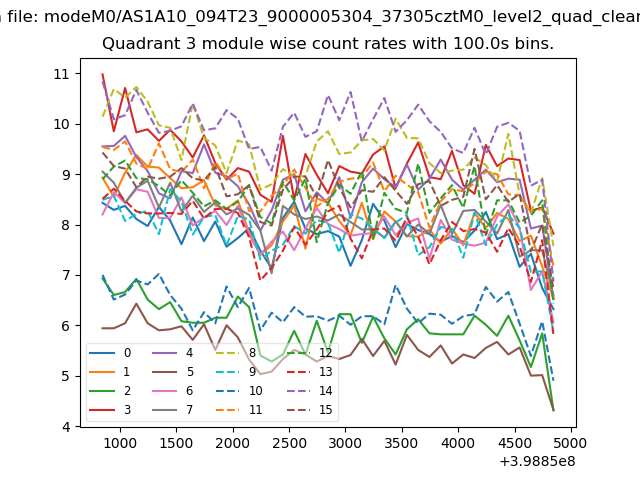
| Module-wise count rates for Quadrant A Data is divided into 100 sec bins |
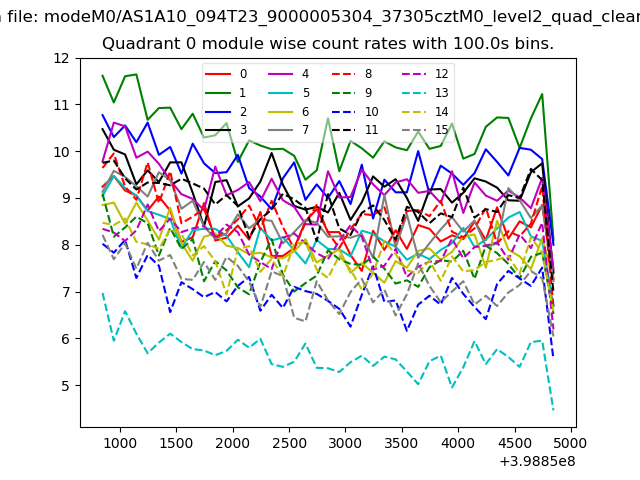 |
 |
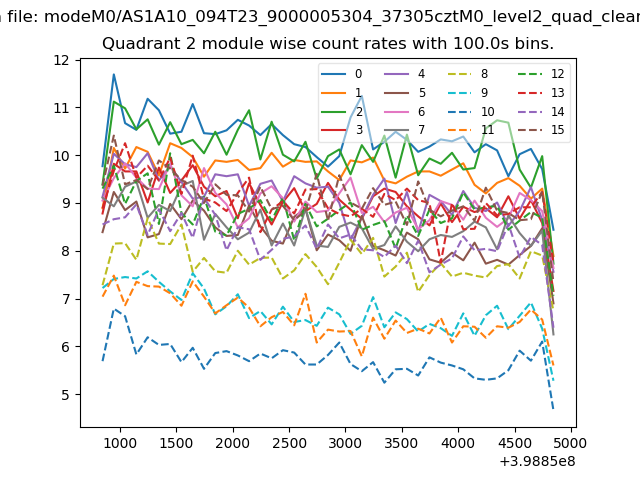
| Module-wise count rates for Quadrant B Data is divided into 100 sec bins |
 |
 |
| Module-wise count rates for Quadrant C Data is divided into 100 sec bins |
 |
 |
| Module-wise count rates for Quadrant D Data is divided into 100 sec bins |
 |
 |
| Parameter | Plot |
|---|---|
| CZT HV Monitor | 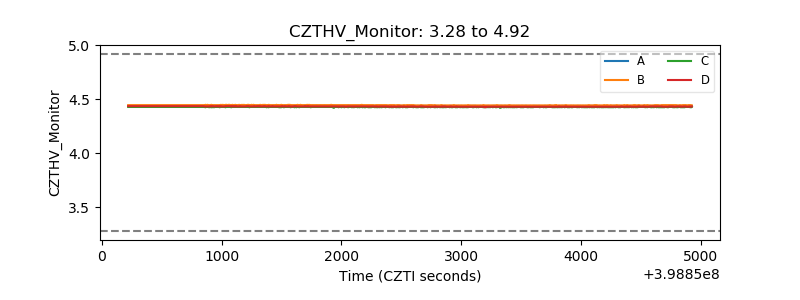 |
| D_VDD | 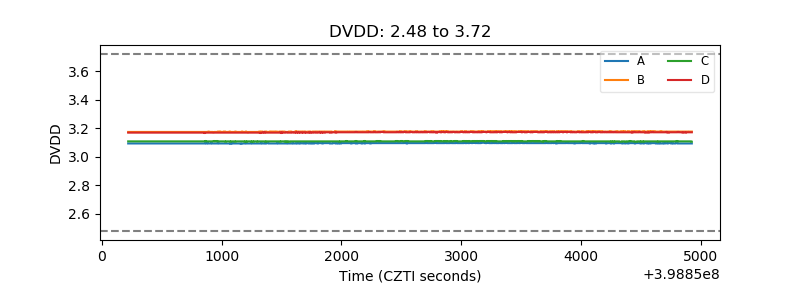 |
| Temperature 1 | 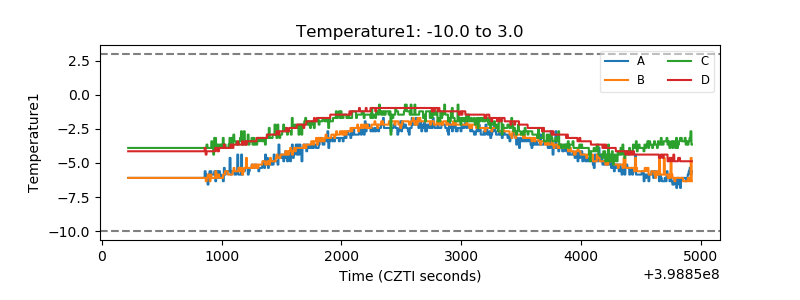 |
| Veto HV Monitor | 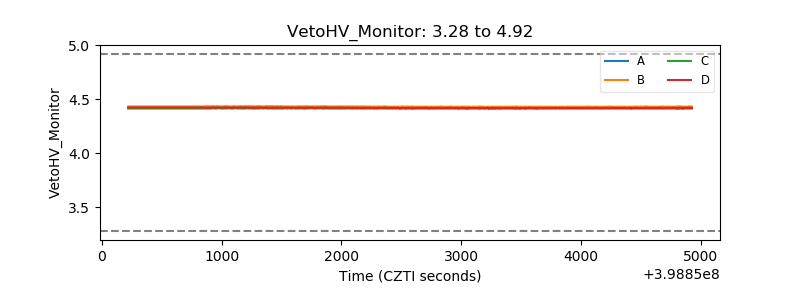 |
| Veto LLD | 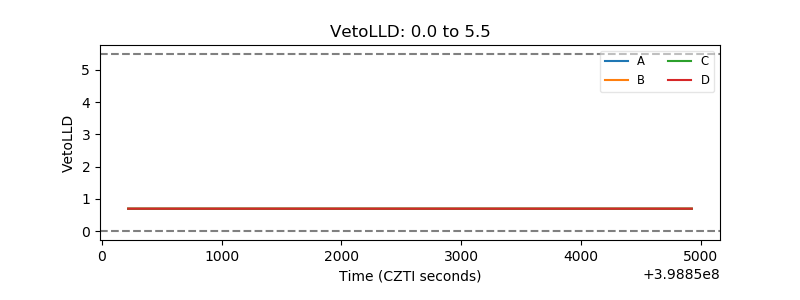 |
| Alpha Counter |  |
| _CPM_Rate | 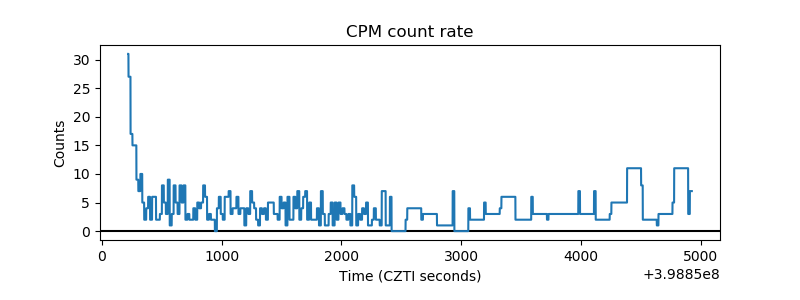 |
| CZT Counter | 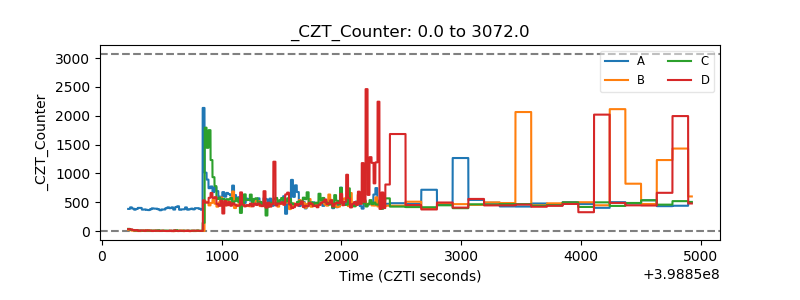 |
| +2.5 Volts monitor | 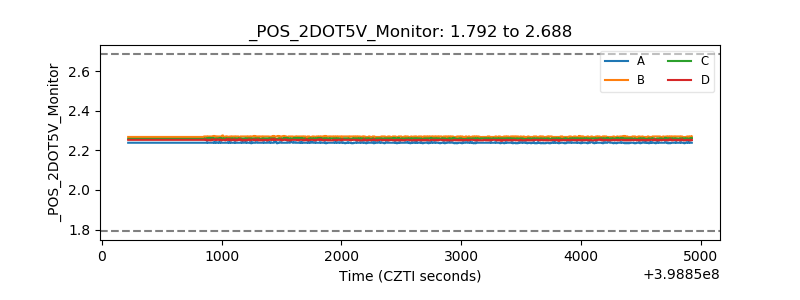 |
| +5 Volts monitor | 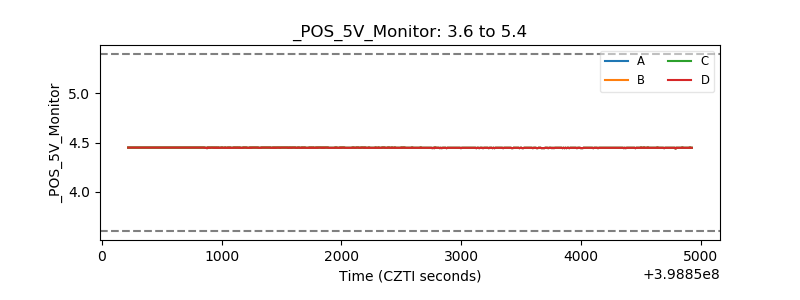 |
| _ROLL_ROT | 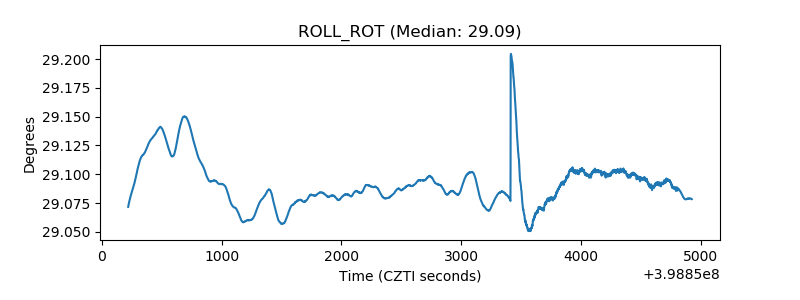 |
| _Roll_DEC | 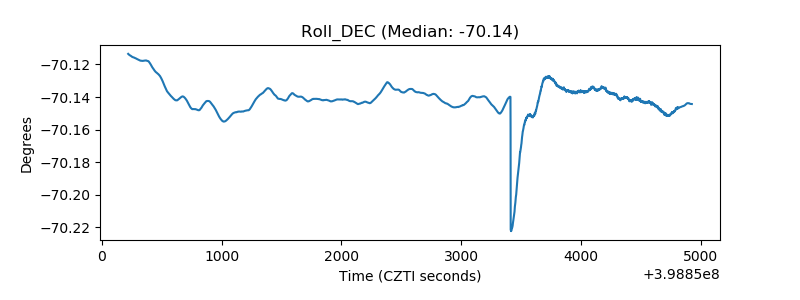 |
| _Roll_RA | 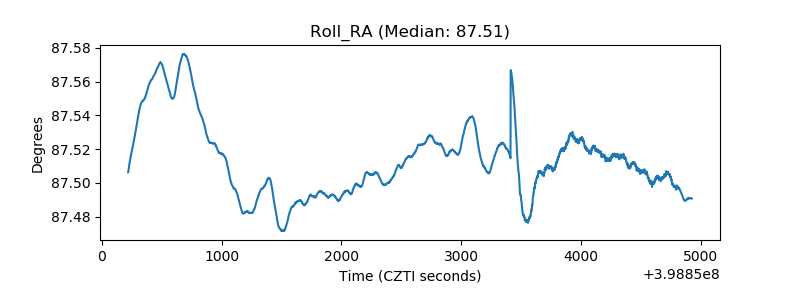 |
| Veto Counter | 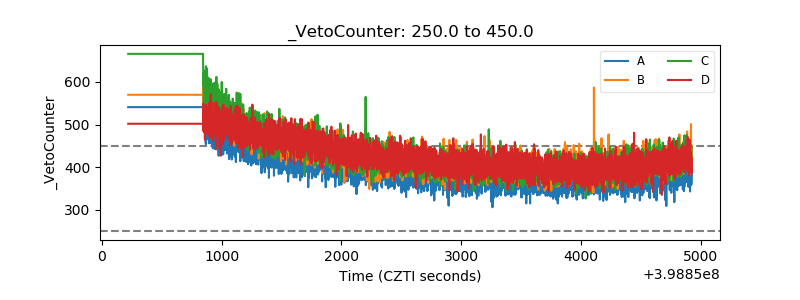 |