| Param | Original file | Final file |
|---|---|---|
| Filename | modeM0/AS1A10_094T24_9000005306cztM0_level2.fits | modeM0/AS1A10_094T24_9000005306cztM0_level2_quad_clean.evt |
| Size (bytes) | 35,896,320 | 23,425,920 |
| Size | 34.2 MB | 22.3 MB |
| Events in quadrant A | 215,192 | 113,392 |
| Events in quadrant B | 206,234 | 113,350 |
| Events in quadrant C | 211,822 | 110,260 |
| Events in quadrant D | 182,478 | 99,762 |
| Mode M0 | |||
|---|---|---|---|
| Quadrant | BADHDUFLAG | Total packets | Discarded packets |
| A | 0 | 8171 | 0 |
| B | 0 | 8179 | 0 |
| C | 0 | 8178 | 0 |
| D | 0 | 10643 | 0 |
| Mode SS | |||
|---|---|---|---|
| Quadrant | BADHDUFLAG | Total packets | Discarded packets |
| A | 0 | 78 | 0 |
| B | 0 | 78 | 0 |
| C | 0 | 78 | 0 |
| D | 0 | 78 | 0 |
| Mode M9 | |||
|---|---|---|---|
| Quadrant | BADHDUFLAG | Total packets | Discarded packets |
| A | 0 | 18 | 0 |
| B | 0 | 18 | 0 |
| C | 0 | 18 | 0 |
| D | 0 | 18 | 0 |
| Quadrant | Total seconds | Saturated seconds | Saturation percentage |
|---|---|---|---|
| A | 3839 | 21 | 0.547017% |
| B | 3839 | 15 | 0.390727% |
| C | 3839 | 43 | 1.120083% |
| D | 3839 | 212 | 5.522271% |
Noise dominated data is calculated using 1-second bins in cleaned event files. If a bin has >2000 counts, and if more than 50% of those come from <1% of pixels, then it is considered to be noise-dominated and hence unusable.
| Quadrant | # 1 sec bins | Bins with >0 counts | Bins with >2000 counts | High rate bins dominated by noise | Noise dominated (total time) | Noise dominated (detector-on time) | Marked lightcurve |
|---|---|---|---|---|---|---|---|
| A | 3838 | 3838 | 0 | 0 | 0.00% | 0.00% |  |
| B | 3838 | 3838 | 0 | 0 | 0.00% | 0.00% |  |
| C | 3838 | 3838 | 0 | 0 | 0.00% | 0.00% |  |
| D | 3838 | 3838 | 0 | 0 | 0.00% | 0.00% |  |
Top three noisy pixels from each quadrant. If the there are fewer than three noisy pixels in the level2.evt file, extra rows are filled as -1
| Pixel properties | Quadrant properties | ||||||
|---|---|---|---|---|---|---|---|
| Quadrant | DetID | PixID | Counts | Sigma | Mean | Median | Sigma |
| A | 7 | 110 | 184 | 8.45 | 56 | 53 | 15.5 |
| A | 0 | 29 | 179 | 8.13 | 56 | 53 | 15.5 |
| A | 9 | 19 | 173 | 7.74 | 56 | 53 | 15.5 |
| B | 3 | 80 | 169 | 8.99 | 54 | 52 | 13.0 |
| B | 2 | 9 | 159 | 8.22 | 54 | 52 | 13.0 |
| B | 14 | 254 | 142 | 6.91 | 54 | 52 | 13.0 |
| C | 3 | 203 | 201 | 9.24 | 56 | 53 | 16.0 |
| C | 3 | 202 | 187 | 8.37 | 56 | 53 | 16.0 |
| C | 1 | 81 | 183 | 8.12 | 56 | 53 | 16.0 |
| D | 6 | 232 | 142 | 6.03 | 52 | 47 | 15.8 |
| D | 15 | 63 | 138 | 5.77 | 52 | 47 | 15.8 |
| D | 10 | 113 | 134 | 5.52 | 52 | 47 | 15.8 |
Histogram calculated using DETX and DETY for each event in the final _common_clean file
| Quadrant A |  |
 |
Quadrant B |
|---|---|---|---|
| Quadrant D |  |
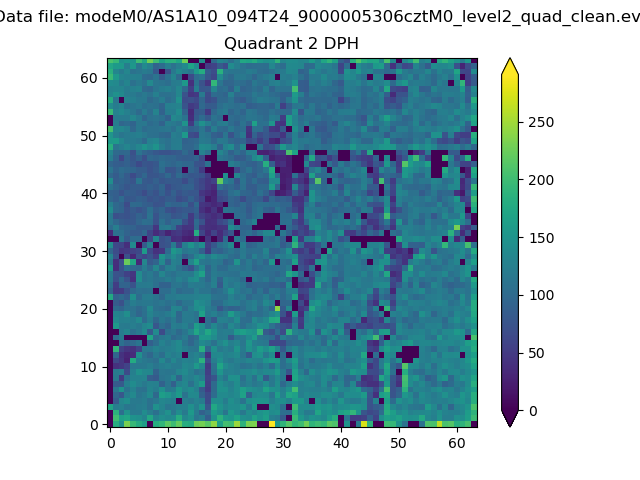 |
Quadrant C |
| Plot type | Count rate plots | Images |
|---|---|---|
| Comparison with Poisson distribution Blue bars denote a histogram of data divided into 1 sec bins. Red curve is a Poisson curve with rate = median count rate of data. |
 |
 |
| Quadrant-wise count rates Data is divided into 100 sec bins |
 |
|
| Module-wise count rates for Quadrant A Data is divided into 100 sec bins |
 |
 |
| Module-wise count rates for Quadrant B Data is divided into 100 sec bins |
 |
 |
| Module-wise count rates for Quadrant C Data is divided into 100 sec bins |
 |
 |
| Module-wise count rates for Quadrant D Data is divided into 100 sec bins |
 |
 |
| Parameter | Plot |
|---|---|
| CZT HV Monitor |  |
| D_VDD |  |
| Temperature 1 |  |
| Veto HV Monitor |  |
| Veto LLD |  |
| Alpha Counter |  |
| _CPM_Rate |  |
| CZT Counter |  |
| +2.5 Volts monitor |  |
| +5 Volts monitor |  |
| _ROLL_ROT |  |
| _Roll_DEC |  |
| _Roll_RA |  |
| Veto Counter |  |