| Param | Original file | Final file |
|---|---|---|
| Filename | modeM0/AS1A10_094T24_9000005306_37305cztM0_level2.evt | modeM0/AS1A10_094T24_9000005306_37305cztM0_level2_quad_clean.evt |
| Size (bytes) | 97,297,920 | 23,538,240 |
| Size | 92.8 MB | 22.4 MB |
| Events in quadrant A | 687,347 | 152,970 |
| Events in quadrant B | 570,773 | 159,345 |
| Events in quadrant C | 698,054 | 159,771 |
| Events in quadrant D | 904,921 | 148,501 |
| Mode M0 | |||
|---|---|---|---|
| Quadrant | BADHDUFLAG | Total packets | Discarded packets |
| A | 0 | 2804 | 2 |
| B | 0 | 2472 | 1 |
| C | 0 | 2777 | 1 |
| D | 0 | 3487 | 1 |
| Mode SS | |||
|---|---|---|---|
| Quadrant | BADHDUFLAG | Total packets | Discarded packets |
| A | 0 | 26 | 0 |
| B | 0 | 26 | 0 |
| C | 0 | 26 | 0 |
| D | 0 | 26 | 0 |
| Mode M9 | |||
|---|---|---|---|
| Quadrant | BADHDUFLAG | Total packets | Discarded packets |
| A | 0 | 18 | 0 |
| B | 0 | 18 | 0 |
| C | 0 | 18 | 0 |
| D | 0 | 18 | 0 |
| Quadrant | Total seconds | Saturated seconds | Saturation percentage |
|---|---|---|---|
| A | 1211 | 14 | 1.156069% |
| B | 1211 | 3 | 0.247729% |
| C | 1211 | 24 | 1.981833% |
| D | 1211 | 98 | 8.092486% |
Noise dominated data is calculated using 1-second bins in cleaned event files. If a bin has >2000 counts, and if more than 50% of those come from <1% of pixels, then it is considered to be noise-dominated and hence unusable.
| Quadrant | # 1 sec bins | Bins with >0 counts | Bins with >2000 counts | High rate bins dominated by noise | Noise dominated (total time) | Noise dominated (detector-on time) | Marked lightcurve |
|---|---|---|---|---|---|---|---|
| A | 1211 | 1211 | 10 | 10 | 0.83% | 0.83% | 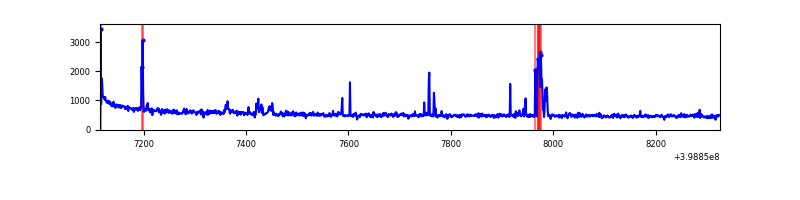 |
| B | 1211 | 1211 | 0 | 0 | 0.00% | 0.00% | 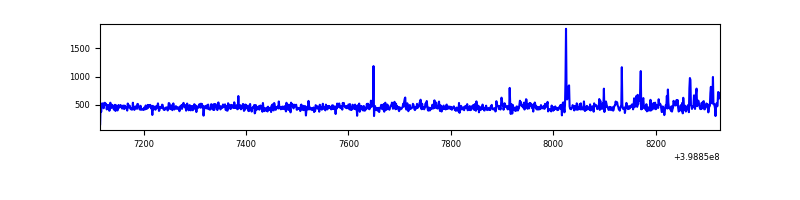 |
| C | 1211 | 1211 | 18 | 18 | 1.49% | 1.49% | 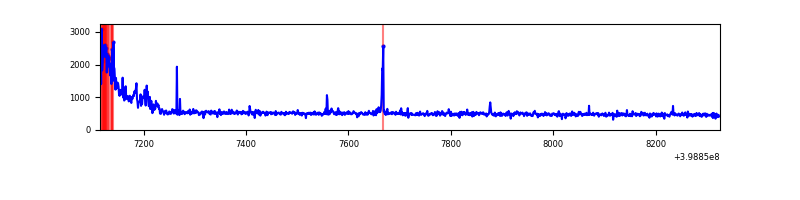 |
| D | 1211 | 1211 | 75 | 75 | 6.19% | 6.19% | 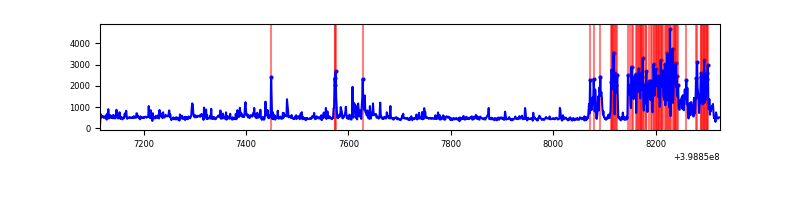 |
Top three noisy pixels from each quadrant. If the there are fewer than three noisy pixels in the level2.evt file, extra rows are filled as -1
| Pixel properties | Quadrant properties | ||||||
|---|---|---|---|---|---|---|---|
| Quadrant | DetID | PixID | Counts | Sigma | Mean | Median | Sigma |
| A | 10 | 83 | 92978 | 3167.83 | 138 | 136 | 29.3 |
| A | 13 | 248 | 39829 | 1354.35 | 138 | 136 | 29.3 |
| A | 9 | 143 | 11136 | 375.33 | 138 | 136 | 29.3 |
| B | 0 | 213 | 15477 | 551.99 | 137 | 134 | 27.8 |
| B | 5 | 255 | 9152 | 324.43 | 137 | 134 | 27.8 |
| B | 0 | 221 | 4383 | 152.86 | 137 | 134 | 27.8 |
| C | 0 | 10 | 92696 | 2757.54 | 137 | 137 | 33.6 |
| C | 15 | 214 | 54853 | 1630.12 | 137 | 137 | 33.6 |
| C | 14 | 254 | 13607 | 401.3 | 137 | 137 | 33.6 |
| D | 2 | 249 | 295636 | 8622.93 | 137 | 133 | 34.3 |
| D | 10 | 199 | 24472 | 710.22 | 137 | 133 | 34.3 |
| D | 10 | 253 | 21883 | 634.68 | 137 | 133 | 34.3 |
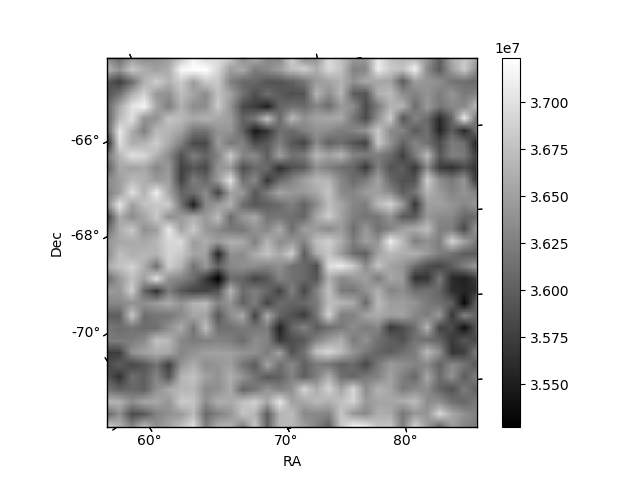
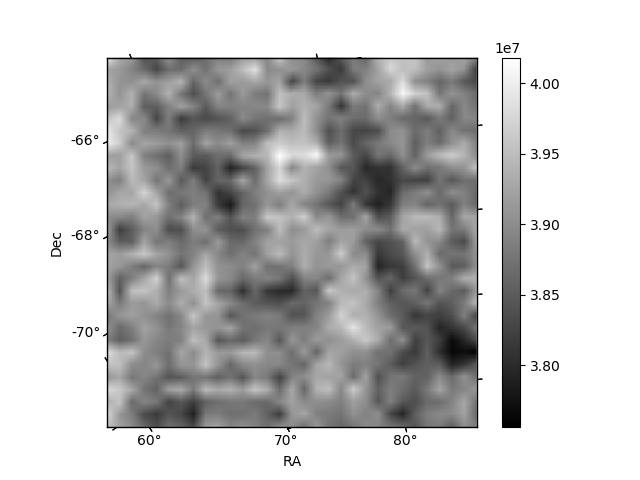
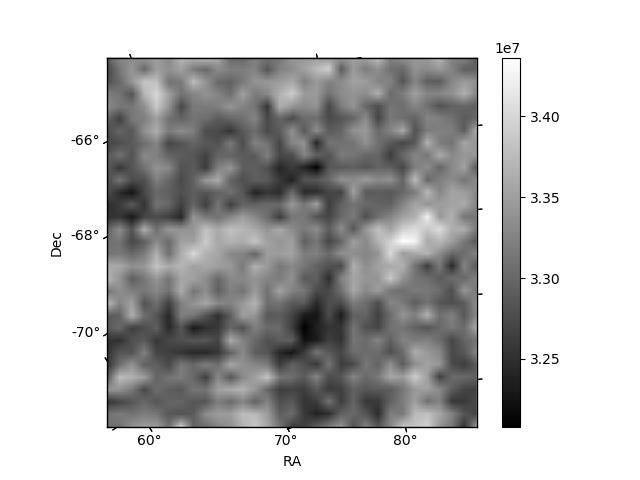
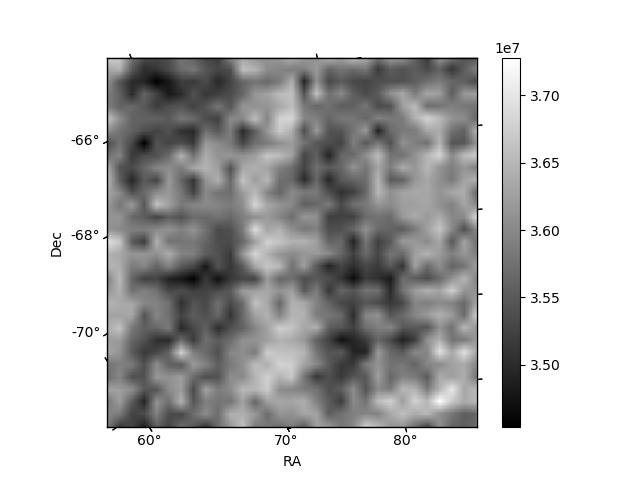
Histogram calculated using DETX and DETY for each event in the final _common_clean file
| Quadrant A | 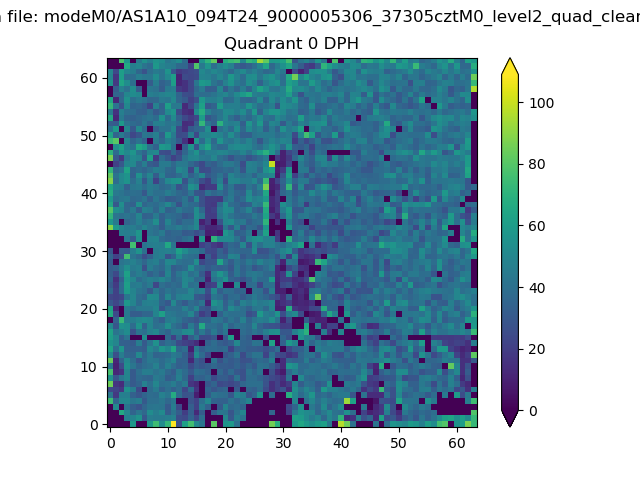 |
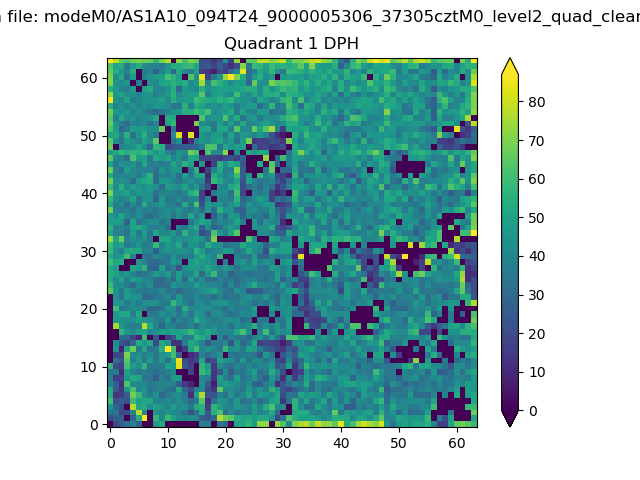 |
Quadrant B |
|---|---|---|---|
| Quadrant D | 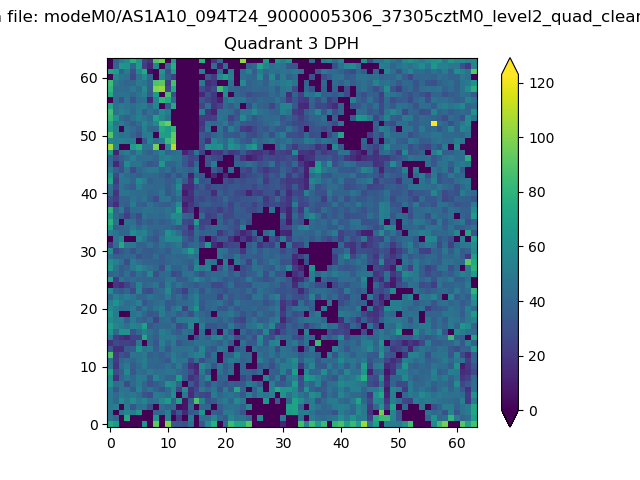 |
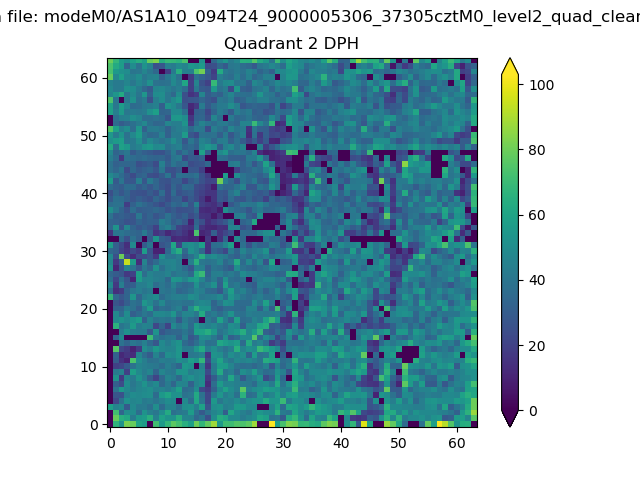 |
Quadrant C |
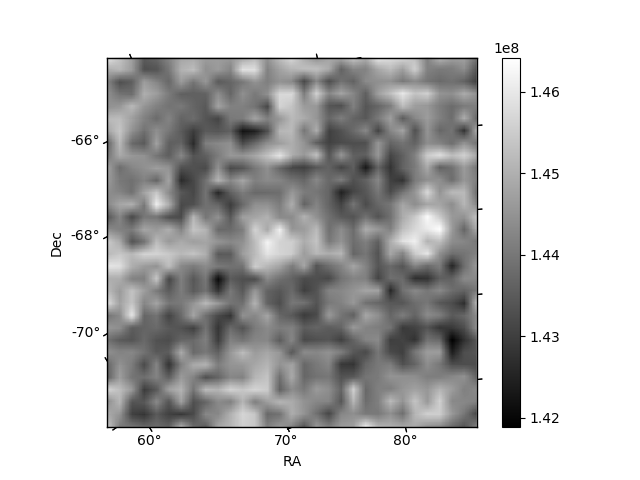
| Plot type | Count rate plots | Images |
|---|---|---|
| Comparison with Poisson distribution Blue bars denote a histogram of data divided into 1 sec bins. Red curve is a Poisson curve with rate = median count rate of data. |
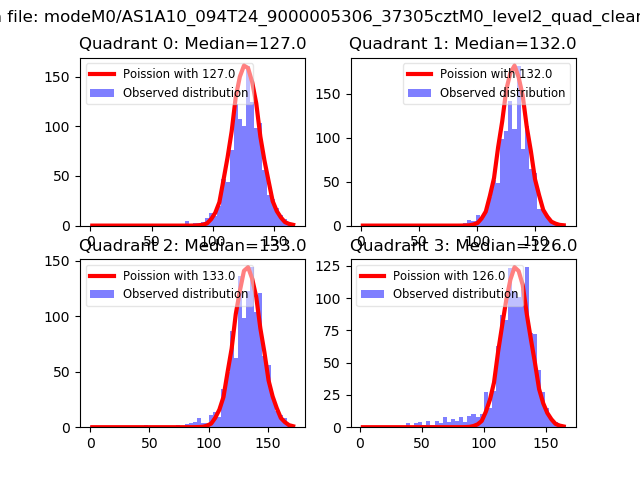 |
 |
| Quadrant-wise count rates Data is divided into 100 sec bins |
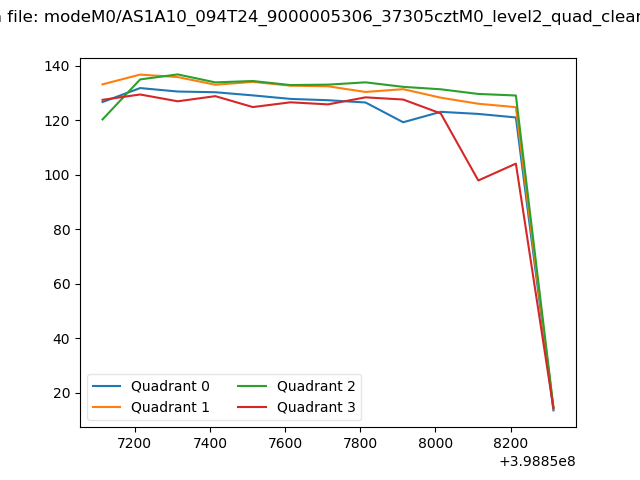 |
|
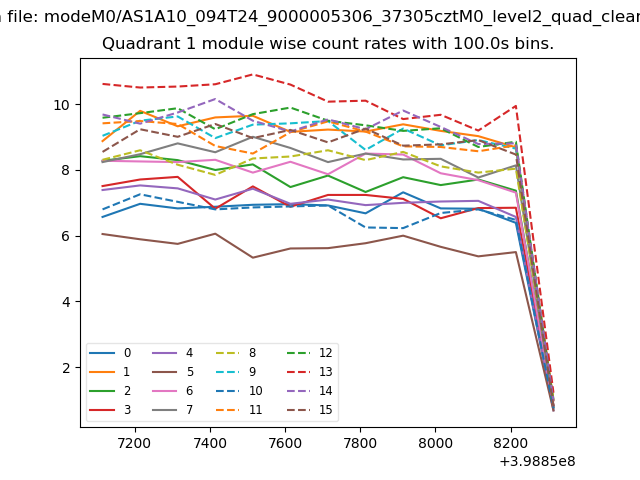
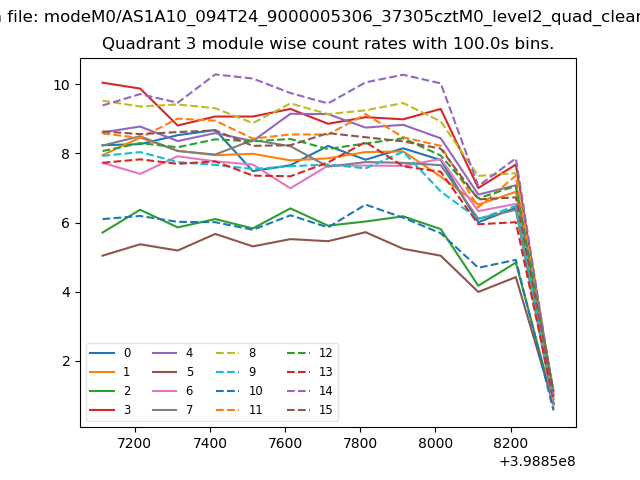
| Module-wise count rates for Quadrant A Data is divided into 100 sec bins |
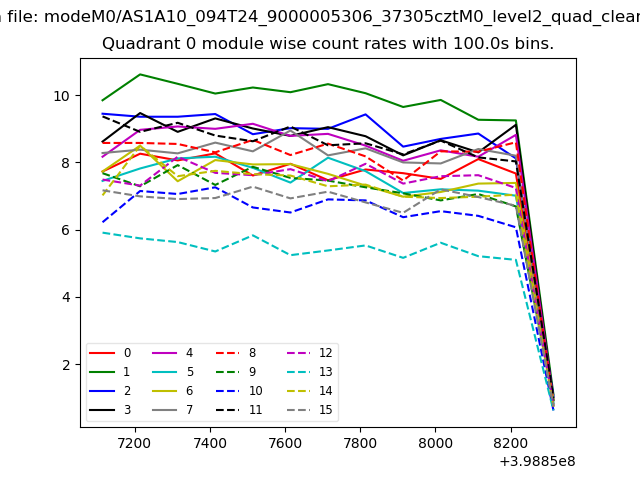 |
 |
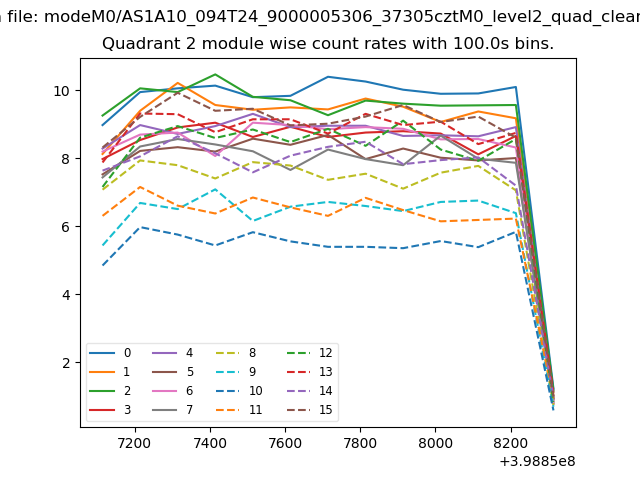
| Module-wise count rates for Quadrant B Data is divided into 100 sec bins |
 |
 |
| Module-wise count rates for Quadrant C Data is divided into 100 sec bins |
 |
 |
| Module-wise count rates for Quadrant D Data is divided into 100 sec bins |
 |
 |
| Parameter | Plot |
|---|---|
| CZT HV Monitor | 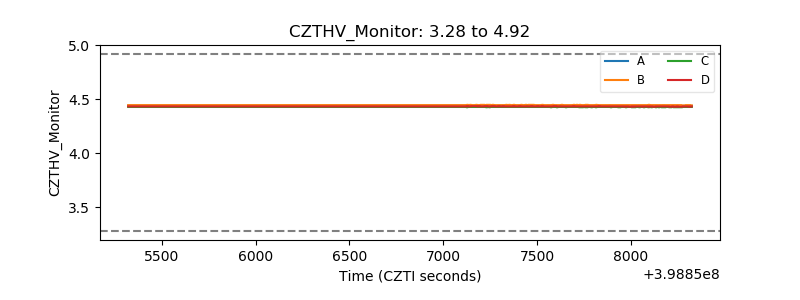 |
| D_VDD | 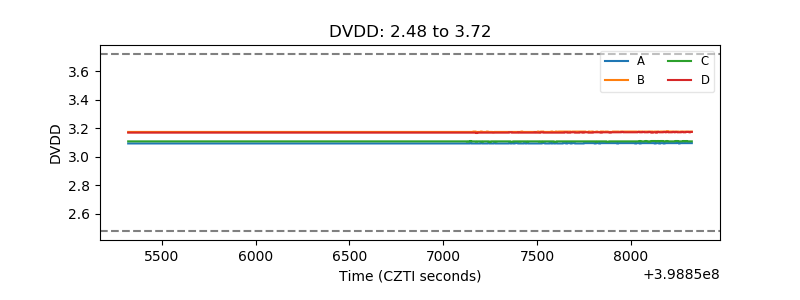 |
| Temperature 1 | 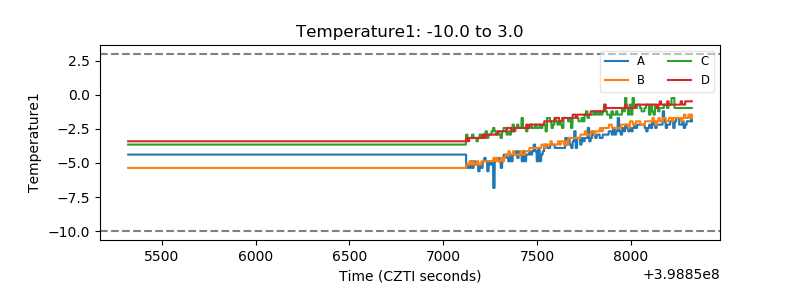 |
| Veto HV Monitor |  |
| Veto LLD | 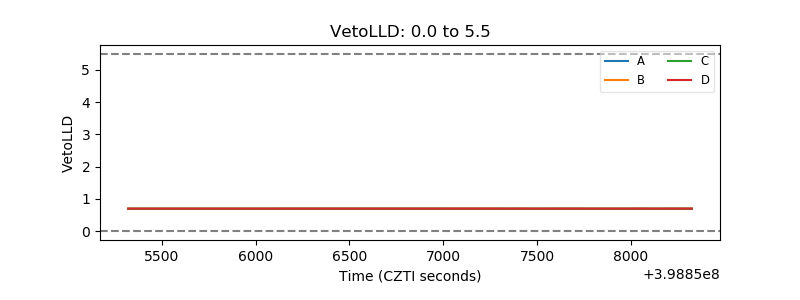 |
| Alpha Counter | 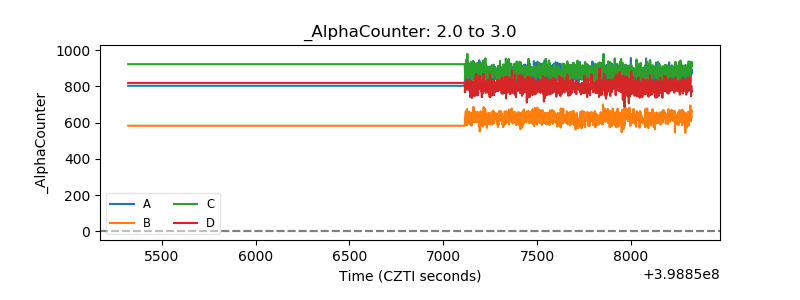 |
| _CPM_Rate |  |
| CZT Counter | 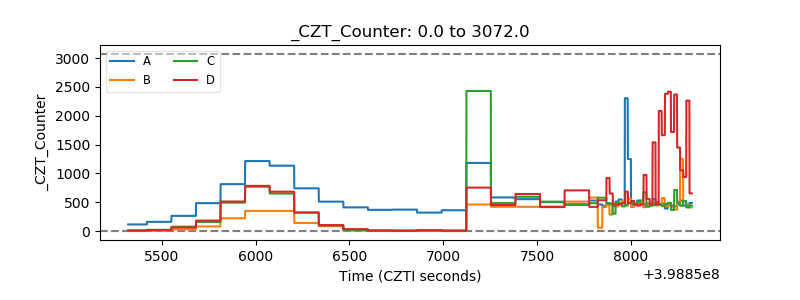 |
| +2.5 Volts monitor | 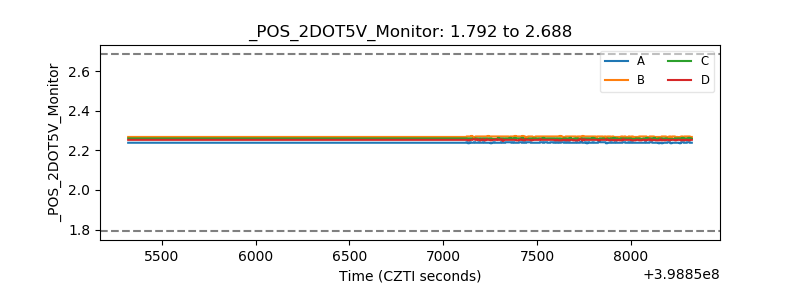 |
| +5 Volts monitor | 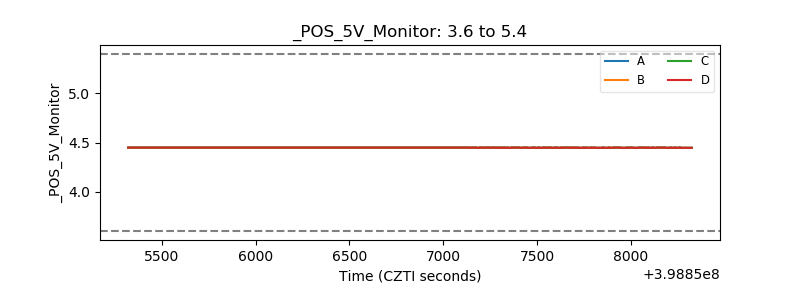 |
| _ROLL_ROT | 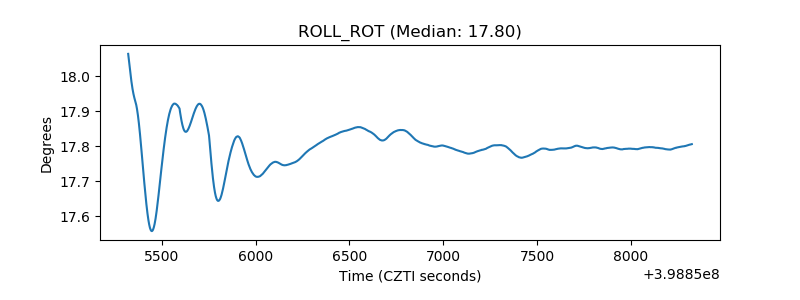 |
| _Roll_DEC | 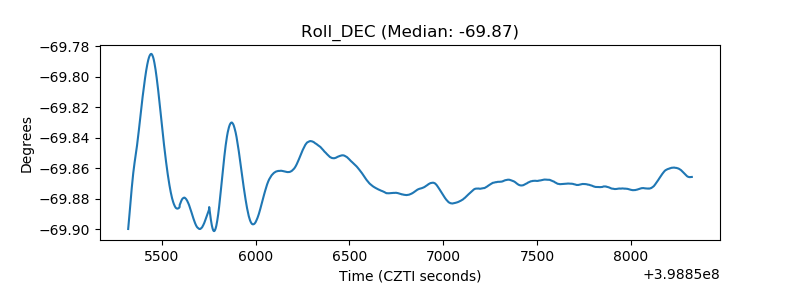 |
| _Roll_RA | 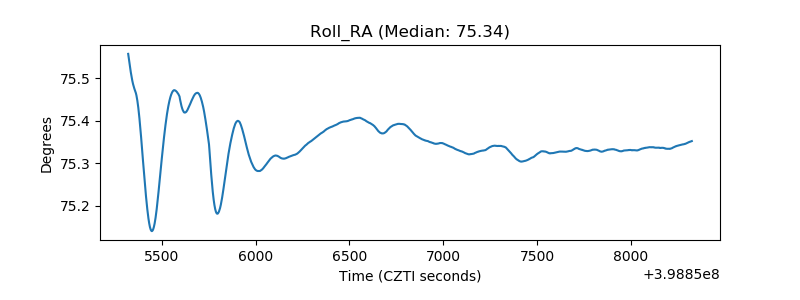 |
| Veto Counter | 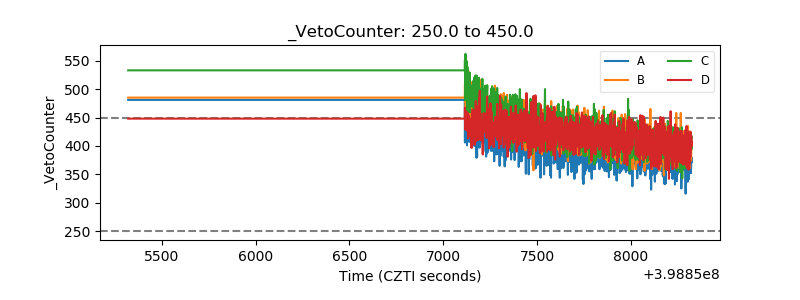 |