| Param | Original file | Final file |
|---|---|---|
| Filename | modeM0/AS1A10_094T24_9000005306_37306cztM0_level2.evt | modeM0/AS1A10_094T24_9000005306_37306cztM0_level2_quad_clean.evt |
| Size (bytes) | 265,052,160 | 60,410,880 |
| Size | 252.8 MB | 57.6 MB |
| Events in quadrant A | 1,736,396 | 393,288 |
| Events in quadrant B | 1,779,977 | 399,802 |
| Events in quadrant C | 1,708,777 | 403,548 |
| Events in quadrant D | 2,557,128 | 379,037 |
| Mode M0 | |||
|---|---|---|---|
| Quadrant | BADHDUFLAG | Total packets | Discarded packets |
| A | 0 | 7419 | 0 |
| B | 0 | 7655 | 0 |
| C | 0 | 7345 | 0 |
| D | 0 | 10055 | 0 |
| Mode SS | |||
|---|---|---|---|
| Quadrant | BADHDUFLAG | Total packets | Discarded packets |
| A | 0 | 72 | 0 |
| B | 0 | 72 | 0 |
| C | 0 | 72 | 0 |
| D | 0 | 72 | 0 |
| Quadrant | Total seconds | Saturated seconds | Saturation percentage |
|---|---|---|---|
| A | 3577 | 16 | 0.447302% |
| B | 3577 | 14 | 0.391389% |
| C | 3577 | 20 | 0.559128% |
| D | 3577 | 211 | 5.898798% |
Noise dominated data is calculated using 1-second bins in cleaned event files. If a bin has >2000 counts, and if more than 50% of those come from <1% of pixels, then it is considered to be noise-dominated and hence unusable.
| Quadrant | # 1 sec bins | Bins with >0 counts | Bins with >2000 counts | High rate bins dominated by noise | Noise dominated (total time) | Noise dominated (detector-on time) | Marked lightcurve |
|---|---|---|---|---|---|---|---|
| A | 3577 | 3577 | 9 | 9 | 0.25% | 0.25% | 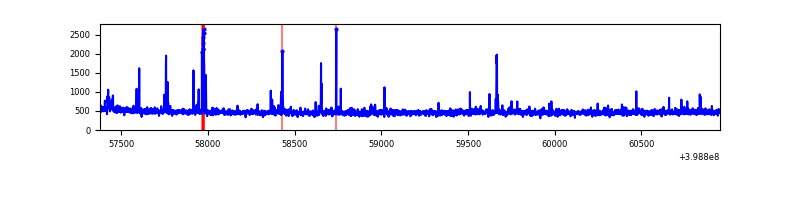 |
| B | 3577 | 3577 | 8 | 8 | 0.22% | 0.22% | 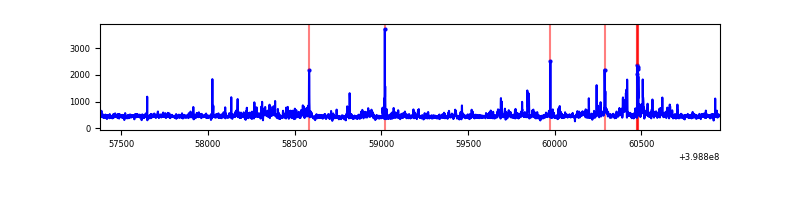 |
| C | 3577 | 3577 | 12 | 12 | 0.34% | 0.34% | 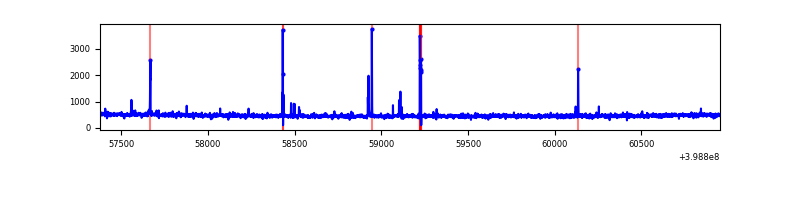 |
| D | 3577 | 3577 | 181 | 181 | 5.06% | 5.06% | 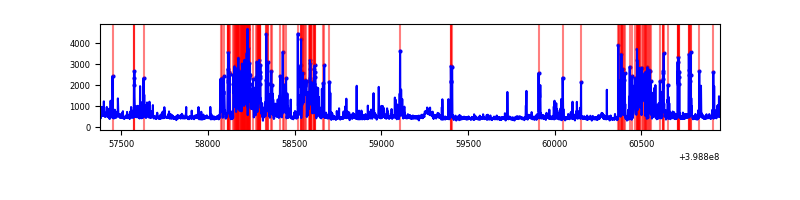 |
Top three noisy pixels from each quadrant. If the there are fewer than three noisy pixels in the level2.evt file, extra rows are filled as -1
| Pixel properties | Quadrant properties | ||||||
|---|---|---|---|---|---|---|---|
| Quadrant | DetID | PixID | Counts | Sigma | Mean | Median | Sigma |
| A | 10 | 83 | 117498 | 1454.83 | 393 | 385 | 80.5 |
| A | 13 | 248 | 48496 | 597.65 | 393 | 385 | 80.5 |
| A | 9 | 143 | 40124 | 493.65 | 393 | 385 | 80.5 |
| B | 0 | 213 | 95464 | 1270.99 | 391 | 381 | 74.8 |
| B | 5 | 255 | 64890 | 862.3 | 391 | 381 | 74.8 |
| B | 12 | 18 | 28704 | 378.6 | 391 | 381 | 74.8 |
| C | 15 | 214 | 146005 | 1613.84 | 383 | 385 | 90.2 |
| C | 14 | 254 | 62866 | 692.45 | 383 | 385 | 90.2 |
| C | 12 | 247 | 3250 | 31.75 | 383 | 385 | 90.2 |
| D | 2 | 249 | 569862 | 6084.12 | 380 | 369 | 93.6 |
| D | 10 | 199 | 120458 | 1282.96 | 380 | 369 | 93.6 |
| D | 12 | 233 | 116197 | 1237.44 | 380 | 369 | 93.6 |
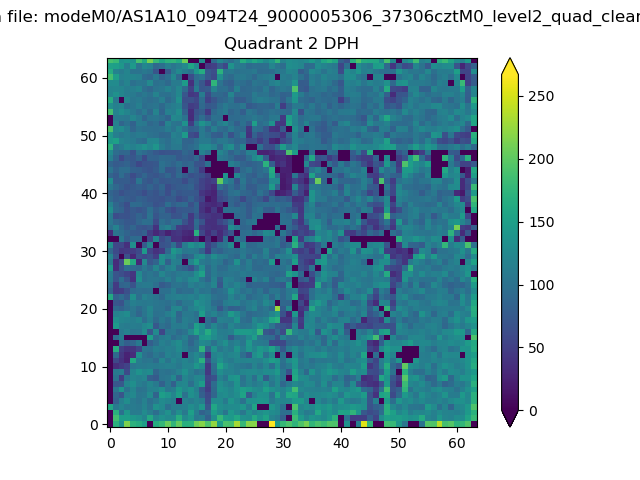
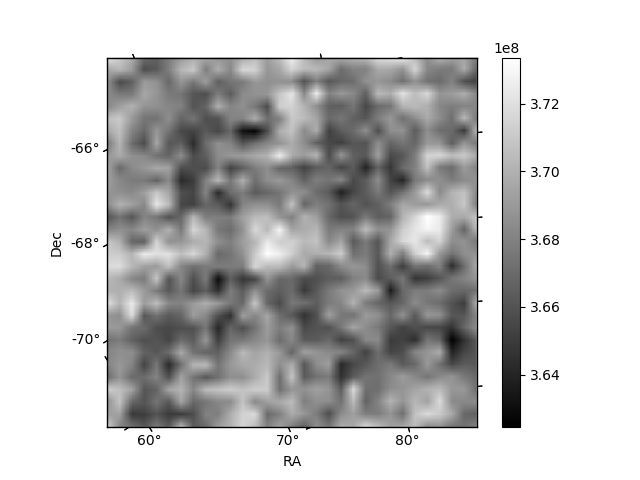
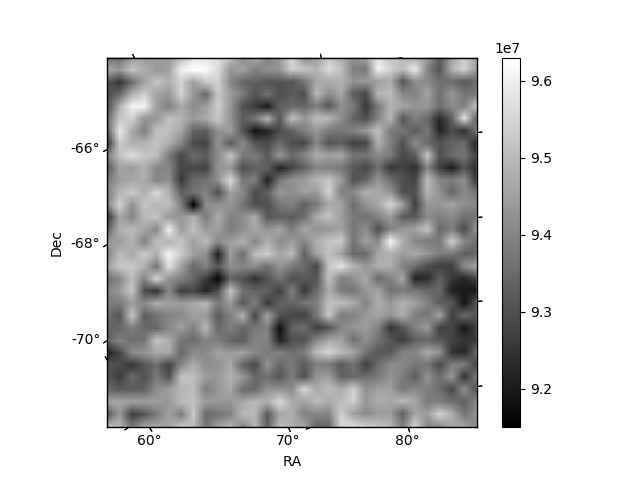
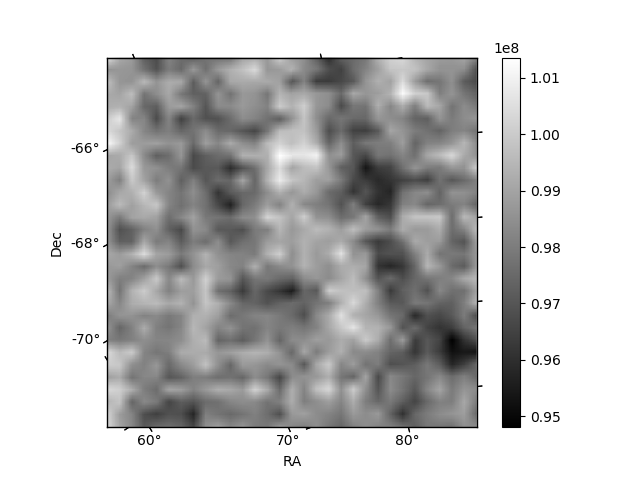
Histogram calculated using DETX and DETY for each event in the final _common_clean file
| Quadrant A | 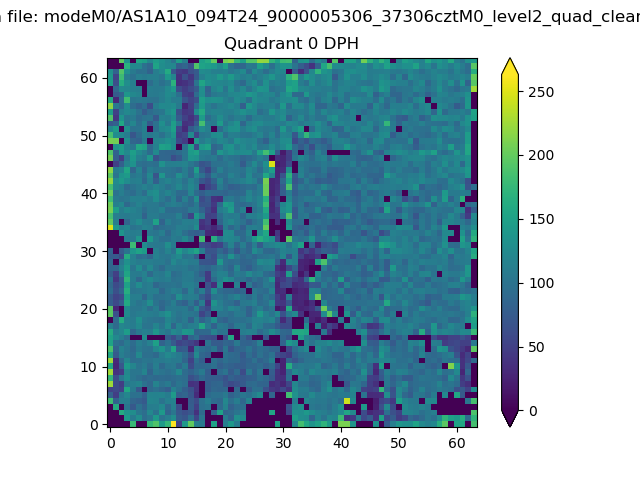 |
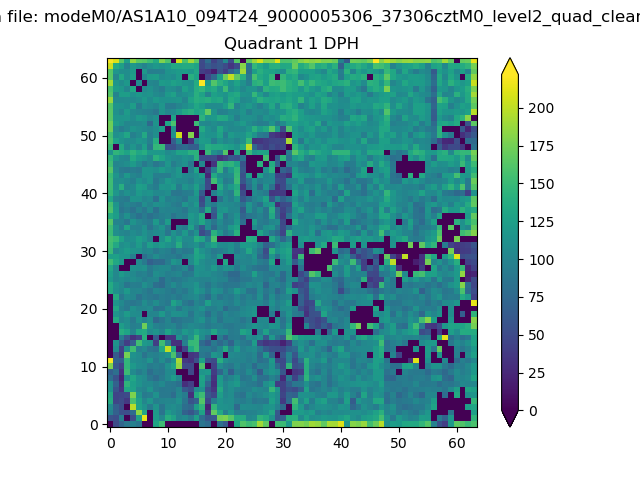 |
Quadrant B |
|---|---|---|---|
| Quadrant D | 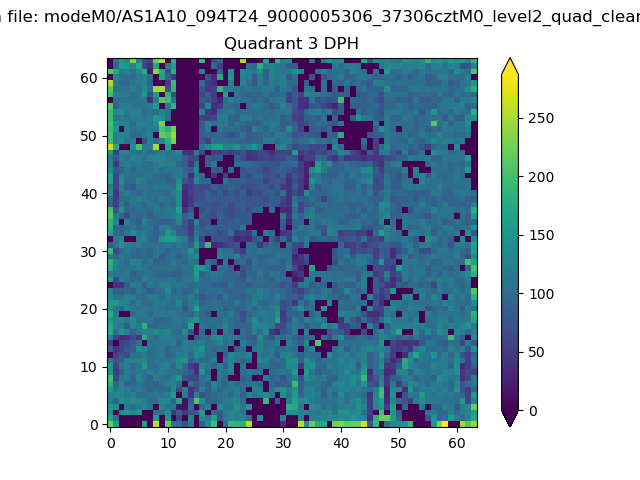 |
 |
Quadrant C |
| Plot type | Count rate plots | Images |
|---|---|---|
| Comparison with Poisson distribution Blue bars denote a histogram of data divided into 1 sec bins. Red curve is a Poisson curve with rate = median count rate of data. |
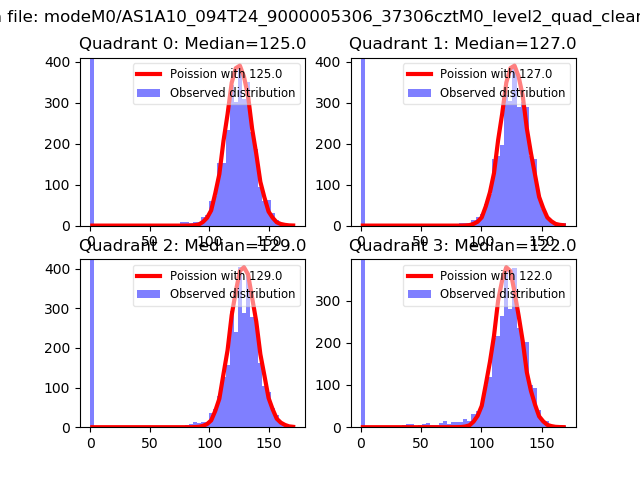 |
 |
| Quadrant-wise count rates Data is divided into 100 sec bins |
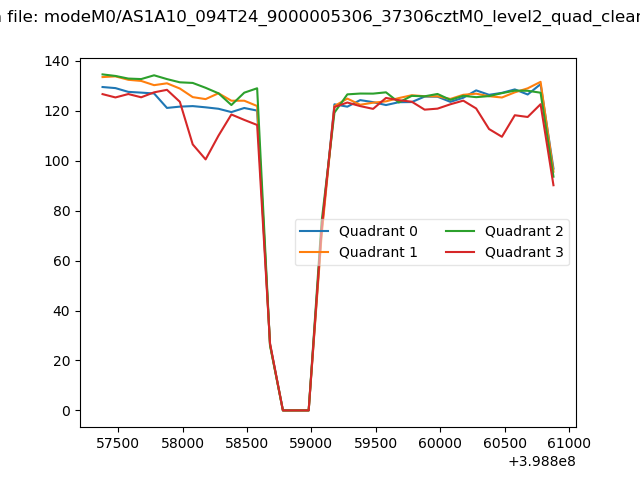 |
|
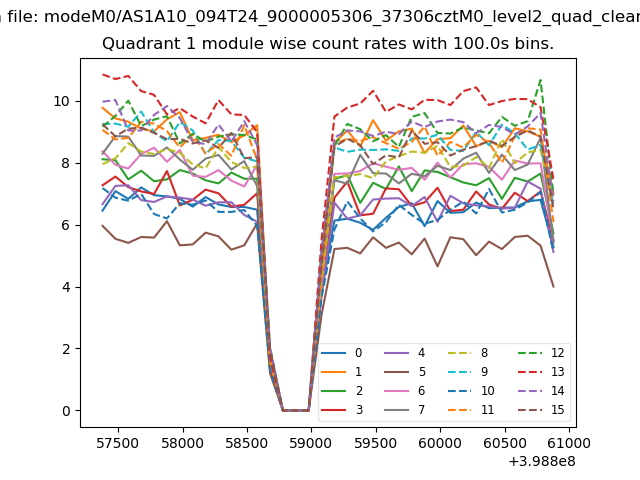
| Module-wise count rates for Quadrant A Data is divided into 100 sec bins |
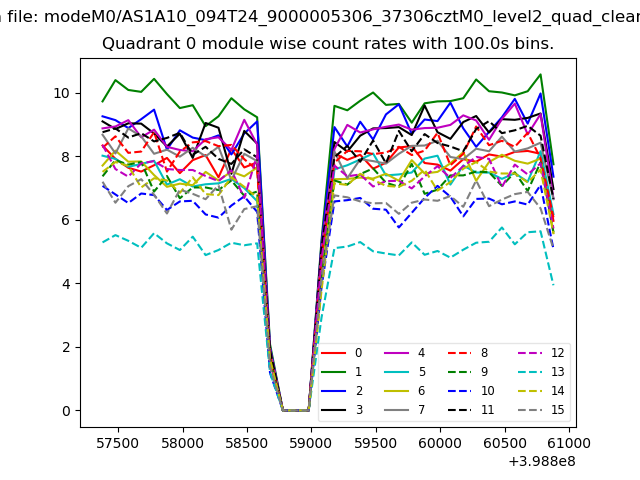 |
 |
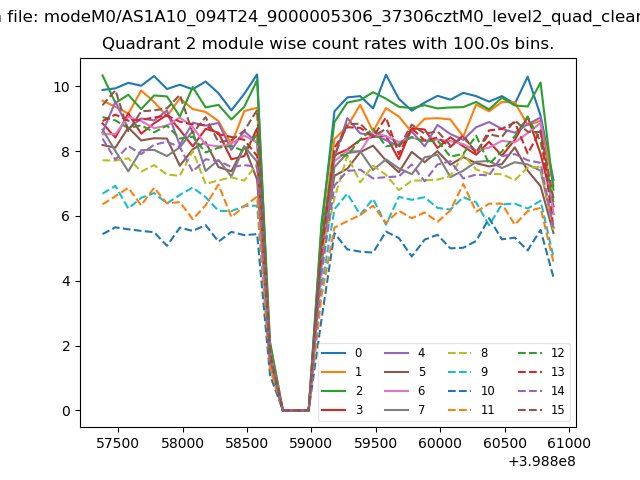
| Module-wise count rates for Quadrant B Data is divided into 100 sec bins |
 |
 |
| Module-wise count rates for Quadrant C Data is divided into 100 sec bins |
 |
 |
| Module-wise count rates for Quadrant D Data is divided into 100 sec bins |
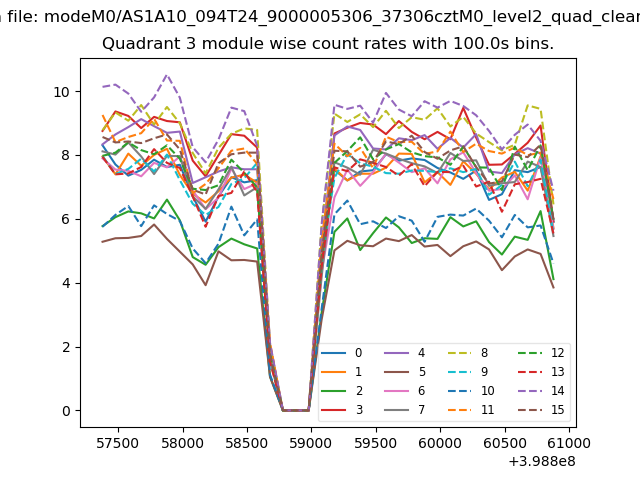 |
 |
| Parameter | Plot |
|---|---|
| CZT HV Monitor | 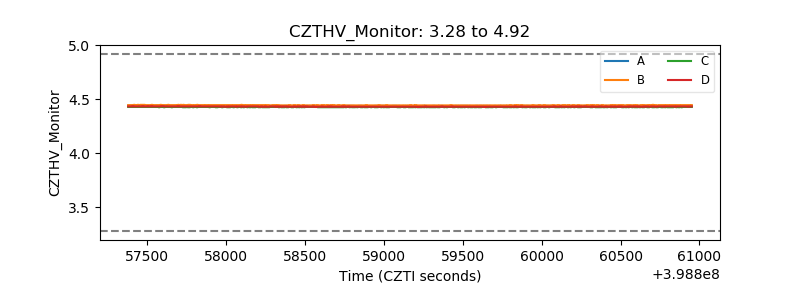 |
| D_VDD | 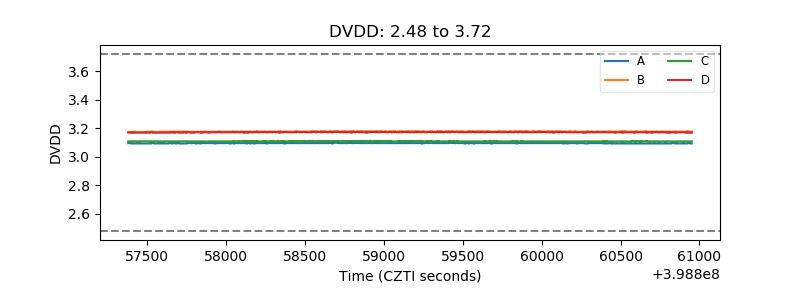 |
| Temperature 1 | 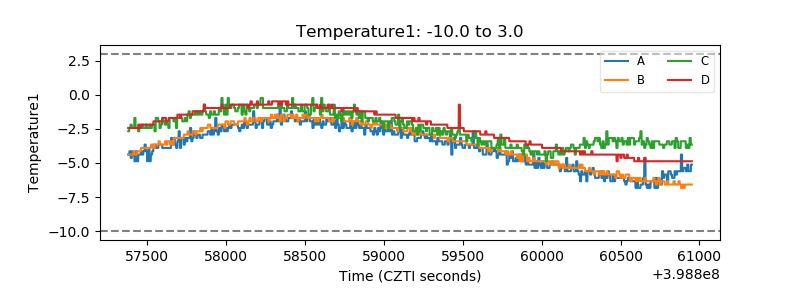 |
| Veto HV Monitor | 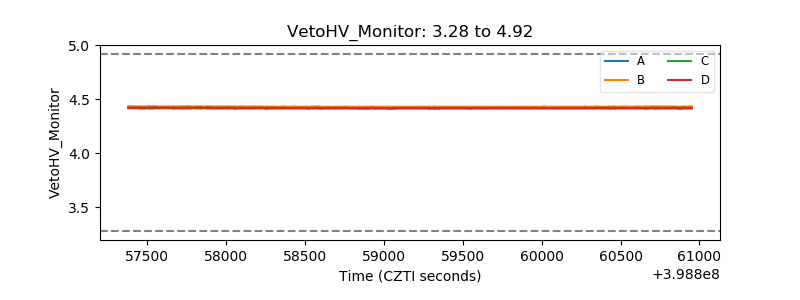 |
| Veto LLD | 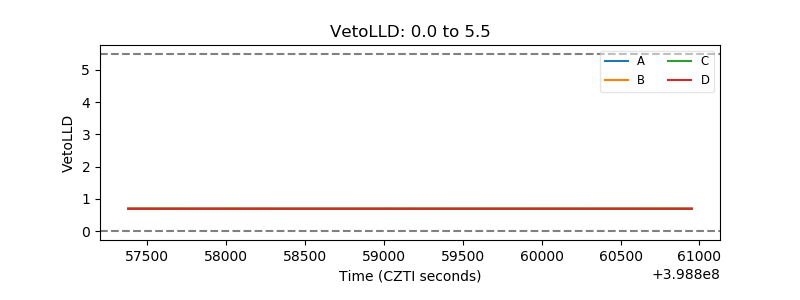 |
| Alpha Counter | 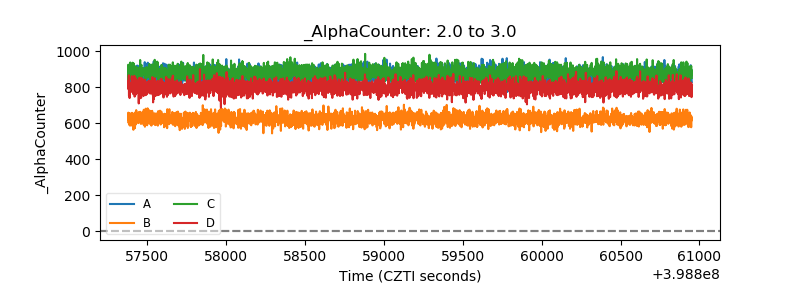 |
| _CPM_Rate | 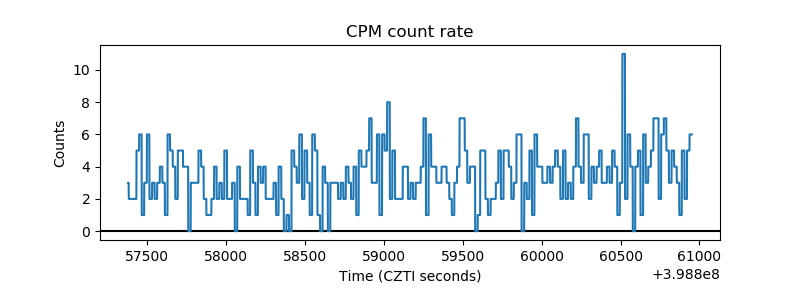 |
| CZT Counter | 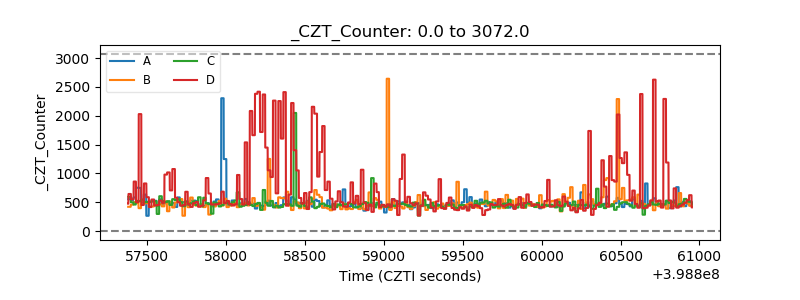 |
| +2.5 Volts monitor | 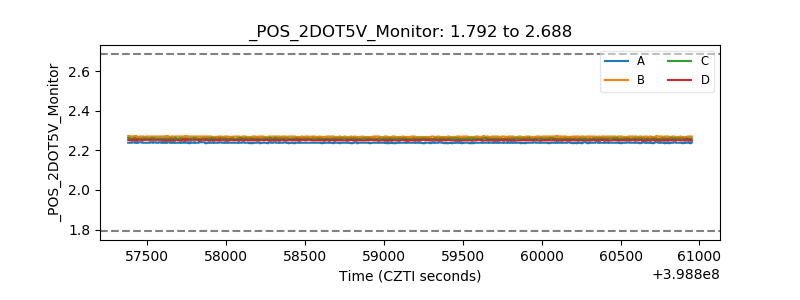 |
| +5 Volts monitor | 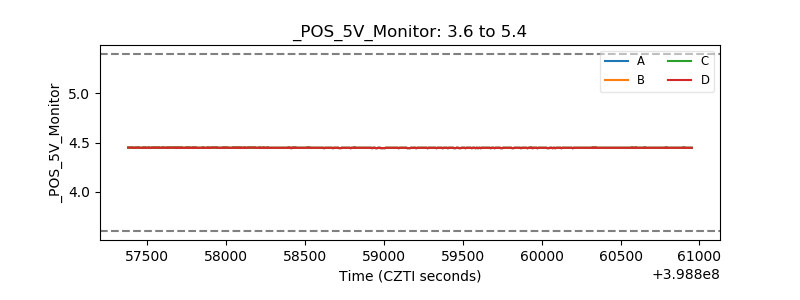 |
| _ROLL_ROT | 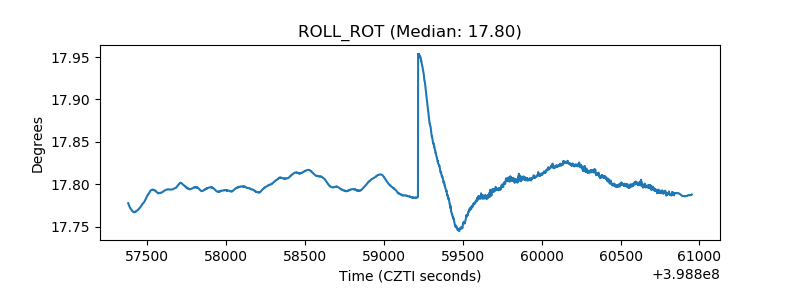 |
| _Roll_DEC | 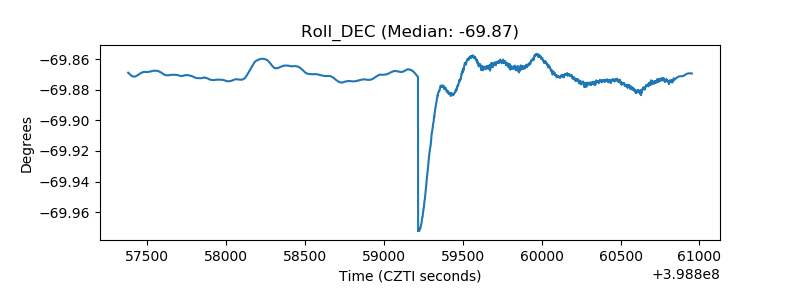 |
| _Roll_RA | 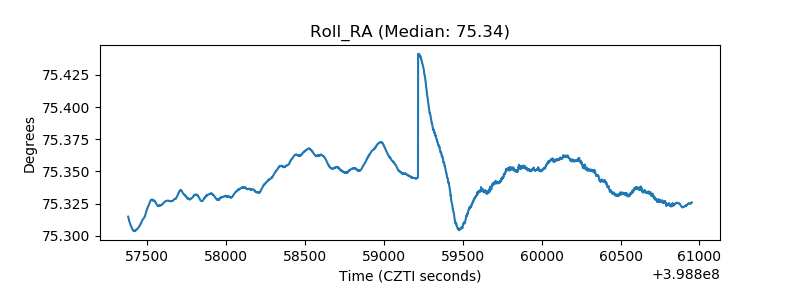 |
| Veto Counter | 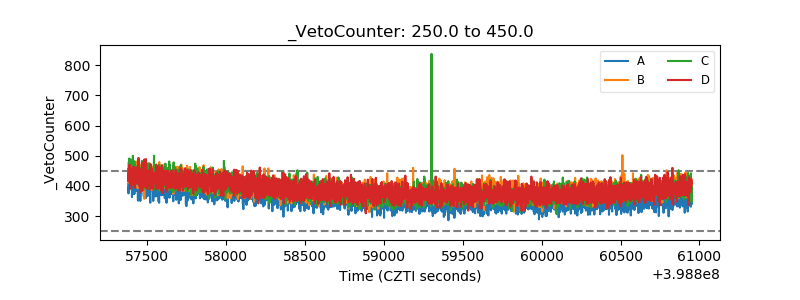 |