| Param | Original file | Final file |
|---|---|---|
| Filename | modeM0/AS1A11_030T02_9000005310cztM0_level2.fits | modeM0/AS1A11_030T02_9000005310cztM0_level2_quad_clean.evt |
| Size (bytes) | 1,171,088,640 | 1,100,021,760 |
| Size | 1.1 GB | 1.0 GB |
| Events in quadrant A | 7,145,574 | 6,628,242 |
| Events in quadrant B | 6,830,570 | 6,630,063 |
| Events in quadrant C | 6,979,276 | 6,193,499 |
| Events in quadrant D | 5,822,916 | 5,182,112 |
| Mode M0 | |||
|---|---|---|---|
| Quadrant | BADHDUFLAG | Total packets | Discarded packets |
| A | 0 | 285301 | 0 |
| B | 0 | 291322 | 0 |
| C | 0 | 319052 | 0 |
| D | 0 | 400276 | 0 |
| Mode SS | |||
|---|---|---|---|
| Quadrant | BADHDUFLAG | Total packets | Discarded packets |
| A | 0 | 2592 | 0 |
| B | 0 | 2592 | 0 |
| C | 0 | 2592 | 0 |
| D | 0 | 2592 | 0 |
| Mode M9 | |||
|---|---|---|---|
| Quadrant | BADHDUFLAG | Total packets | Discarded packets |
| A | 0 | 480 | 0 |
| B | 0 | 480 | 0 |
| C | 0 | 480 | 0 |
| D | 0 | 480 | 0 |
| Quadrant | Total seconds | Saturated seconds | Saturation percentage |
|---|---|---|---|
| A | 126655 | 1719 | 1.357230% |
| B | 126655 | 2977 | 2.350480% |
| C | 126655 | 4614 | 3.642967% |
| D | 126655 | 14677 | 11.588173% |
Noise dominated data is calculated using 1-second bins in cleaned event files. If a bin has >2000 counts, and if more than 50% of those come from <1% of pixels, then it is considered to be noise-dominated and hence unusable.
| Quadrant | # 1 sec bins | Bins with >0 counts | Bins with >2000 counts | High rate bins dominated by noise | Noise dominated (total time) | Noise dominated (detector-on time) | Marked lightcurve |
|---|---|---|---|---|---|---|---|
| A | 174811 | 126432 | 0 | 0 | 0.00% | 0.00% |  |
| B | 174811 | 126590 | 0 | 0 | 0.00% | 0.00% |  |
| C | 174811 | 126588 | 0 | 0 | 0.00% | 0.00% |  |
| D | 174811 | 126519 | 0 | 0 | 0.00% | 0.00% |  |
Top three noisy pixels from each quadrant. If the there are fewer than three noisy pixels in the level2.evt file, extra rows are filled as -1
| Pixel properties | Quadrant properties | ||||||
|---|---|---|---|---|---|---|---|
| Quadrant | DetID | PixID | Counts | Sigma | Mean | Median | Sigma |
| A | 9 | 19 | 5922 | 9.08 | 1873 | 1757 | 458.8 |
| A | 7 | 110 | 5843 | 8.91 | 1873 | 1757 | 458.8 |
| A | 0 | 29 | 5646 | 8.48 | 1873 | 1757 | 458.8 |
| B | 2 | 9 | 5967 | 12.01 | 1813 | 1731 | 352.8 |
| B | 3 | 80 | 5368 | 10.31 | 1813 | 1731 | 352.8 |
| B | 2 | 8 | 4830 | 8.78 | 1813 | 1731 | 352.8 |
| C | 1 | 81 | 5855 | 8.75 | 1846 | 1731 | 471.3 |
| C | 1 | 80 | 5665 | 8.35 | 1846 | 1731 | 471.3 |
| C | 3 | 203 | 5568 | 8.14 | 1846 | 1731 | 471.3 |
| D | 7 | 3 | 4252 | 6.2 | 1667 | 1525 | 440.2 |
| D | 4 | 160 | 4229 | 6.14 | 1667 | 1525 | 440.2 |
| D | 6 | 38 | 4210 | 6.1 | 1667 | 1525 | 440.2 |
Histogram calculated using DETX and DETY for each event in the final _common_clean file
| Quadrant A |  |
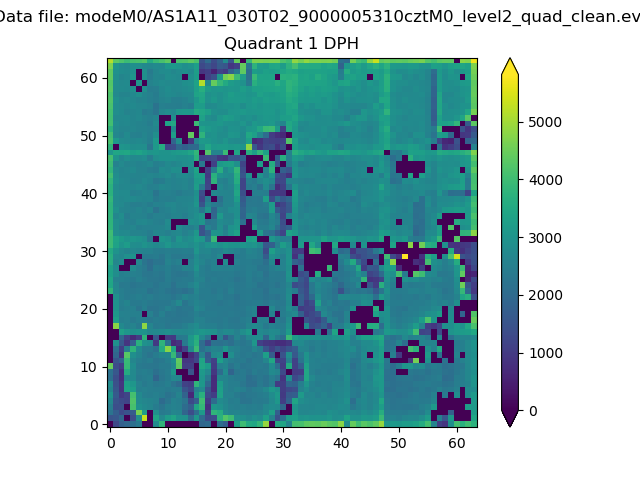 |
Quadrant B |
|---|---|---|---|
| Quadrant D |  |
 |
Quadrant C |
| Plot type | Count rate plots | Images |
|---|---|---|
| Comparison with Poisson distribution Blue bars denote a histogram of data divided into 1 sec bins. Red curve is a Poisson curve with rate = median count rate of data. |
 |
 |
| Quadrant-wise count rates Data is divided into 100 sec bins |
 |
|
| Module-wise count rates for Quadrant A Data is divided into 100 sec bins |
 |
 |
| Module-wise count rates for Quadrant B Data is divided into 100 sec bins |
 |
 |
| Module-wise count rates for Quadrant C Data is divided into 100 sec bins |
 |
 |
| Module-wise count rates for Quadrant D Data is divided into 100 sec bins |
 |
 |
| Parameter | Plot |
|---|---|
| CZT HV Monitor |  |
| D_VDD |  |
| Temperature 1 |  |
| Veto HV Monitor |  |
| Veto LLD | 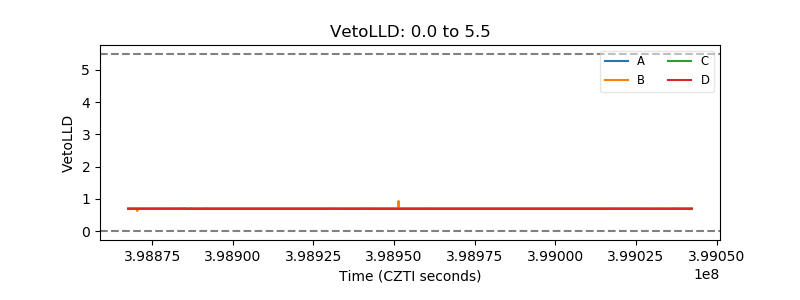 |
| Alpha Counter |  |
| _CPM_Rate |  |
| CZT Counter |  |
| +2.5 Volts monitor |  |
| +5 Volts monitor |  |
| _ROLL_ROT |  |
| _Roll_DEC | 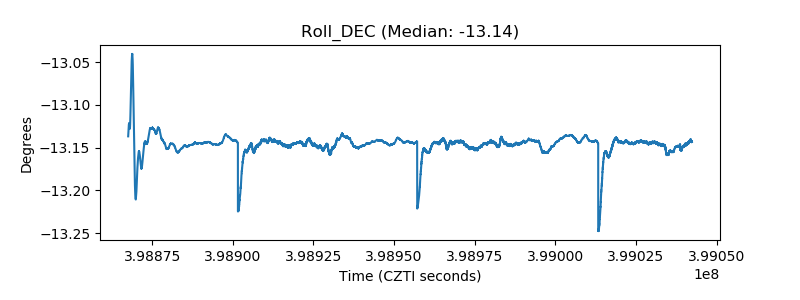 |
| _Roll_RA | 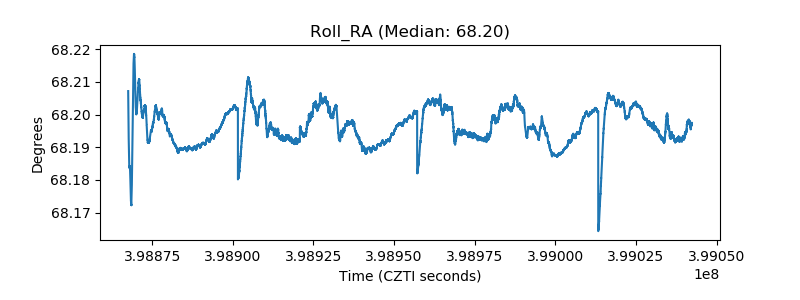 |
| Veto Counter |  |