| Param | Original file | Final file |
|---|---|---|
| Filename | modeM0/AS1A11_030T02_9000005310_37307cztM0_level2.evt | modeM0/AS1A11_030T02_9000005310_37307cztM0_level2_quad_clean.evt |
| Size (bytes) | 125,677,440 | 12,130,560 |
| Size | 119.9 MB | 11.6 MB |
| Events in quadrant A | 867,111 | 64,128 |
| Events in quadrant B | 873,588 | 64,481 |
| Events in quadrant C | 872,265 | 62,147 |
| Events in quadrant D | 1,083,858 | 59,807 |
| Mode M0 | |||
|---|---|---|---|
| Quadrant | BADHDUFLAG | Total packets | Discarded packets |
| A | 0 | 3508 | 2 |
| B | 0 | 3606 | 1 |
| C | 0 | 3531 | 1 |
| D | 0 | 4282 | 1 |
| Mode SS | |||
|---|---|---|---|
| Quadrant | BADHDUFLAG | Total packets | Discarded packets |
| A | 0 | 32 | 0 |
| B | 0 | 32 | 0 |
| C | 0 | 32 | 0 |
| D | 0 | 32 | 0 |
| Mode M9 | |||
|---|---|---|---|
| Quadrant | BADHDUFLAG | Total packets | Discarded packets |
| A | 0 | 17 | 0 |
| B | 0 | 17 | 0 |
| C | 0 | 17 | 0 |
| D | 0 | 17 | 0 |
| Quadrant | Total seconds | Saturated seconds | Saturation percentage |
|---|---|---|---|
| A | 1576 | 15 | 0.951777% |
| B | 1576 | 26 | 1.649746% |
| C | 1576 | 17 | 1.078680% |
| D | 1576 | 54 | 3.426396% |
Noise dominated data is calculated using 1-second bins in cleaned event files. If a bin has >2000 counts, and if more than 50% of those come from <1% of pixels, then it is considered to be noise-dominated and hence unusable.
| Quadrant | # 1 sec bins | Bins with >0 counts | Bins with >2000 counts | High rate bins dominated by noise | Noise dominated (total time) | Noise dominated (detector-on time) | Marked lightcurve |
|---|---|---|---|---|---|---|---|
| A | 3219 | 1577 | 6 | 6 | 0.19% | 0.38% | 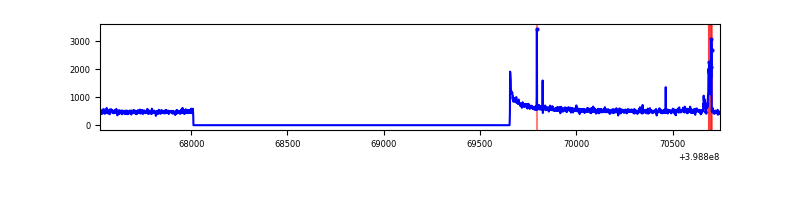 |
| B | 3219 | 1577 | 15 | 15 | 0.47% | 0.95% | 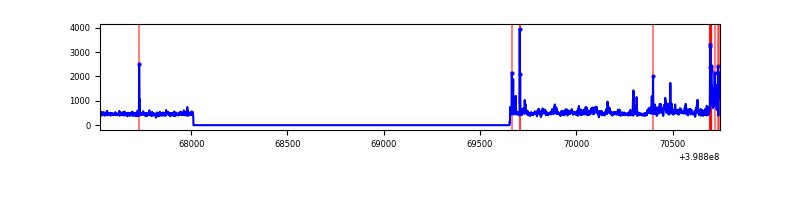 |
| C | 3219 | 1577 | 18 | 18 | 0.56% | 1.14% | 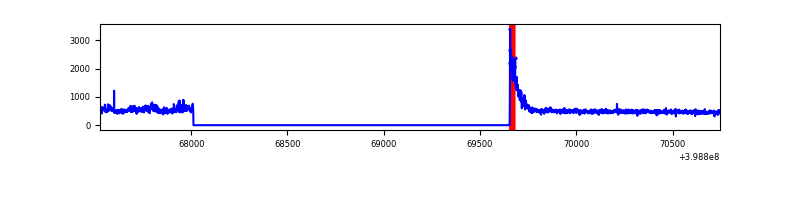 |
| D | 3219 | 1577 | 34 | 34 | 1.06% | 2.16% | 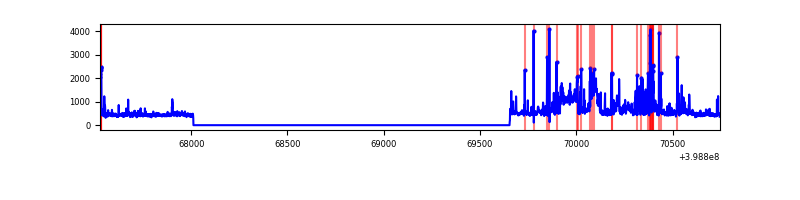 |
Top three noisy pixels from each quadrant. If the there are fewer than three noisy pixels in the level2.evt file, extra rows are filled as -1
| Pixel properties | Quadrant properties | ||||||
|---|---|---|---|---|---|---|---|
| Quadrant | DetID | PixID | Counts | Sigma | Mean | Median | Sigma |
| A | 10 | 83 | 107549 | 2786.76 | 183 | 179 | 38.5 |
| A | 9 | 143 | 32729 | 844.83 | 183 | 179 | 38.5 |
| A | 13 | 248 | 10250 | 261.39 | 183 | 179 | 38.5 |
| B | 5 | 172 | 56963 | 1571.45 | 179 | 175 | 36.1 |
| B | 0 | 213 | 54657 | 1507.64 | 179 | 175 | 36.1 |
| B | 5 | 255 | 19298 | 529.18 | 179 | 175 | 36.1 |
| C | 0 | 10 | 80391 | 1860.51 | 177 | 177 | 43.1 |
| C | 15 | 214 | 69031 | 1597.02 | 177 | 177 | 43.1 |
| C | 10 | 49 | 26779 | 617.02 | 177 | 177 | 43.1 |
| D | 13 | 249 | 184104 | 4134.85 | 176 | 171 | 44.5 |
| D | 2 | 249 | 131251 | 2946.7 | 176 | 171 | 44.5 |
| D | 5 | 222 | 39930 | 893.79 | 176 | 171 | 44.5 |
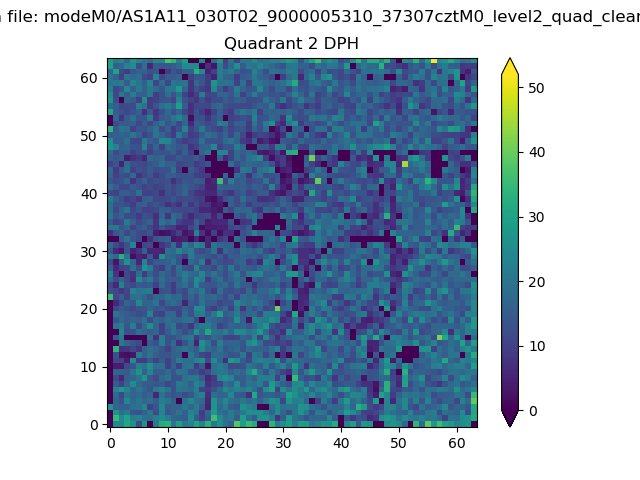
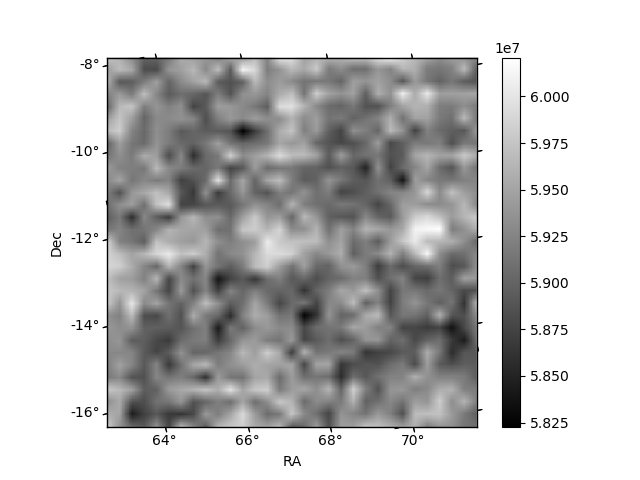
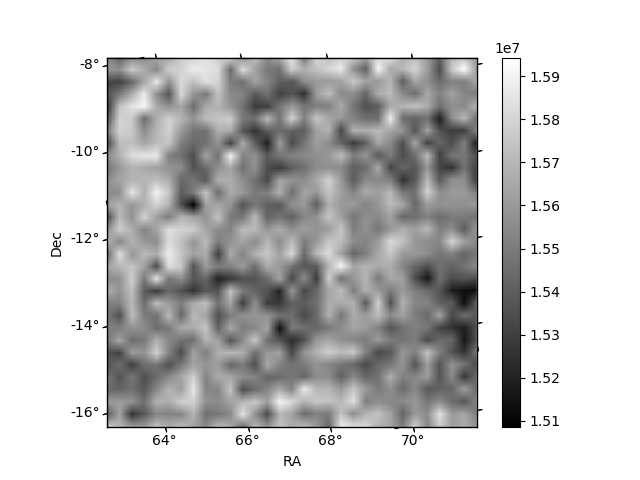
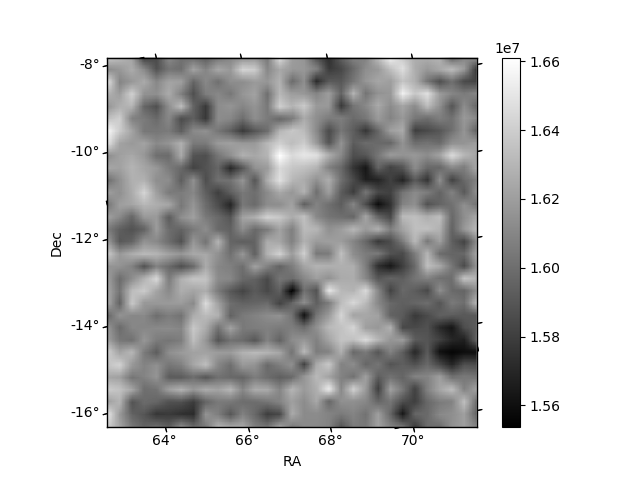
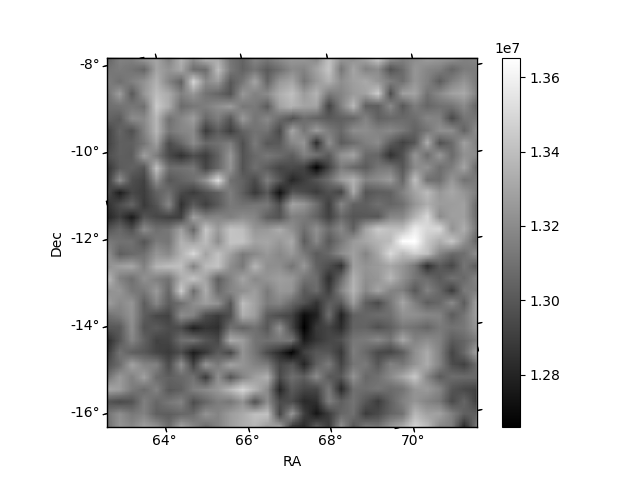
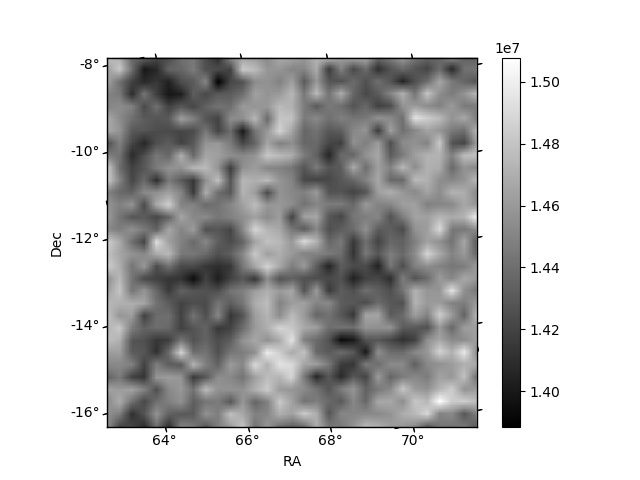
Histogram calculated using DETX and DETY for each event in the final _common_clean file
| Quadrant A | 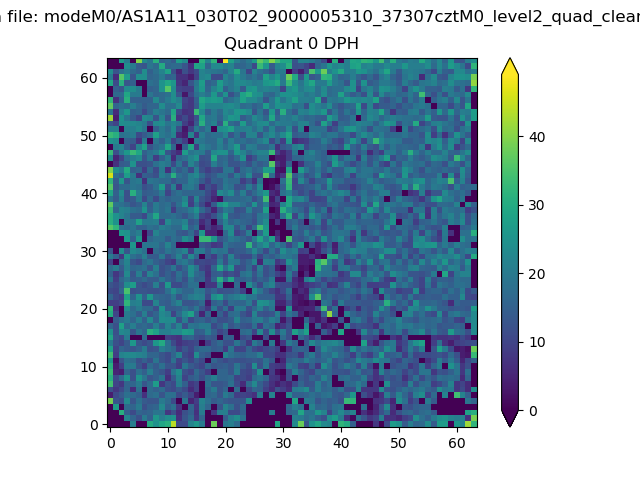 |
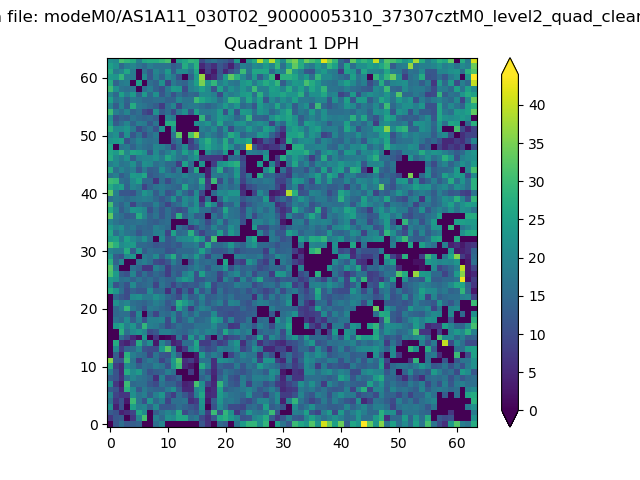 |
Quadrant B |
|---|---|---|---|
| Quadrant D | 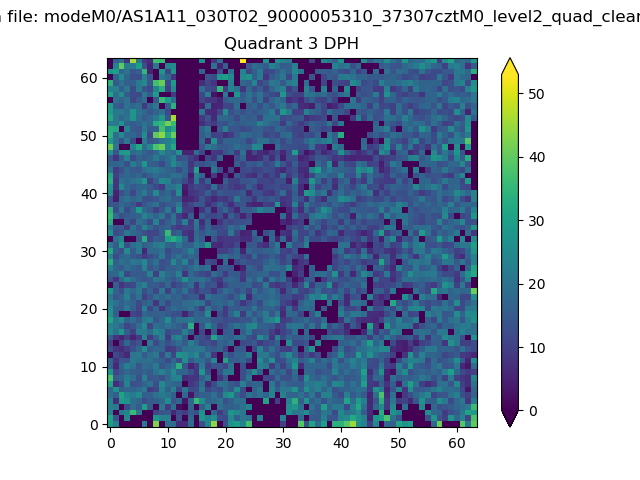 |
 |
Quadrant C |
| Plot type | Count rate plots | Images |
|---|---|---|
| Comparison with Poisson distribution Blue bars denote a histogram of data divided into 1 sec bins. Red curve is a Poisson curve with rate = median count rate of data. |
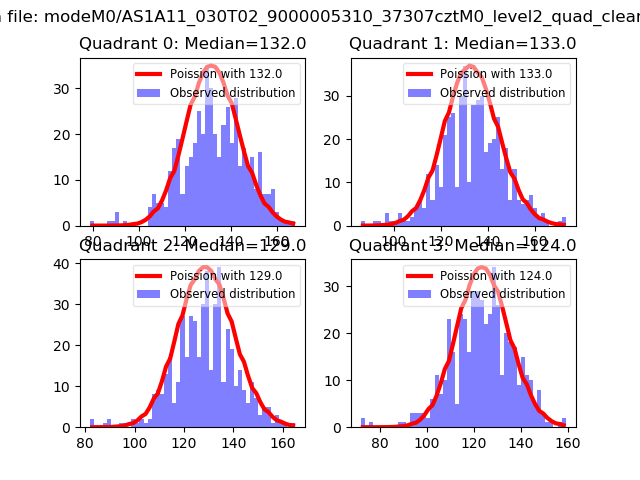 |
 |
| Quadrant-wise count rates Data is divided into 100 sec bins |
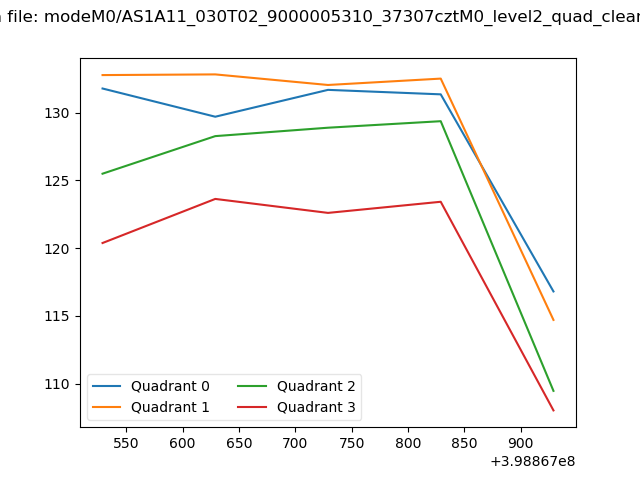 |
|
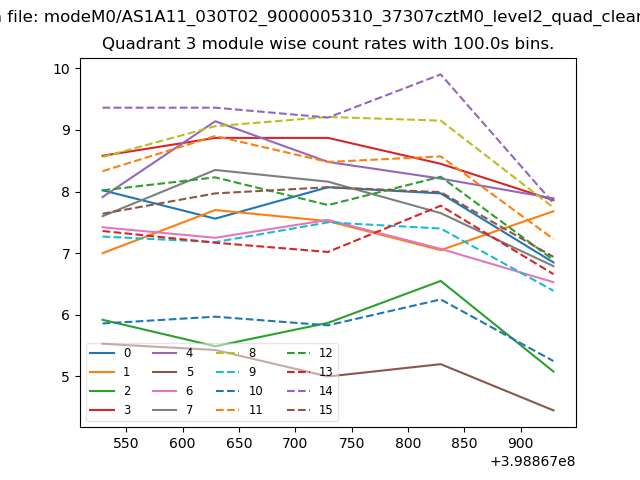
| Module-wise count rates for Quadrant A Data is divided into 100 sec bins |
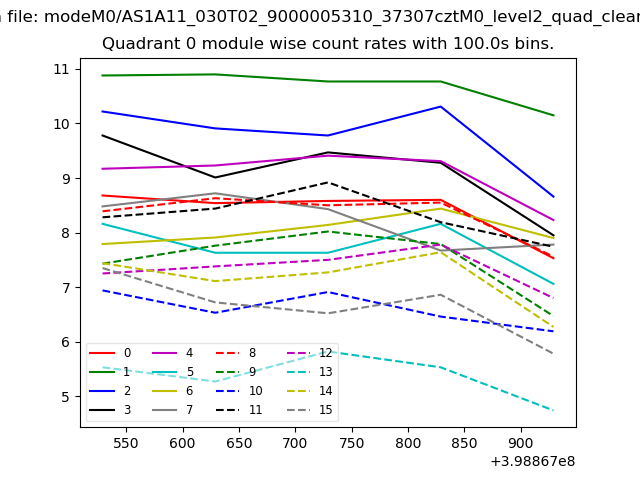 |
 |
| Module-wise count rates for Quadrant B Data is divided into 100 sec bins |
 |
 |
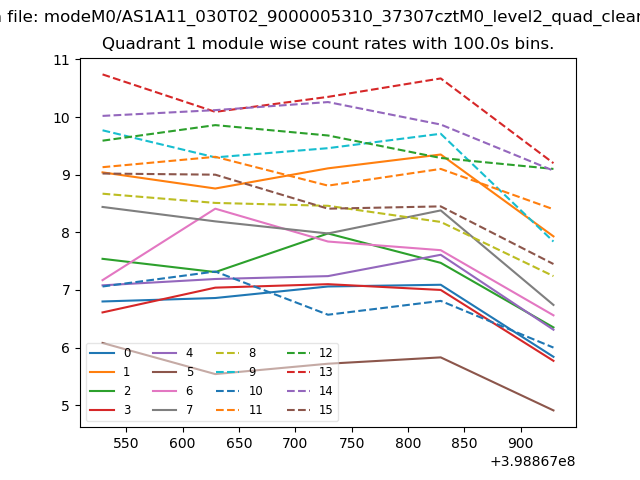
| Module-wise count rates for Quadrant C Data is divided into 100 sec bins |
 |
 |
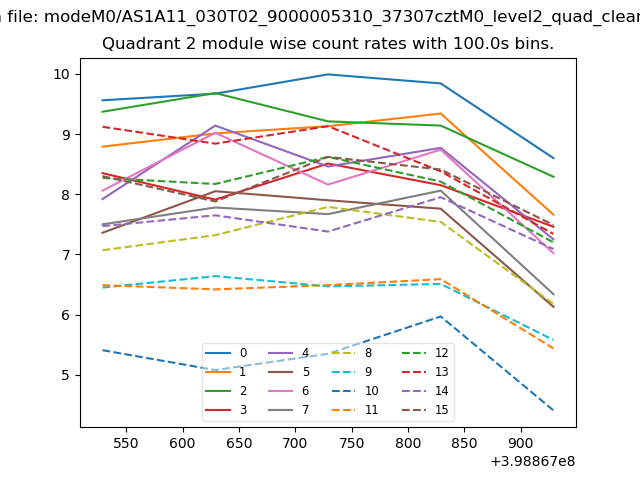
| Module-wise count rates for Quadrant D Data is divided into 100 sec bins |
 |
 |
| Parameter | Plot |
|---|---|
| CZT HV Monitor | 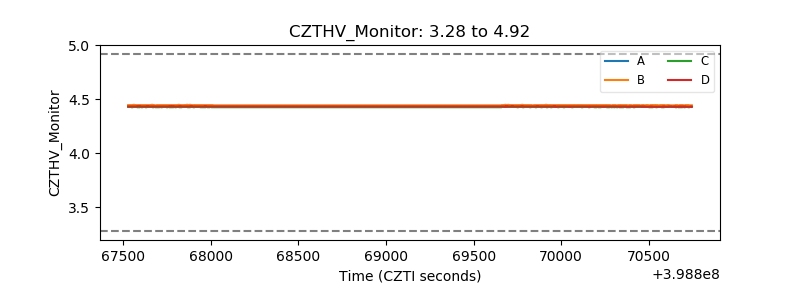 |
| D_VDD | 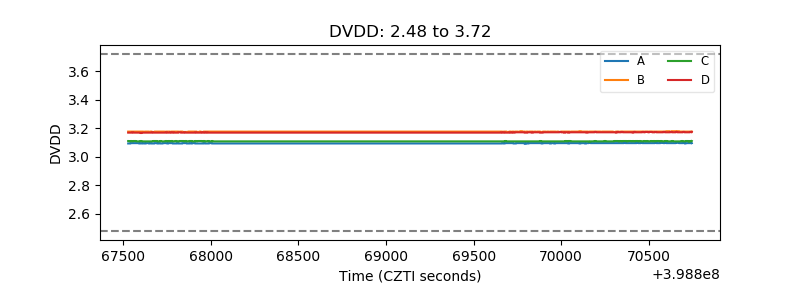 |
| Temperature 1 | 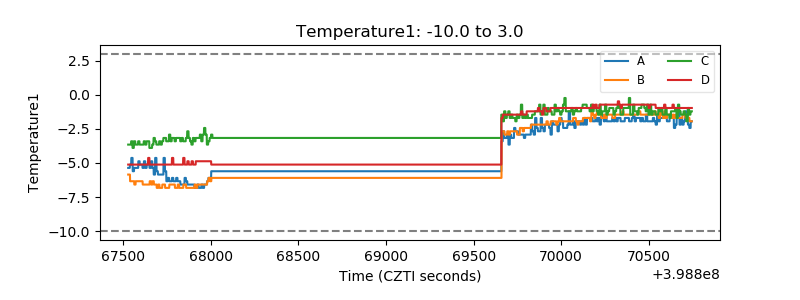 |
| Veto HV Monitor |  |
| Veto LLD | 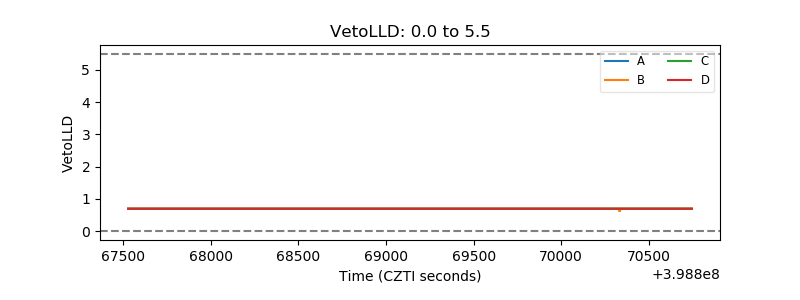 |
| Alpha Counter | 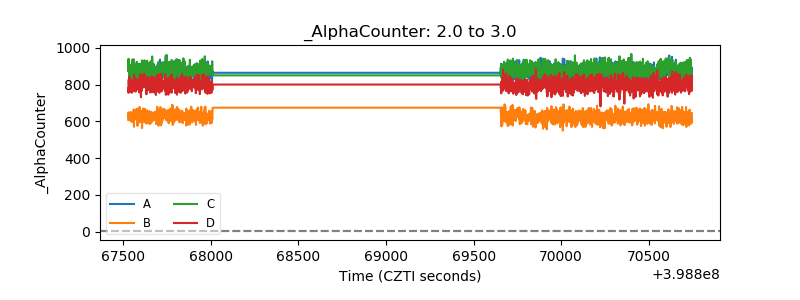 |
| _CPM_Rate | 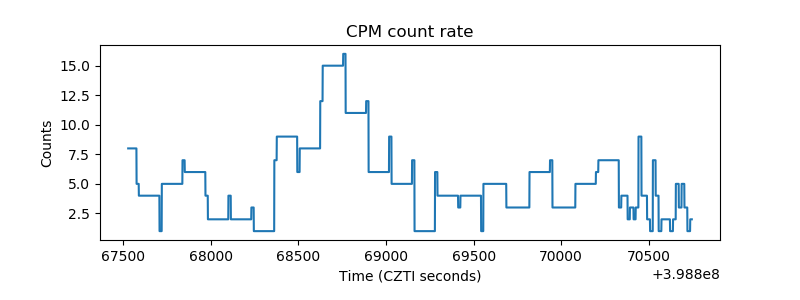 |
| CZT Counter | 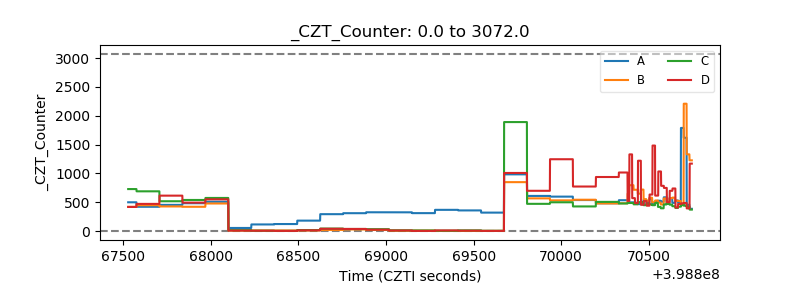 |
| +2.5 Volts monitor | 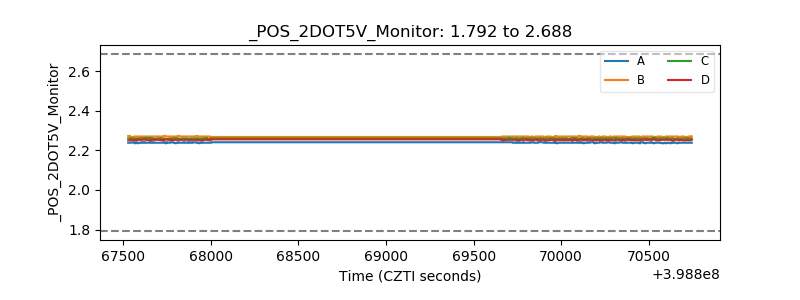 |
| +5 Volts monitor | 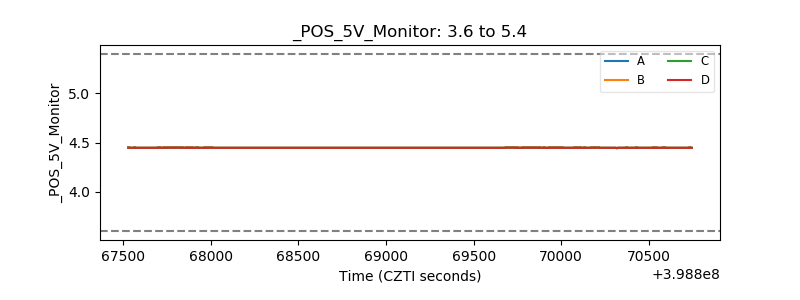 |
| _ROLL_ROT | 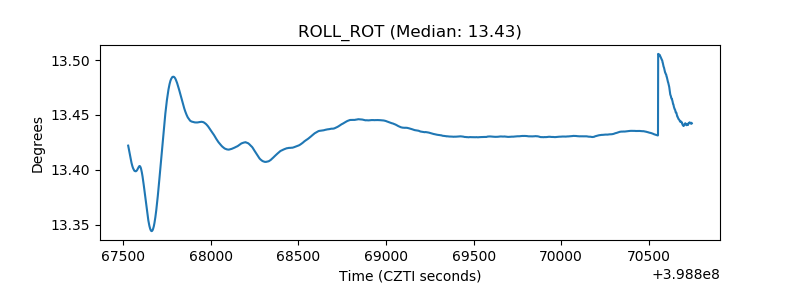 |
| _Roll_DEC | 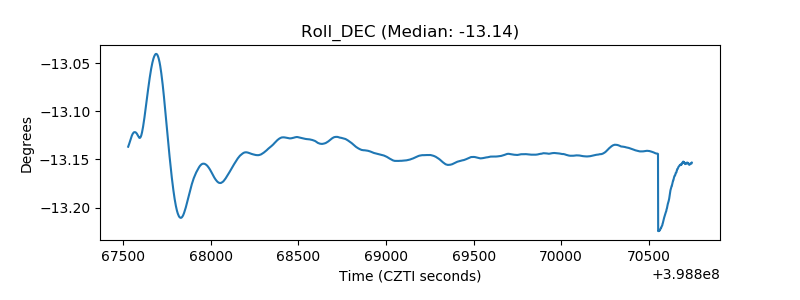 |
| _Roll_RA | 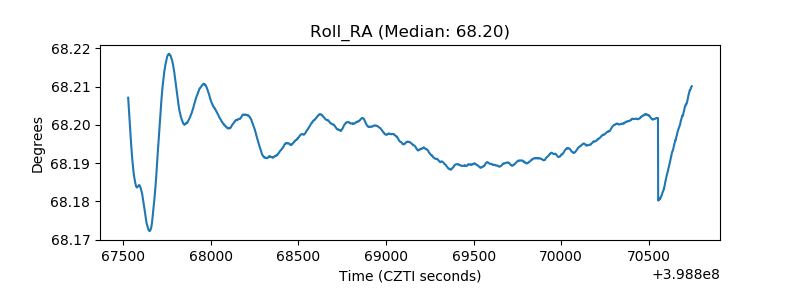 |
| Veto Counter | 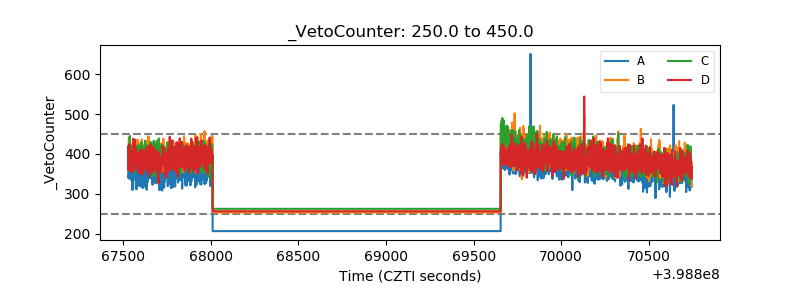 |