| Param | Original file | Final file |
|---|---|---|
| Filename | modeM0/AS1A11_030T02_9000005310_37308cztM0_level2.evt | modeM0/AS1A11_030T02_9000005310_37308cztM0_level2_quad_clean.evt |
| Size (bytes) | 458,671,680 | 57,574,080 |
| Size | 437.4 MB | 54.9 MB |
| Events in quadrant A | 3,046,507 | 341,944 |
| Events in quadrant B | 3,907,025 | 342,110 |
| Events in quadrant C | 2,930,969 | 336,092 |
| Events in quadrant D | 3,613,078 | 317,860 |
| Mode M0 | |||
|---|---|---|---|
| Quadrant | BADHDUFLAG | Total packets | Discarded packets |
| A | 0 | 12593 | 3 |
| B | 0 | 15369 | 2 |
| C | 0 | 12189 | 2 |
| D | 0 | 14713 | 2 |
| Mode SS | |||
|---|---|---|---|
| Quadrant | BADHDUFLAG | Total packets | Discarded packets |
| A | 0 | 118 | 0 |
| B | 0 | 118 | 0 |
| C | 0 | 118 | 0 |
| D | 0 | 118 | 0 |
| Mode M9 | |||
|---|---|---|---|
| Quadrant | BADHDUFLAG | Total packets | Discarded packets |
| A | 0 | 18 | 0 |
| B | 0 | 18 | 0 |
| C | 0 | 18 | 0 |
| D | 0 | 19 | 0 |
| Quadrant | Total seconds | Saturated seconds | Saturation percentage |
|---|---|---|---|
| A | 5791 | 43 | 0.742532% |
| B | 5791 | 407 | 7.028147% |
| C | 5791 | 50 | 0.863409% |
| D | 5791 | 180 | 3.108271% |
Noise dominated data is calculated using 1-second bins in cleaned event files. If a bin has >2000 counts, and if more than 50% of those come from <1% of pixels, then it is considered to be noise-dominated and hence unusable.
| Quadrant | # 1 sec bins | Bins with >0 counts | Bins with >2000 counts | High rate bins dominated by noise | Noise dominated (total time) | Noise dominated (detector-on time) | Marked lightcurve |
|---|---|---|---|---|---|---|---|
| A | 7165 | 5792 | 22 | 22 | 0.31% | 0.38% | 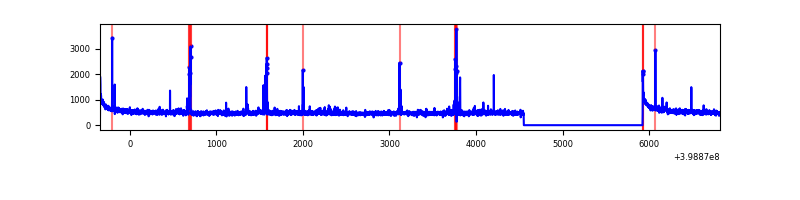 |
| B | 7165 | 5792 | 285 | 285 | 3.98% | 4.92% | 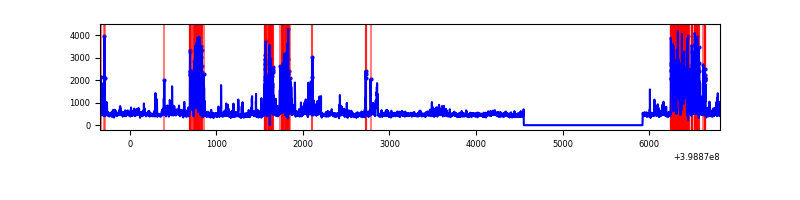 |
| C | 7165 | 5792 | 45 | 45 | 0.63% | 0.78% | 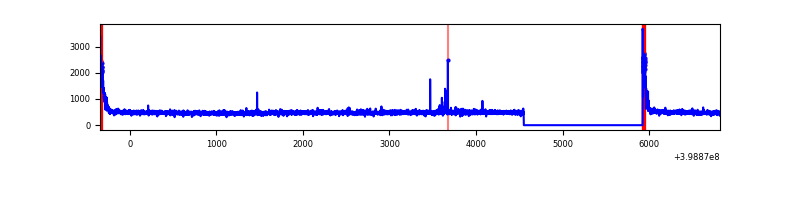 |
| D | 7165 | 5792 | 134 | 134 | 1.87% | 2.31% | 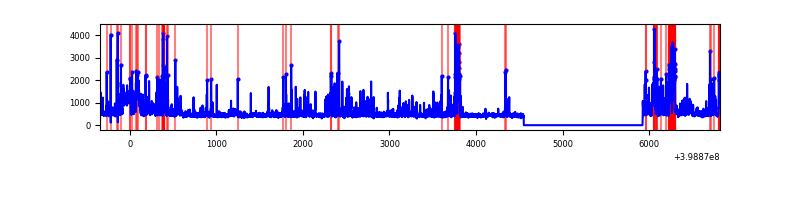 |
Top three noisy pixels from each quadrant. If the there are fewer than three noisy pixels in the level2.evt file, extra rows are filled as -1
| Pixel properties | Quadrant properties | ||||||
|---|---|---|---|---|---|---|---|
| Quadrant | DetID | PixID | Counts | Sigma | Mean | Median | Sigma |
| A | 10 | 83 | 298002 | 2238.15 | 659 | 646 | 132.9 |
| A | 13 | 248 | 81351 | 607.45 | 659 | 646 | 132.9 |
| A | 9 | 143 | 50982 | 378.87 | 659 | 646 | 132.9 |
| B | 5 | 172 | 1010826 | 8367.91 | 630 | 614 | 120.7 |
| B | 0 | 213 | 224907 | 1857.89 | 630 | 614 | 120.7 |
| B | 5 | 255 | 33964 | 276.25 | 630 | 614 | 120.7 |
| C | 15 | 214 | 242134 | 1611.2 | 641 | 646 | 149.9 |
| C | 0 | 10 | 165447 | 1099.55 | 641 | 646 | 149.9 |
| C | 14 | 254 | 17098 | 109.77 | 641 | 646 | 149.9 |
| D | 2 | 249 | 325891 | 2071.7 | 636 | 620 | 157.0 |
| D | 13 | 249 | 262824 | 1670.02 | 636 | 620 | 157.0 |
| D | 12 | 233 | 224405 | 1425.32 | 636 | 620 | 157.0 |
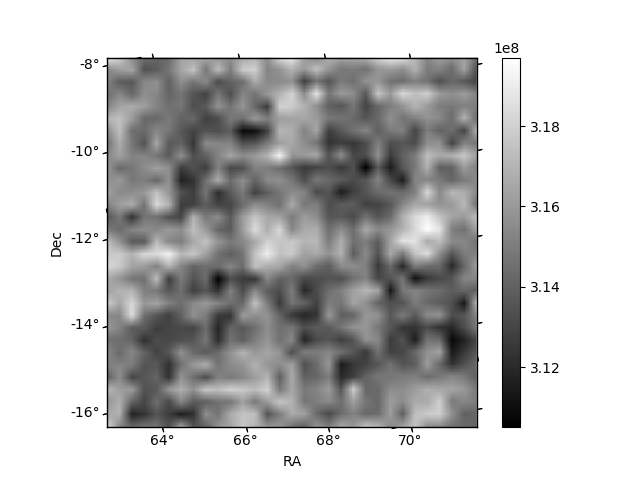
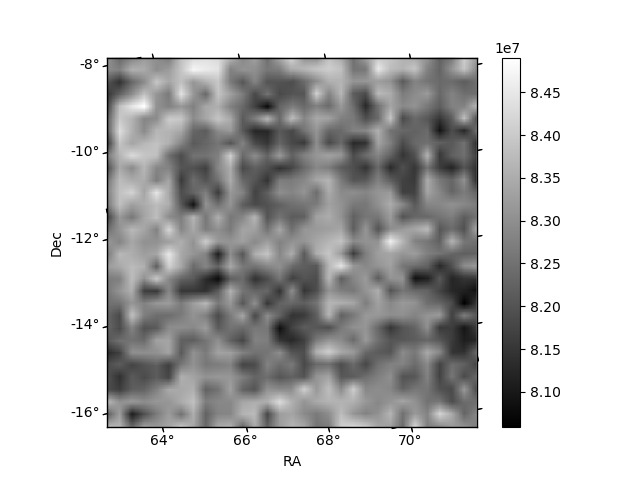
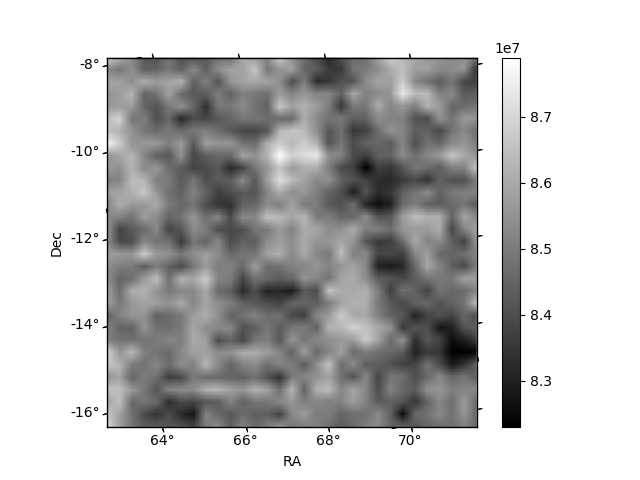
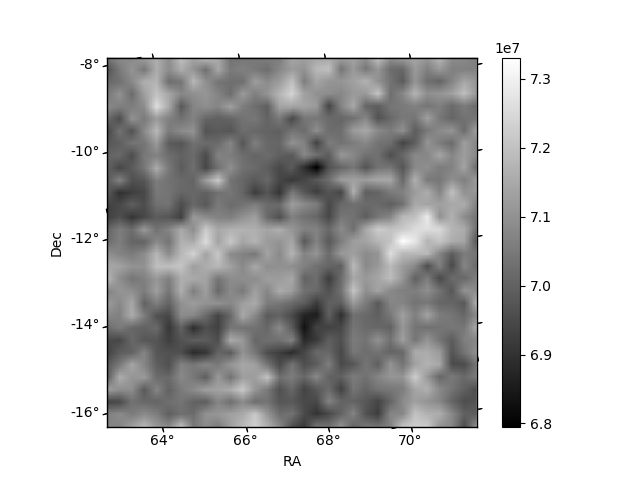
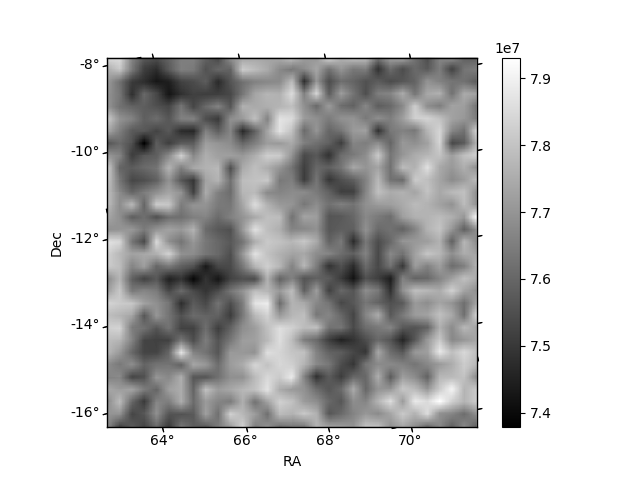
Histogram calculated using DETX and DETY for each event in the final _common_clean file
| Quadrant A | 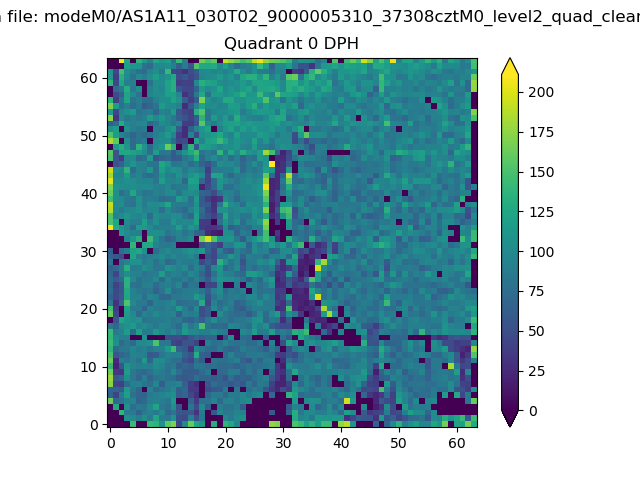 |
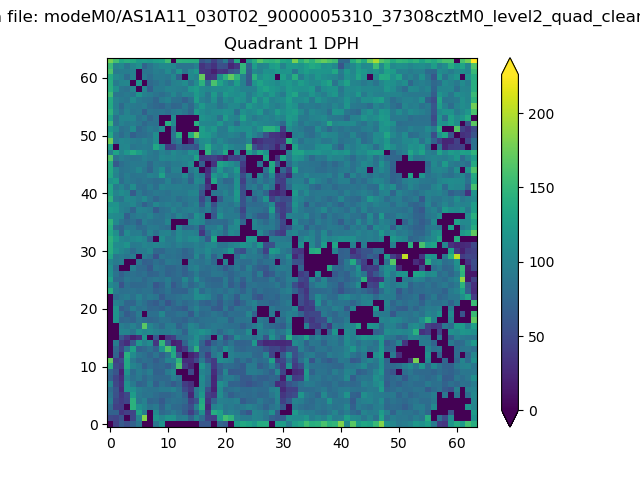 |
Quadrant B |
|---|---|---|---|
| Quadrant D | 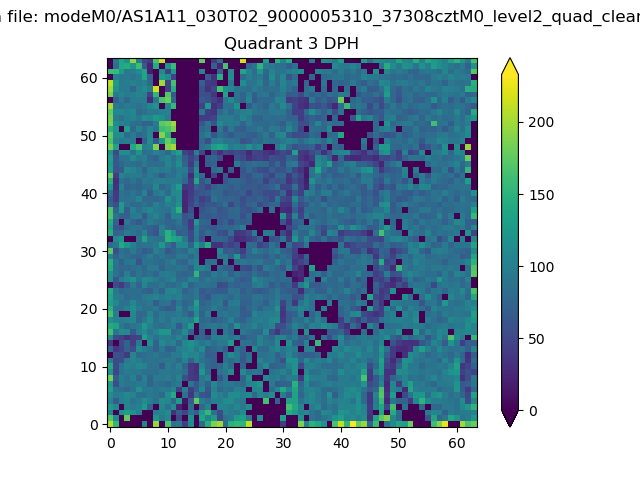 |
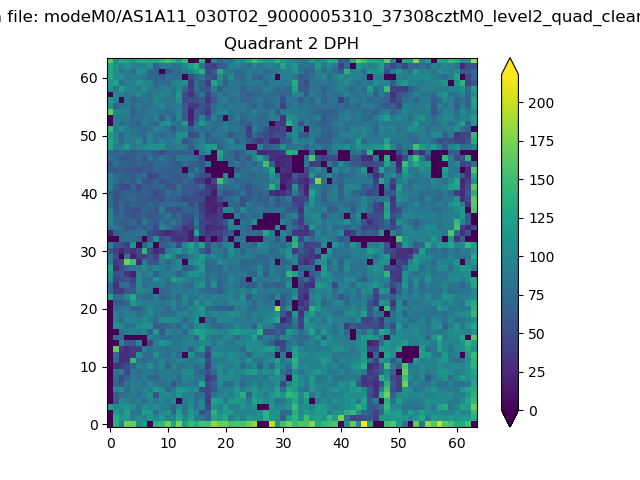 |
Quadrant C |
| Plot type | Count rate plots | Images |
|---|---|---|
| Comparison with Poisson distribution Blue bars denote a histogram of data divided into 1 sec bins. Red curve is a Poisson curve with rate = median count rate of data. |
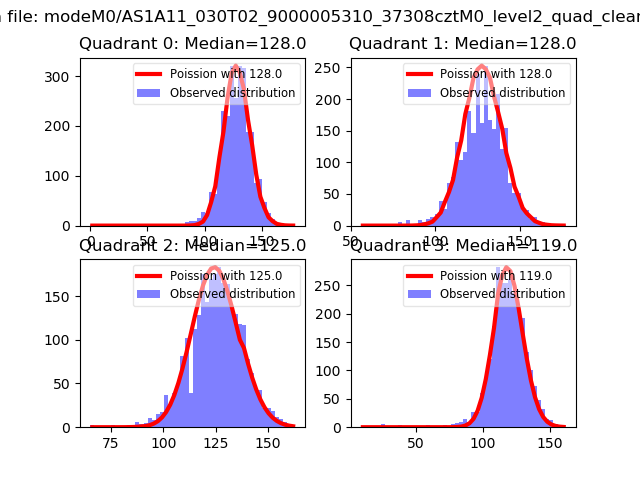 |
 |
| Quadrant-wise count rates Data is divided into 100 sec bins |
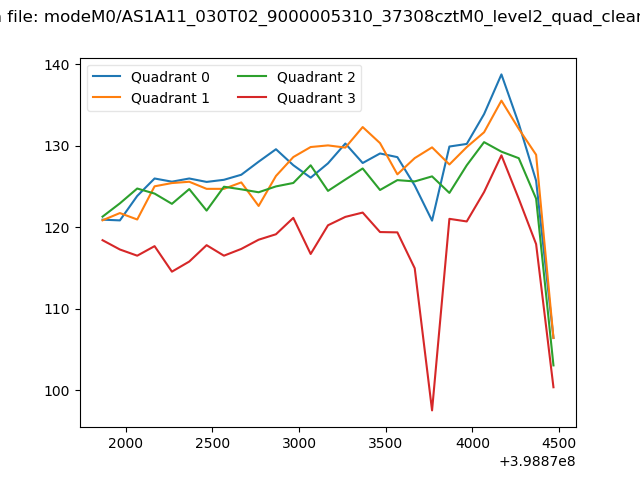 |
|
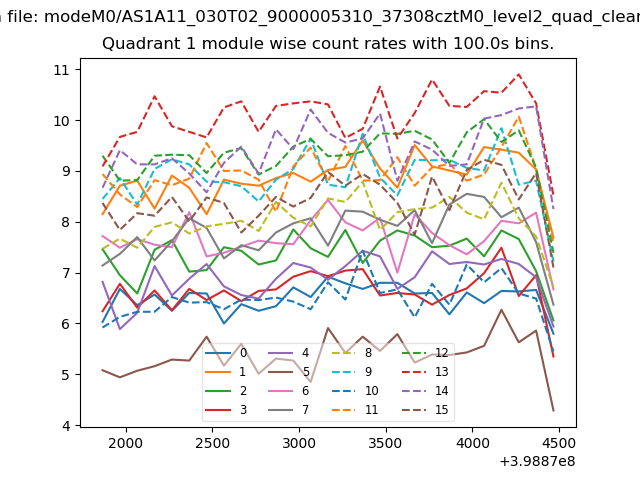
| Module-wise count rates for Quadrant A Data is divided into 100 sec bins |
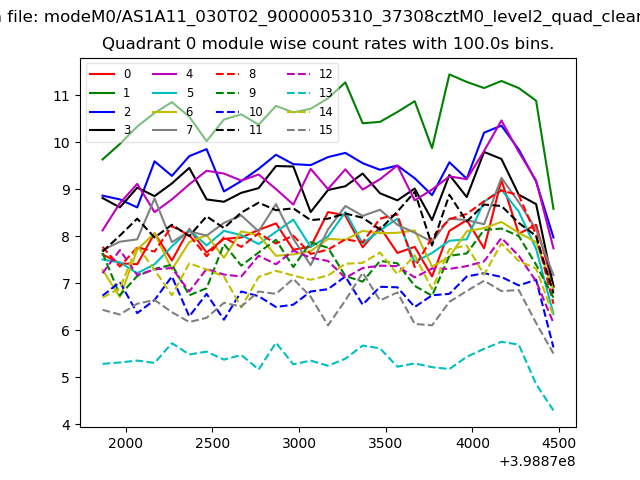 |
 |
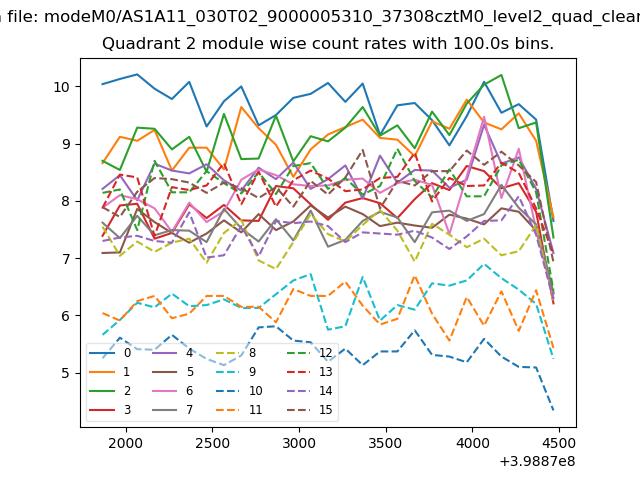
| Module-wise count rates for Quadrant B Data is divided into 100 sec bins |
 |
 |
| Module-wise count rates for Quadrant C Data is divided into 100 sec bins |
 |
 |
| Module-wise count rates for Quadrant D Data is divided into 100 sec bins |
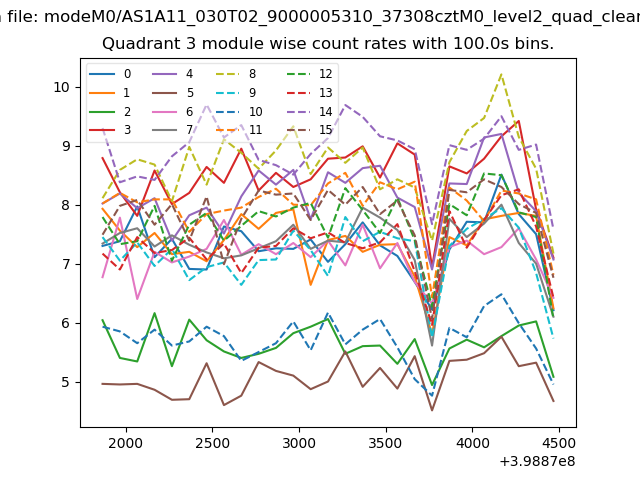 |
 |
| Parameter | Plot |
|---|---|
| CZT HV Monitor | 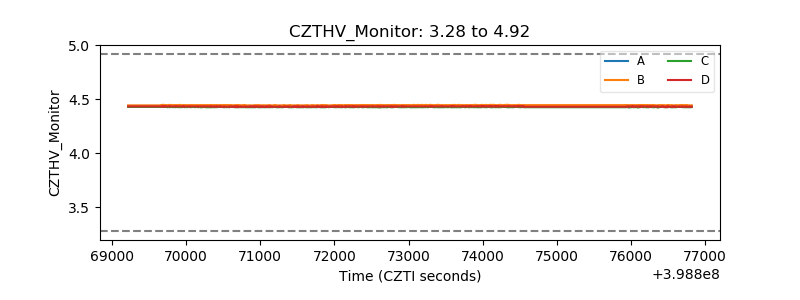 |
| D_VDD | 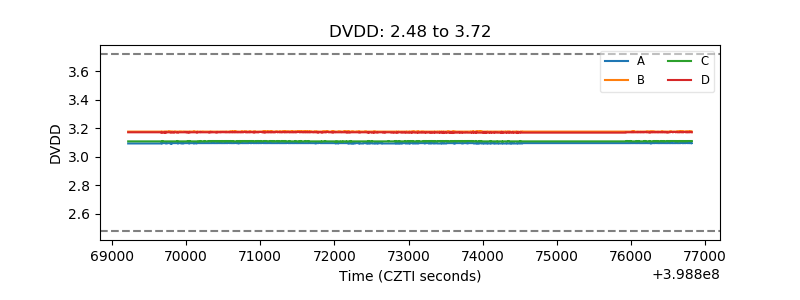 |
| Temperature 1 | 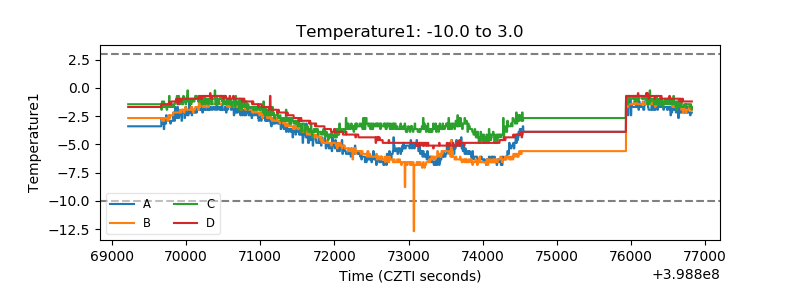 |
| Veto HV Monitor | 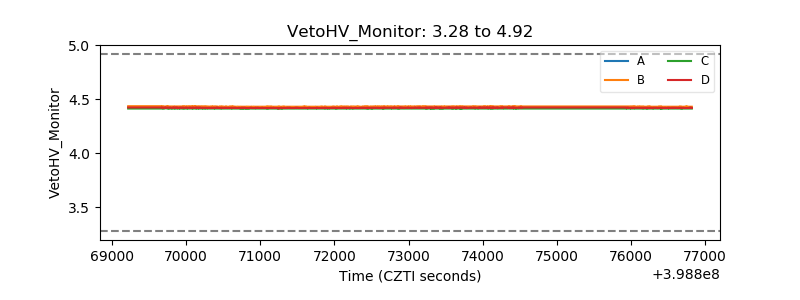 |
| Veto LLD | 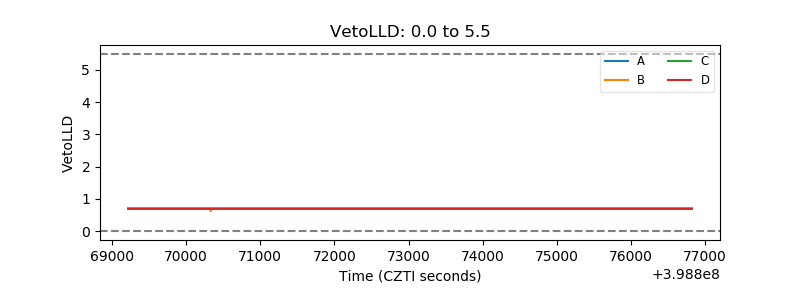 |
| Alpha Counter | 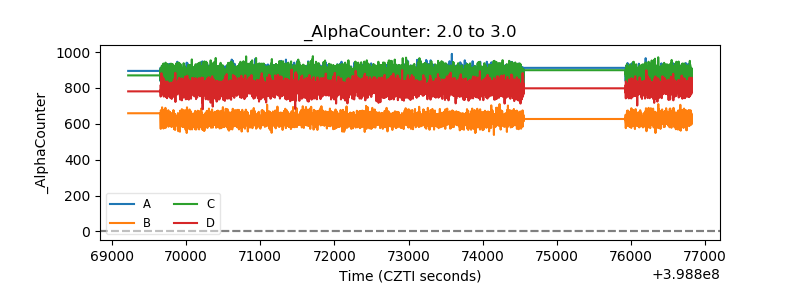 |
| _CPM_Rate | 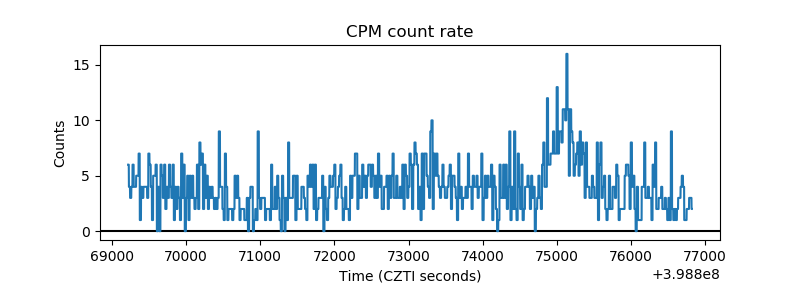 |
| CZT Counter | 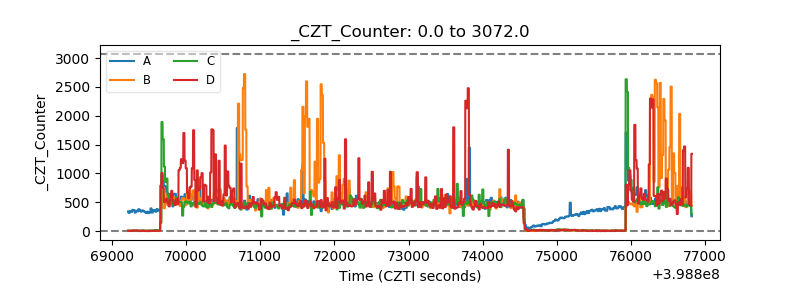 |
| +2.5 Volts monitor | 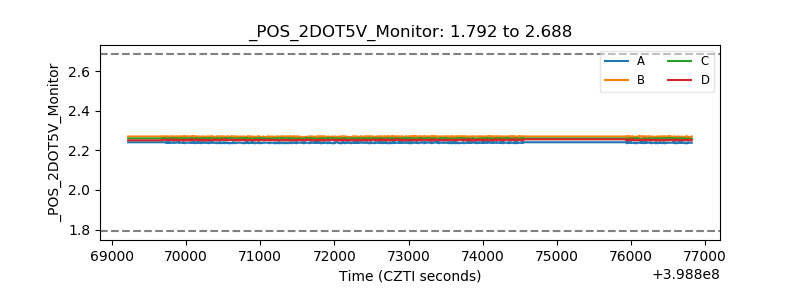 |
| +5 Volts monitor | 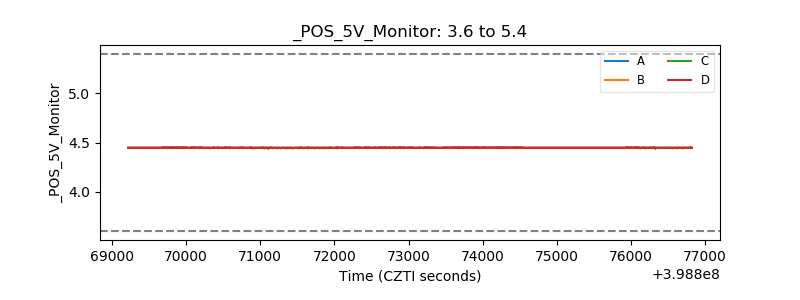 |
| _ROLL_ROT | 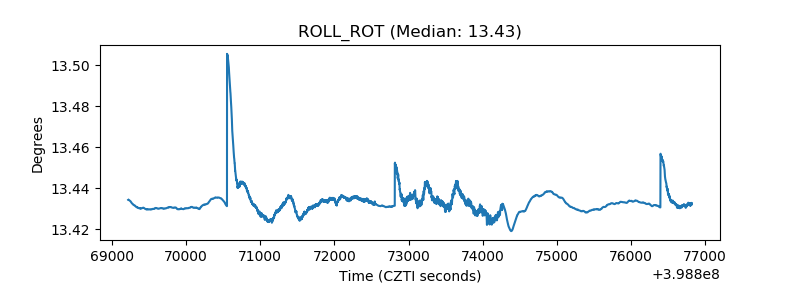 |
| _Roll_DEC | 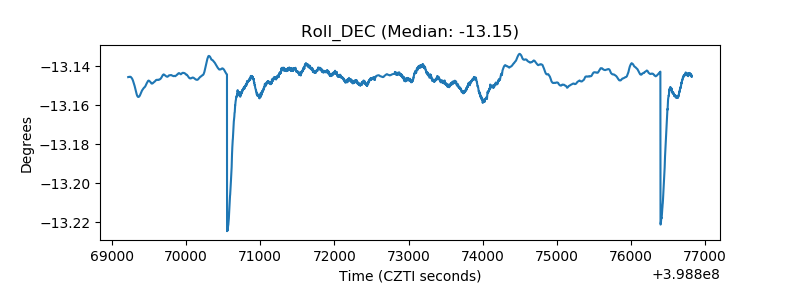 |
| _Roll_RA | 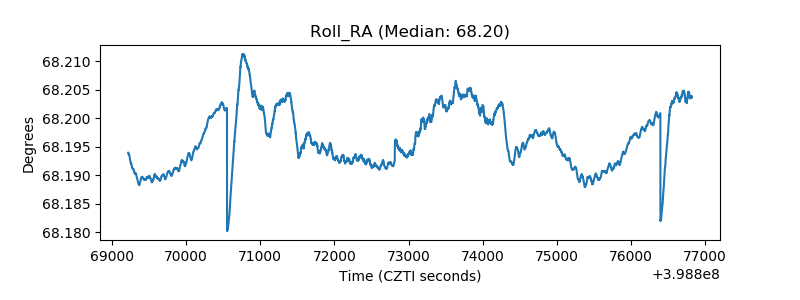 |
| Veto Counter | 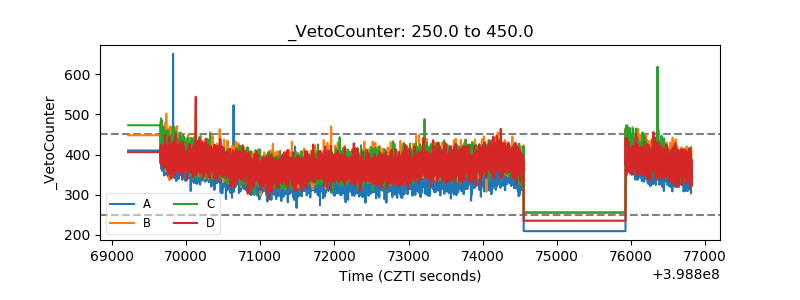 |