| Param | Original file | Final file |
|---|---|---|
| Filename | modeM0/AS1A11_030T02_9000005310_37309cztM0_level2.evt | modeM0/AS1A11_030T02_9000005310_37309cztM0_level2_quad_clean.evt |
| Size (bytes) | 481,063,680 | 65,208,960 |
| Size | 458.8 MB | 62.2 MB |
| Events in quadrant A | 3,159,125 | 395,830 |
| Events in quadrant B | 4,024,345 | 399,397 |
| Events in quadrant C | 3,014,505 | 392,521 |
| Events in quadrant D | 3,964,232 | 368,019 |
| Mode M0 | |||
|---|---|---|---|
| Quadrant | BADHDUFLAG | Total packets | Discarded packets |
| A | 0 | 13059 | 3 |
| B | 0 | 15971 | 2 |
| C | 0 | 12579 | 2 |
| D | 0 | 15885 | 2 |
| Mode SS | |||
|---|---|---|---|
| Quadrant | BADHDUFLAG | Total packets | Discarded packets |
| A | 0 | 122 | 0 |
| B | 0 | 122 | 0 |
| C | 0 | 122 | 0 |
| D | 0 | 122 | 0 |
| Mode M9 | |||
|---|---|---|---|
| Quadrant | BADHDUFLAG | Total packets | Discarded packets |
| A | 0 | 19 | 0 |
| B | 0 | 19 | 0 |
| C | 0 | 19 | 0 |
| D | 0 | 20 | 0 |
| Quadrant | Total seconds | Saturated seconds | Saturation percentage |
|---|---|---|---|
| A | 5992 | 33 | 0.550734% |
| B | 5992 | 363 | 6.058077% |
| C | 5992 | 63 | 1.051402% |
| D | 5992 | 236 | 3.938585% |
Noise dominated data is calculated using 1-second bins in cleaned event files. If a bin has >2000 counts, and if more than 50% of those come from <1% of pixels, then it is considered to be noise-dominated and hence unusable.
| Quadrant | # 1 sec bins | Bins with >0 counts | Bins with >2000 counts | High rate bins dominated by noise | Noise dominated (total time) | Noise dominated (detector-on time) | Marked lightcurve |
|---|---|---|---|---|---|---|---|
| A | 7303 | 5993 | 21 | 21 | 0.29% | 0.35% | 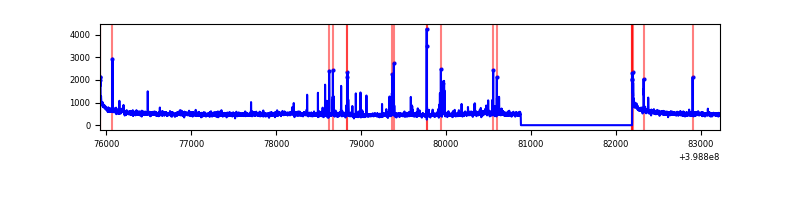 |
| B | 7303 | 5993 | 236 | 236 | 3.23% | 3.94% | 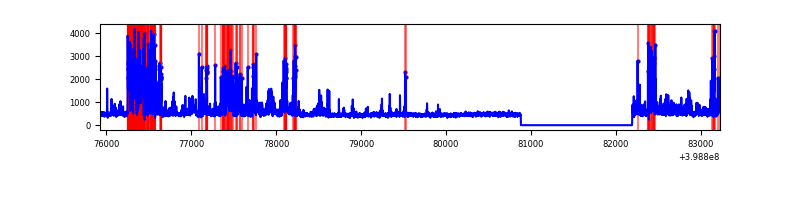 |
| C | 7303 | 5993 | 51 | 51 | 0.70% | 0.85% | 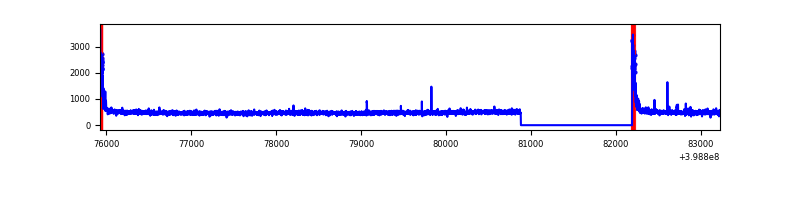 |
| D | 7303 | 5993 | 201 | 201 | 2.75% | 3.35% | 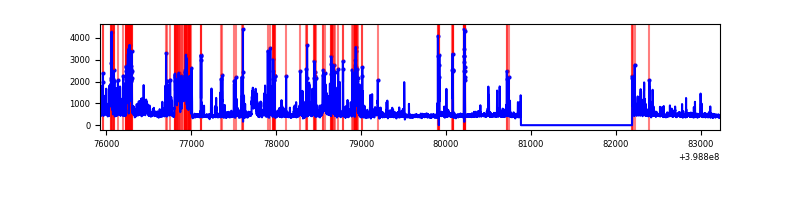 |
Top three noisy pixels from each quadrant. If the there are fewer than three noisy pixels in the level2.evt file, extra rows are filled as -1
| Pixel properties | Quadrant properties | ||||||
|---|---|---|---|---|---|---|---|
| Quadrant | DetID | PixID | Counts | Sigma | Mean | Median | Sigma |
| A | 10 | 83 | 314763 | 2283.31 | 678 | 664 | 137.6 |
| A | 13 | 248 | 121678 | 879.7 | 678 | 664 | 137.6 |
| A | 9 | 143 | 43570 | 311.9 | 678 | 664 | 137.6 |
| B | 5 | 172 | 852593 | 6680.28 | 656 | 637 | 127.5 |
| B | 0 | 213 | 313695 | 2454.72 | 656 | 637 | 127.5 |
| B | 12 | 18 | 76270 | 593.05 | 656 | 637 | 127.5 |
| C | 15 | 214 | 249394 | 1616.44 | 659 | 663 | 153.9 |
| C | 0 | 10 | 168956 | 1093.69 | 659 | 663 | 153.9 |
| C | 1 | 23 | 17797 | 111.35 | 659 | 663 | 153.9 |
| D | 12 | 233 | 396314 | 2474.75 | 653 | 636 | 159.9 |
| D | 2 | 249 | 364225 | 2274.05 | 653 | 636 | 159.9 |
| D | 1 | 52 | 201576 | 1256.77 | 653 | 636 | 159.9 |
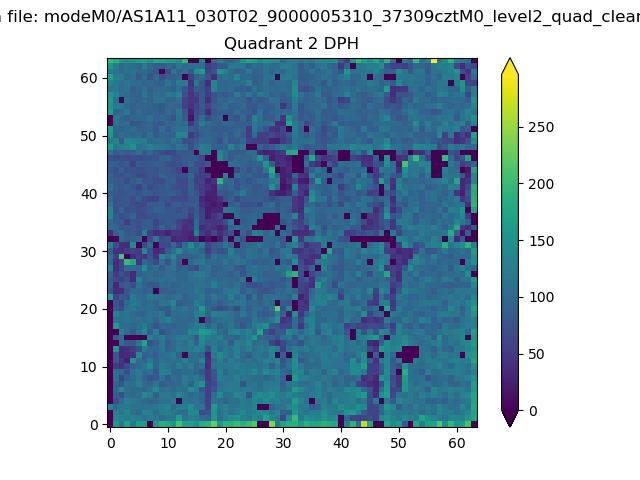
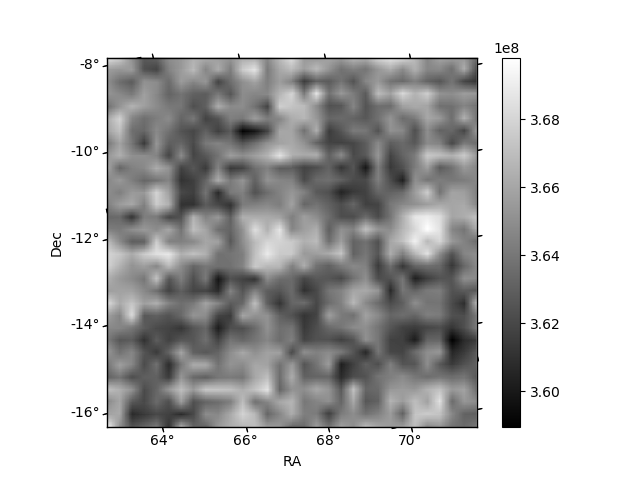
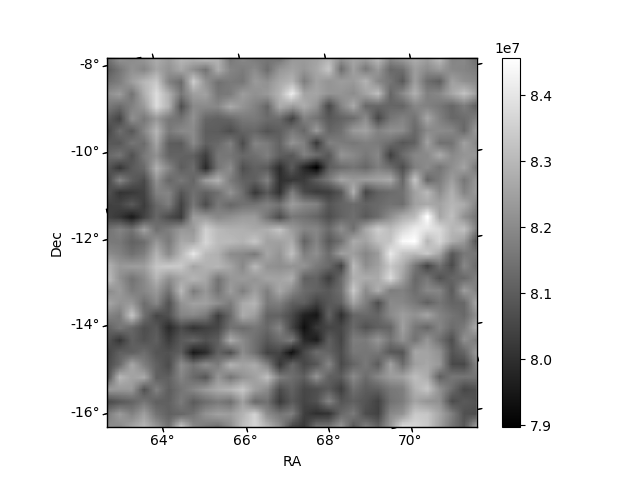
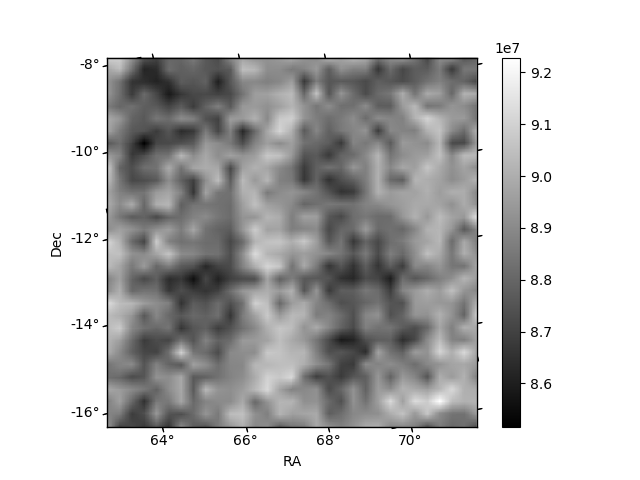
Histogram calculated using DETX and DETY for each event in the final _common_clean file
| Quadrant A | 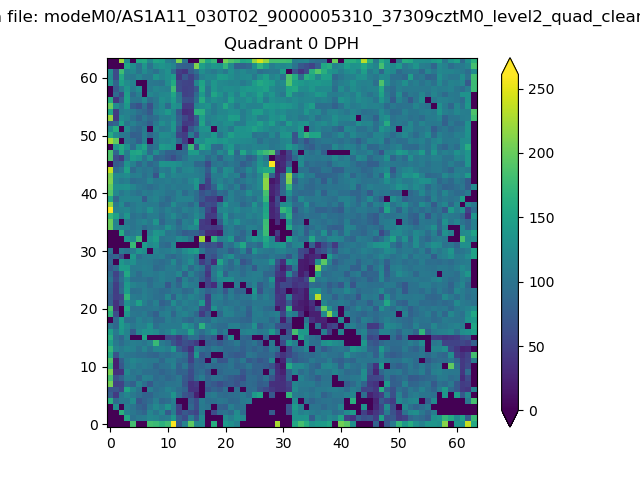 |
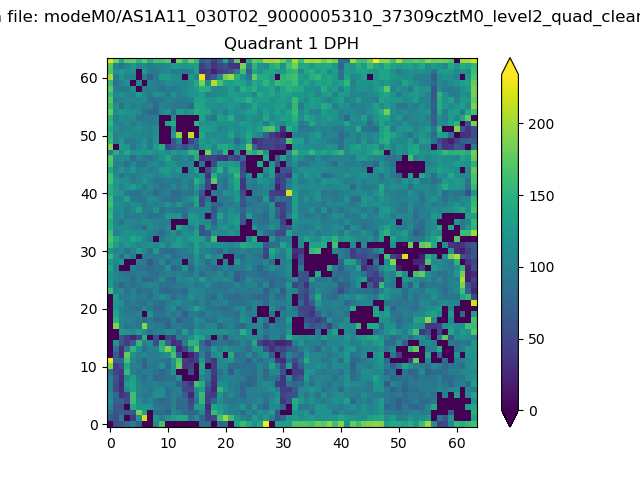 |
Quadrant B |
|---|---|---|---|
| Quadrant D | 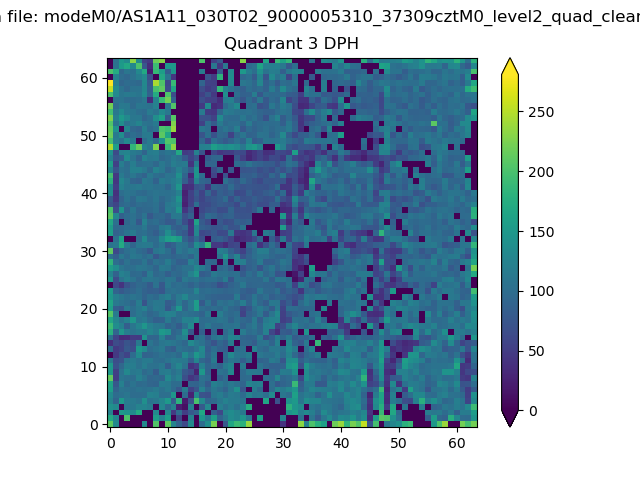 |
 |
Quadrant C |
| Plot type | Count rate plots | Images |
|---|---|---|
| Comparison with Poisson distribution Blue bars denote a histogram of data divided into 1 sec bins. Red curve is a Poisson curve with rate = median count rate of data. |
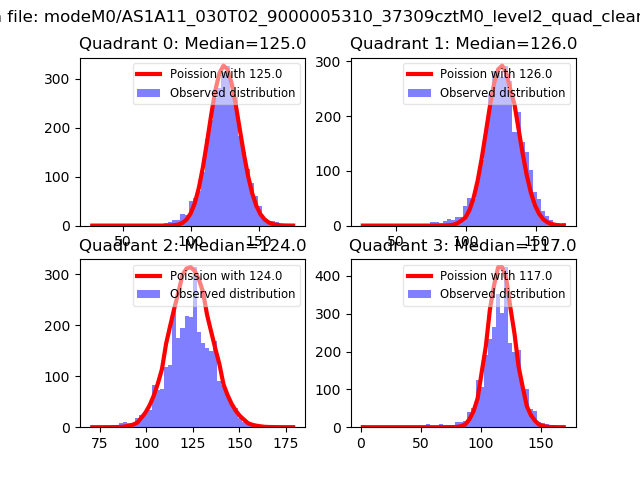 |
 |
| Quadrant-wise count rates Data is divided into 100 sec bins |
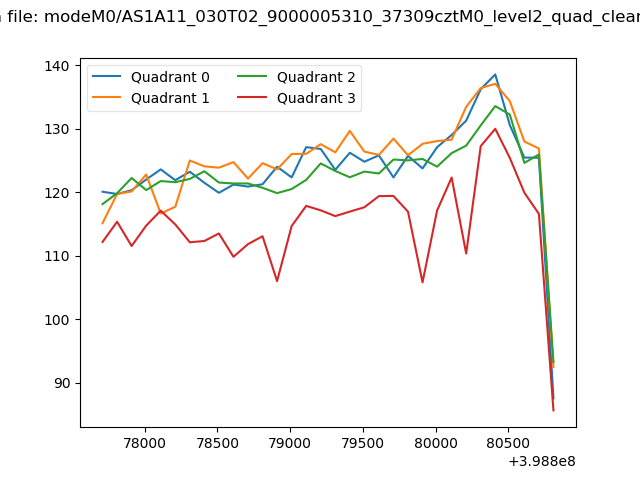 |
|
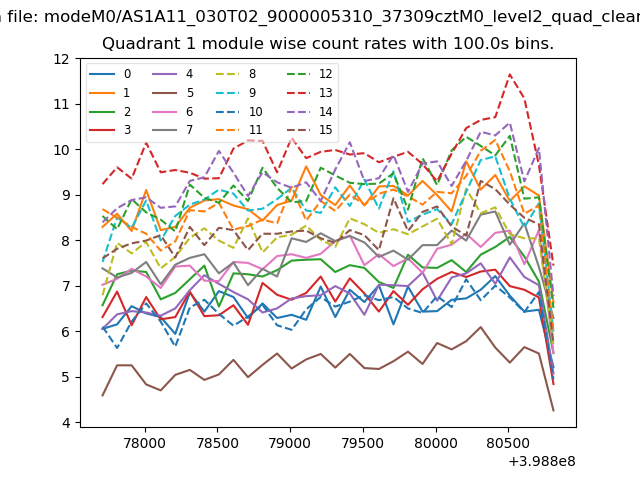
| Module-wise count rates for Quadrant A Data is divided into 100 sec bins |
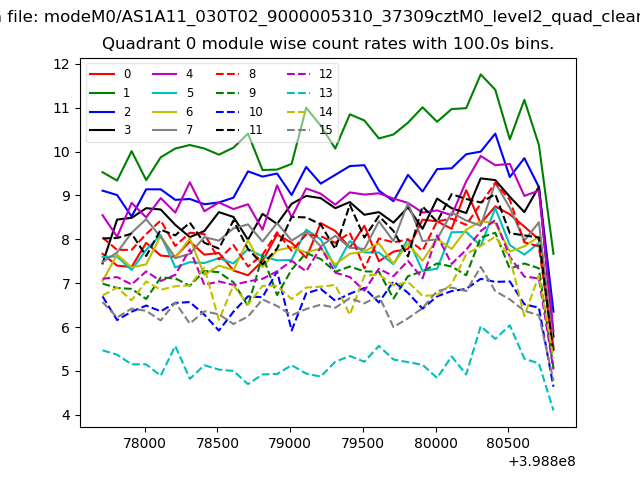 |
 |
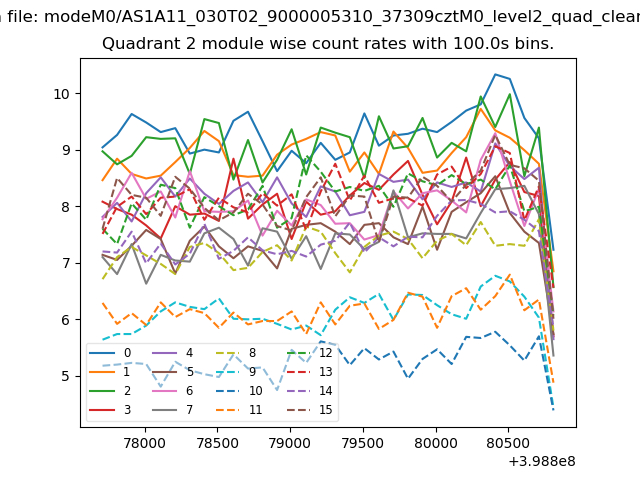
| Module-wise count rates for Quadrant B Data is divided into 100 sec bins |
 |
 |
| Module-wise count rates for Quadrant C Data is divided into 100 sec bins |
 |
 |
| Module-wise count rates for Quadrant D Data is divided into 100 sec bins |
 |
 |
| Parameter | Plot |
|---|---|
| CZT HV Monitor | 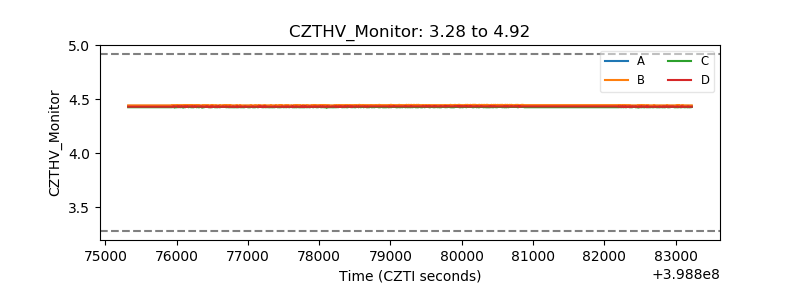 |
| D_VDD | 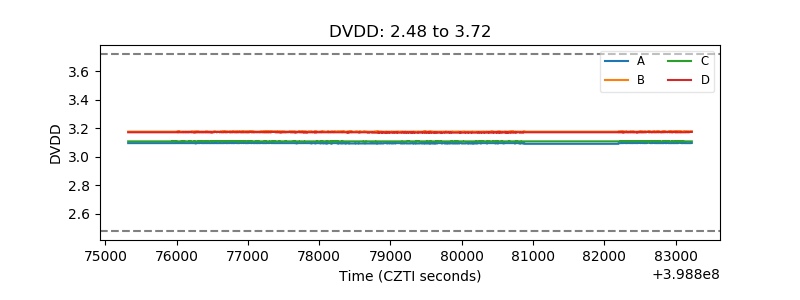 |
| Temperature 1 | 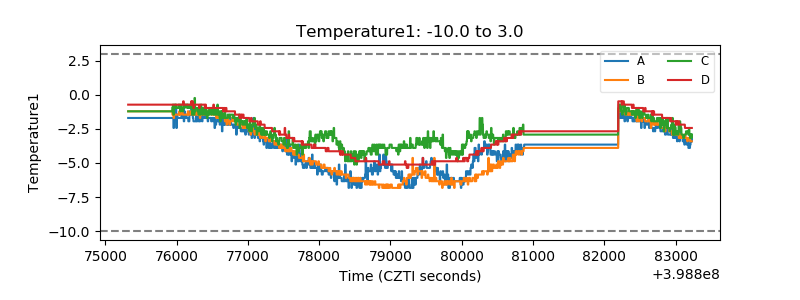 |
| Veto HV Monitor | 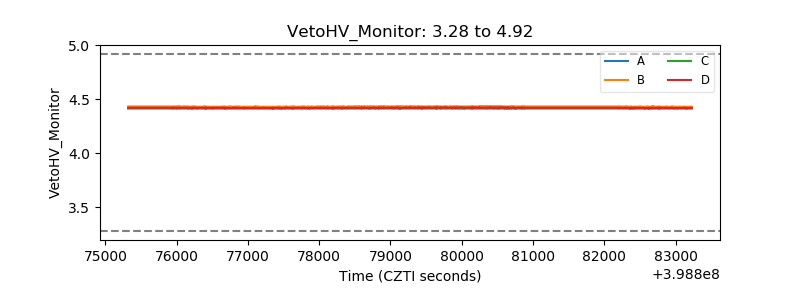 |
| Veto LLD | 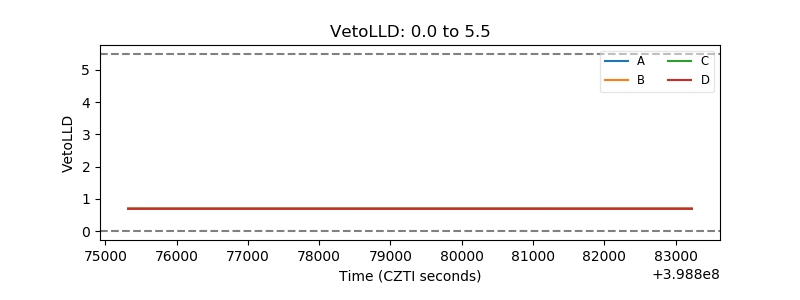 |
| Alpha Counter | 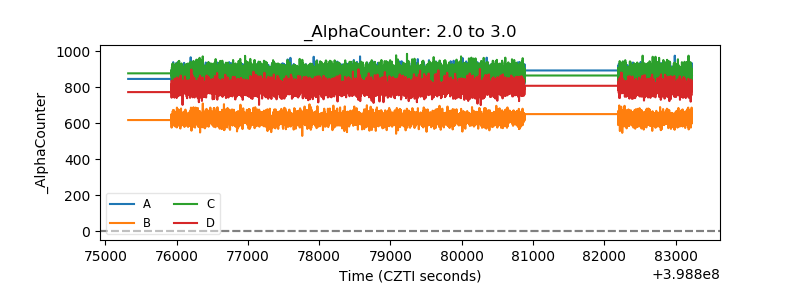 |
| _CPM_Rate | 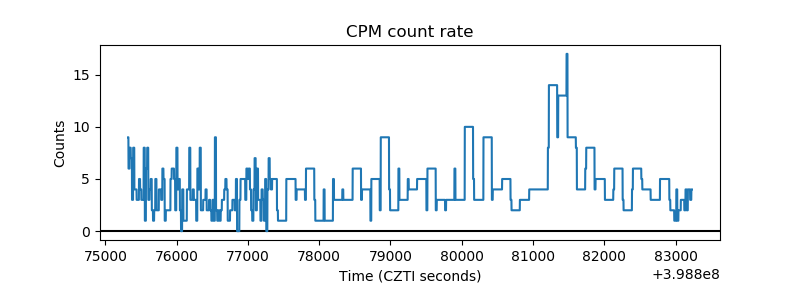 |
| CZT Counter | 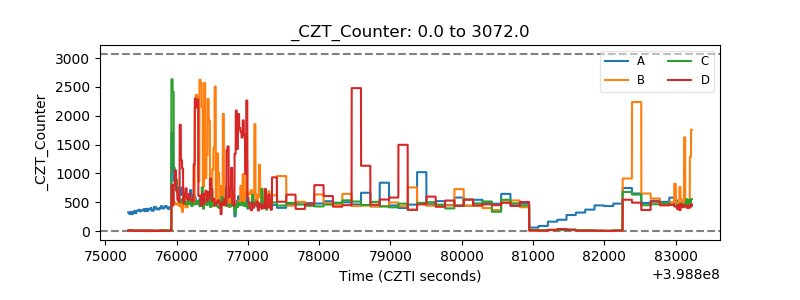 |
| +2.5 Volts monitor | 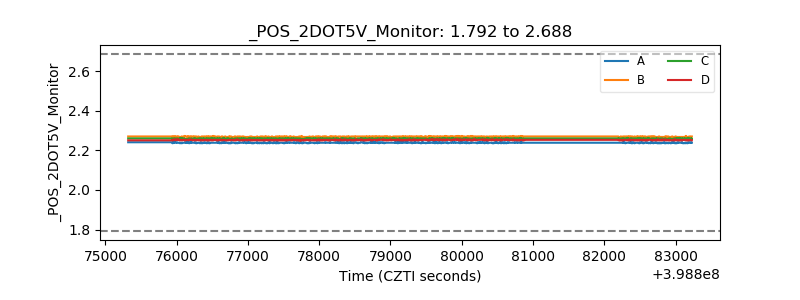 |
| +5 Volts monitor | 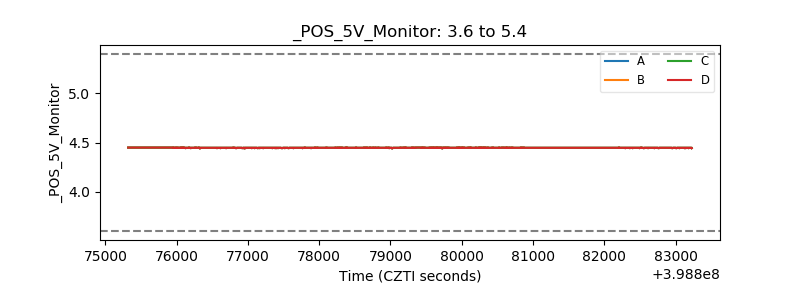 |
| _ROLL_ROT |  |
| _Roll_DEC | 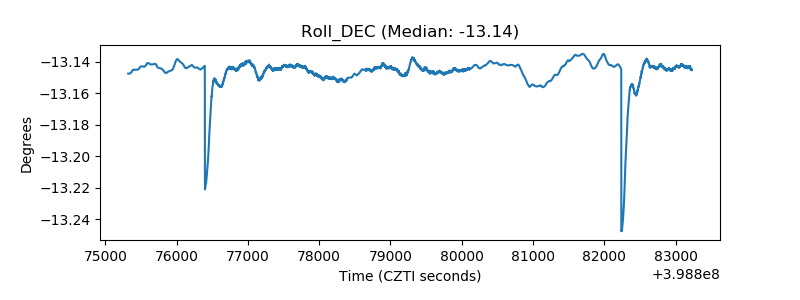 |
| _Roll_RA | 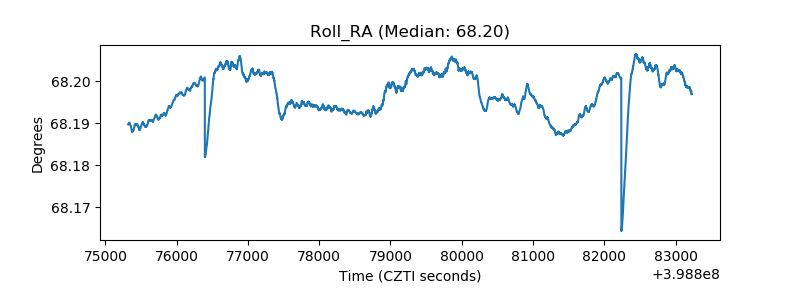 |
| Veto Counter | 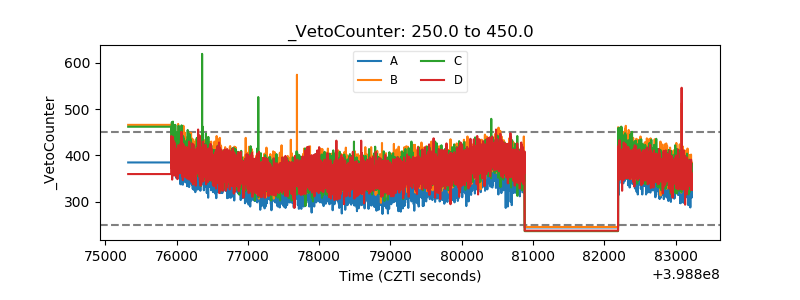 |