| Param | Original file | Final file |
|---|---|---|
| Filename | modeM0/AS1A11_030T02_9000005310_37312cztM0_level2.evt | modeM0/AS1A11_030T02_9000005310_37312cztM0_level2_quad_clean.evt |
| Size (bytes) | 1,267,266,240 | 217,978,560 |
| Size | 1.2 GB | 207.9 MB |
| Events in quadrant A | 9,991,646 | 1,383,903 |
| Events in quadrant B | 9,705,146 | 1,404,822 |
| Events in quadrant C | 8,149,952 | 1,410,115 |
| Events in quadrant D | 9,481,823 | 1,328,981 |
| Mode M0 | |||
|---|---|---|---|
| Quadrant | BADHDUFLAG | Total packets | Discarded packets |
| A | 0 | 39612 | 5 |
| B | 0 | 39394 | 4 |
| C | 0 | 33652 | 4 |
| D | 0 | 38971 | 4 |
| Mode SS | |||
|---|---|---|---|
| Quadrant | BADHDUFLAG | Total packets | Discarded packets |
| A | 0 | 320 | 0 |
| B | 0 | 320 | 0 |
| C | 0 | 320 | 0 |
| D | 0 | 320 | 0 |
| Mode M9 | |||
|---|---|---|---|
| Quadrant | BADHDUFLAG | Total packets | Discarded packets |
| A | 0 | 50 | 0 |
| B | 0 | 50 | 0 |
| C | 0 | 50 | 0 |
| D | 0 | 51 | 0 |
| Quadrant | Total seconds | Saturated seconds | Saturation percentage |
|---|---|---|---|
| A | 15558 | 664 | 4.267901% |
| B | 15558 | 747 | 4.801388% |
| C | 15558 | 186 | 1.195526% |
| D | 15558 | 447 | 2.873120% |
Noise dominated data is calculated using 1-second bins in cleaned event files. If a bin has >2000 counts, and if more than 50% of those come from <1% of pixels, then it is considered to be noise-dominated and hence unusable.
| Quadrant | # 1 sec bins | Bins with >0 counts | Bins with >2000 counts | High rate bins dominated by noise | Noise dominated (total time) | Noise dominated (detector-on time) | Marked lightcurve |
|---|---|---|---|---|---|---|---|
| A | 19825 | 15561 | 557 | 557 | 2.81% | 3.58% | 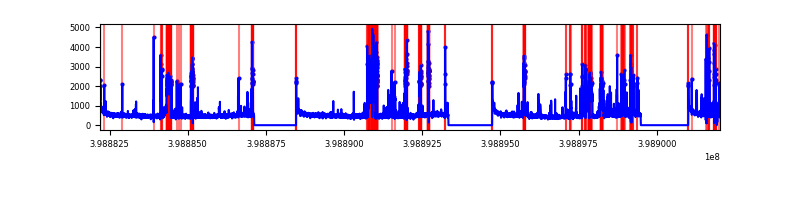 |
| B | 19825 | 15561 | 419 | 419 | 2.11% | 2.69% | 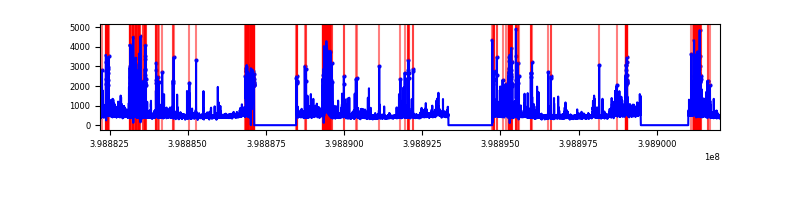 |
| C | 19825 | 15561 | 132 | 132 | 0.67% | 0.85% | 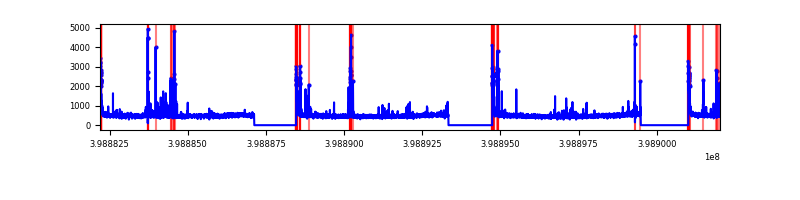 |
| D | 19825 | 15561 | 350 | 350 | 1.77% | 2.25% | 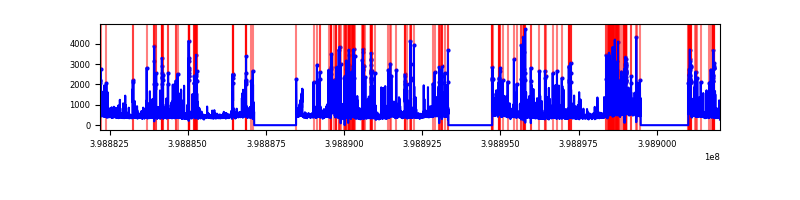 |
Top three noisy pixels from each quadrant. If the there are fewer than three noisy pixels in the level2.evt file, extra rows are filled as -1
| Pixel properties | Quadrant properties | ||||||
|---|---|---|---|---|---|---|---|
| Quadrant | DetID | PixID | Counts | Sigma | Mean | Median | Sigma |
| A | 15 | 237 | 2226825 | 6413.08 | 1726 | 1690 | 347.0 |
| A | 10 | 83 | 703043 | 2021.37 | 1726 | 1690 | 347.0 |
| A | 13 | 248 | 200314 | 572.45 | 1726 | 1690 | 347.0 |
| B | 5 | 172 | 1374974 | 4204.23 | 1714 | 1669 | 326.6 |
| B | 0 | 213 | 740195 | 2260.92 | 1714 | 1669 | 326.6 |
| B | 12 | 18 | 458991 | 1400.04 | 1714 | 1669 | 326.6 |
| C | 15 | 214 | 646411 | 1613.63 | 1715 | 1729 | 399.5 |
| C | 1 | 23 | 346351 | 862.58 | 1715 | 1729 | 399.5 |
| C | 0 | 10 | 312355 | 777.49 | 1715 | 1729 | 399.5 |
| D | 2 | 249 | 1228561 | 2935.08 | 1702 | 1653 | 418.0 |
| D | 13 | 249 | 736475 | 1757.89 | 1702 | 1653 | 418.0 |
| D | 13 | 171 | 235630 | 559.73 | 1702 | 1653 | 418.0 |
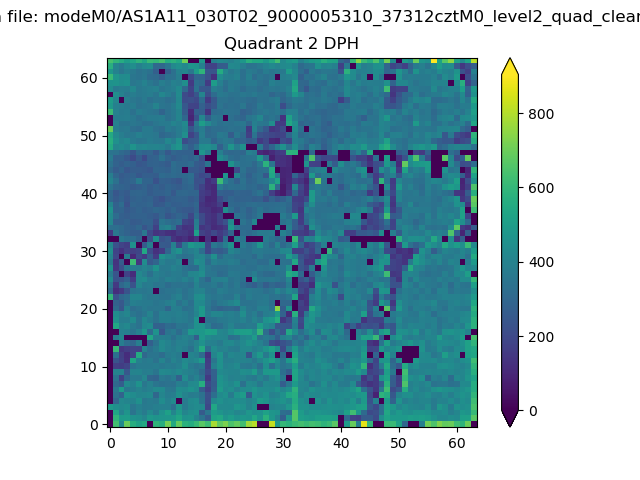
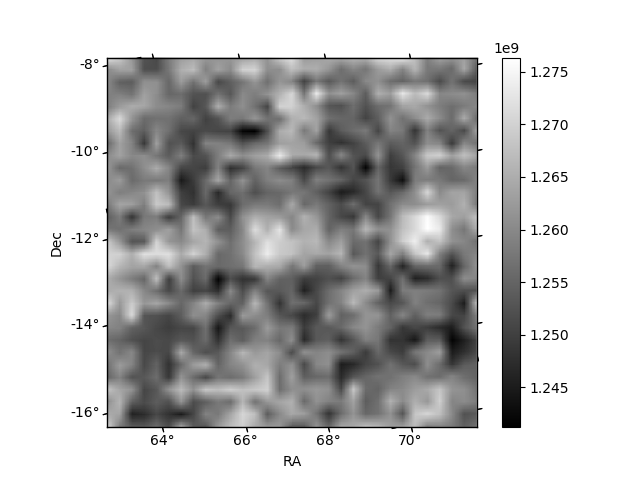
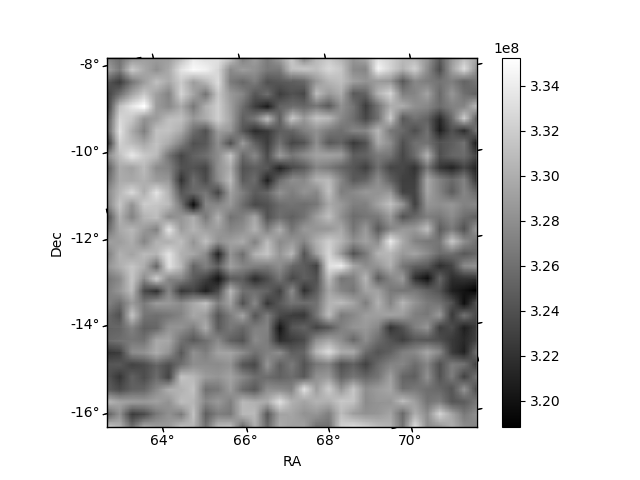
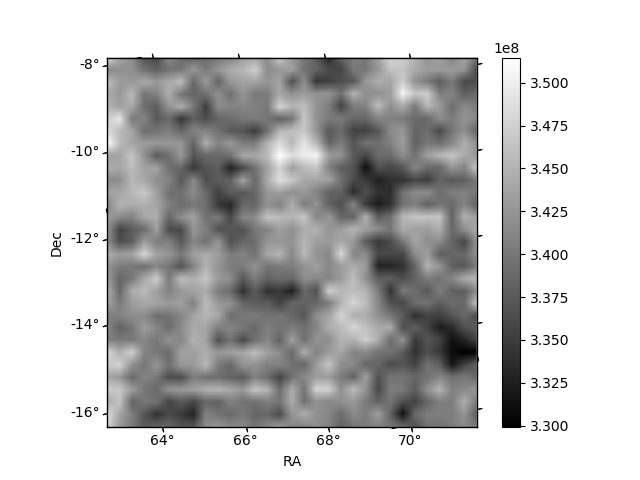
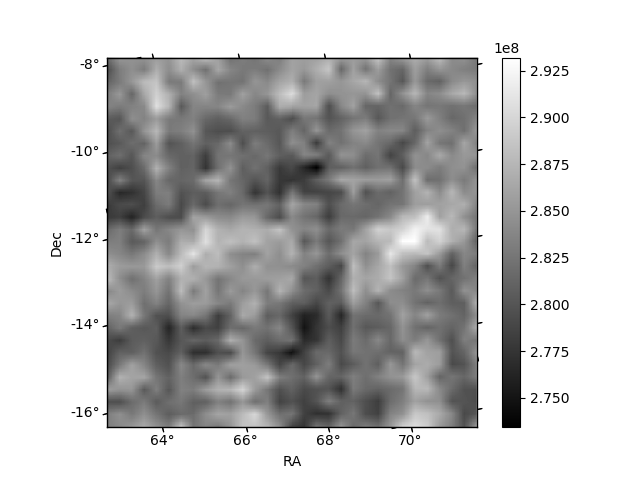
Histogram calculated using DETX and DETY for each event in the final _common_clean file
| Quadrant A | 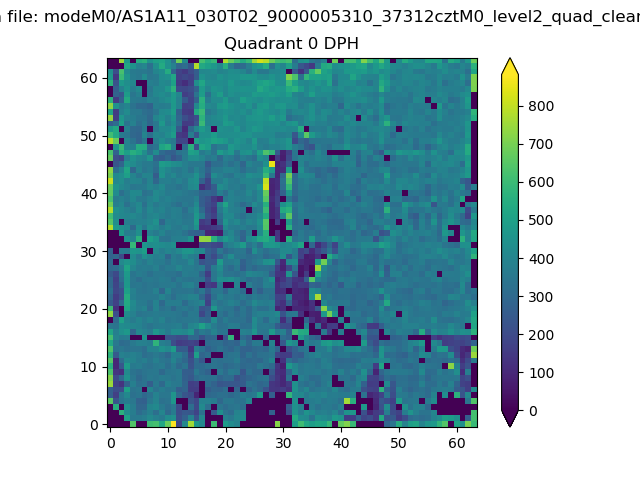 |
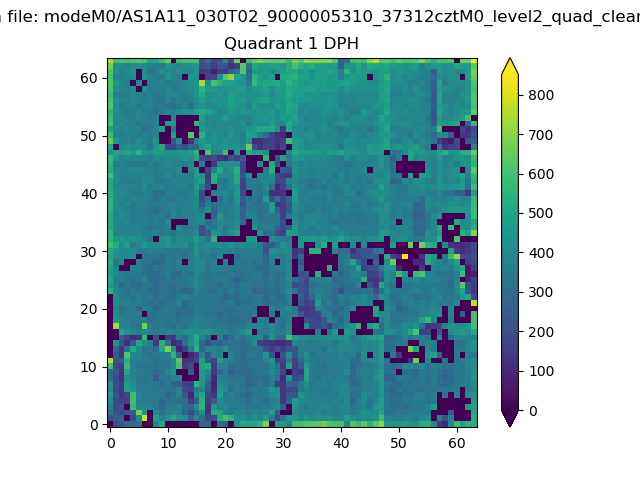 |
Quadrant B |
|---|---|---|---|
| Quadrant D | 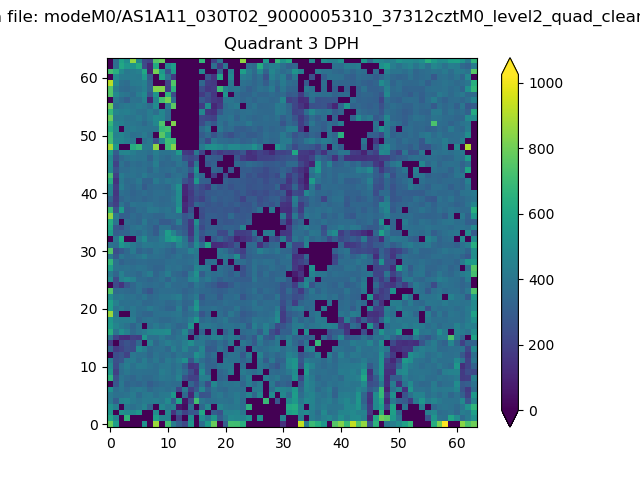 |
 |
Quadrant C |
| Plot type | Count rate plots | Images |
|---|---|---|
| Comparison with Poisson distribution Blue bars denote a histogram of data divided into 1 sec bins. Red curve is a Poisson curve with rate = median count rate of data. |
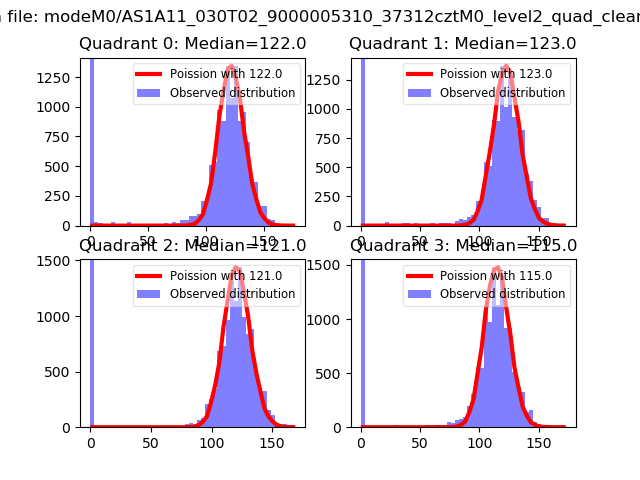 |
 |
| Quadrant-wise count rates Data is divided into 100 sec bins |
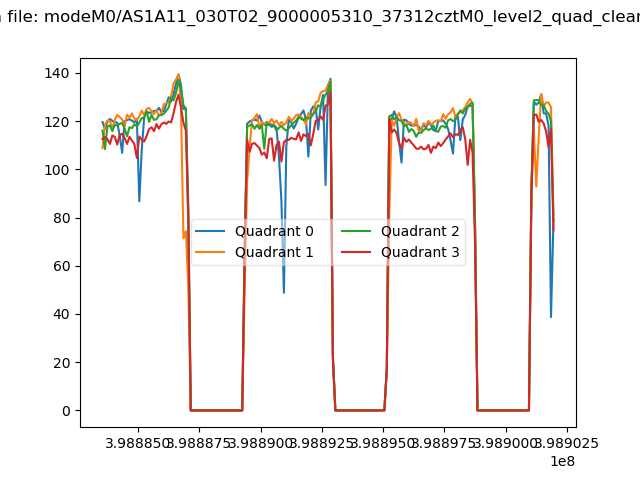 |
|
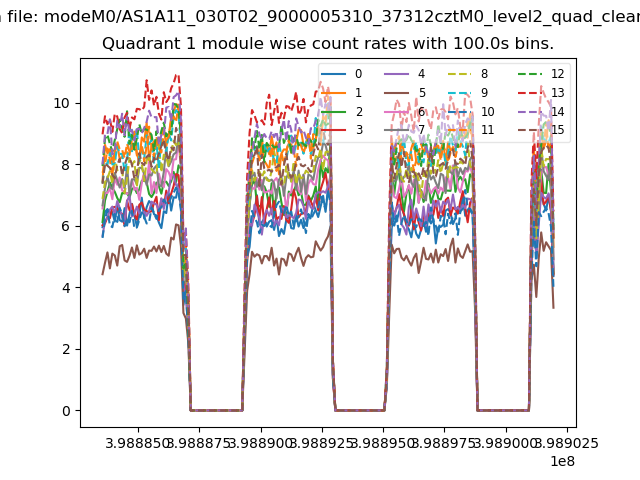
| Module-wise count rates for Quadrant A Data is divided into 100 sec bins |
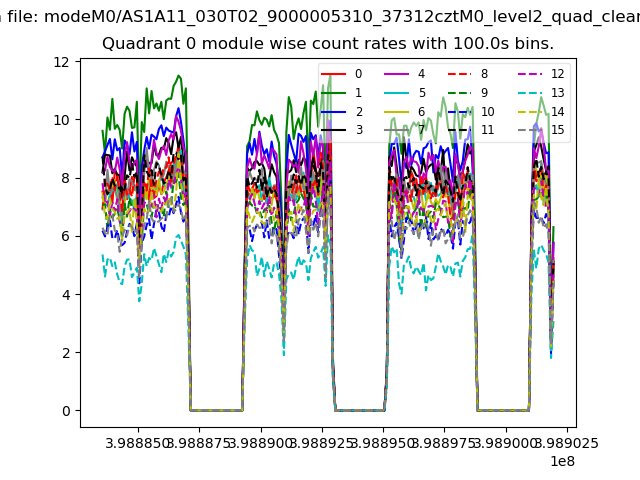 |
 |
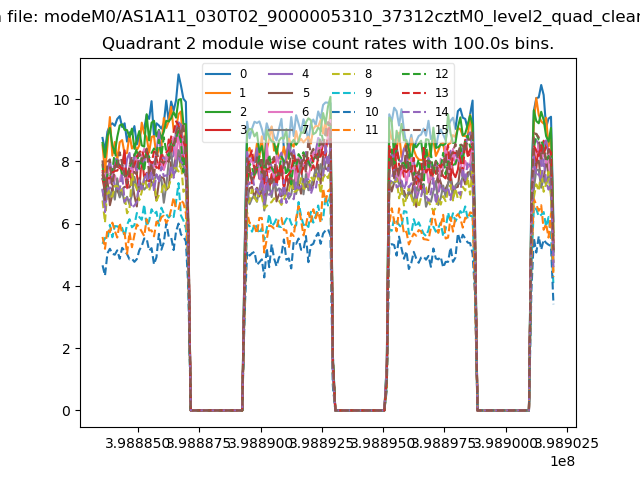
| Module-wise count rates for Quadrant B Data is divided into 100 sec bins |
 |
 |
| Module-wise count rates for Quadrant C Data is divided into 100 sec bins |
 |
 |
| Module-wise count rates for Quadrant D Data is divided into 100 sec bins |
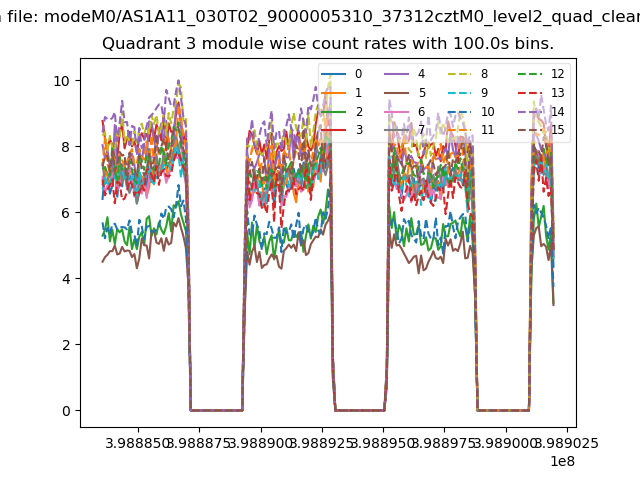 |
 |
| Parameter | Plot |
|---|---|
| CZT HV Monitor | 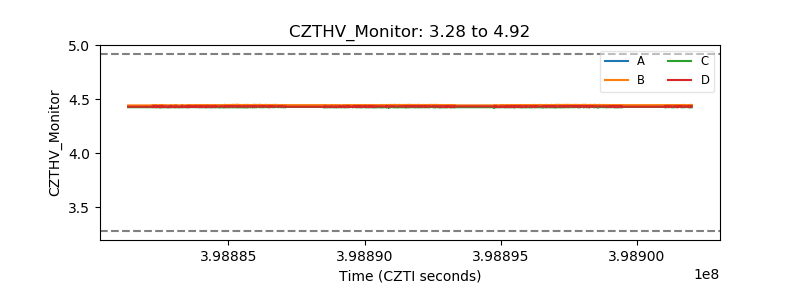 |
| D_VDD | 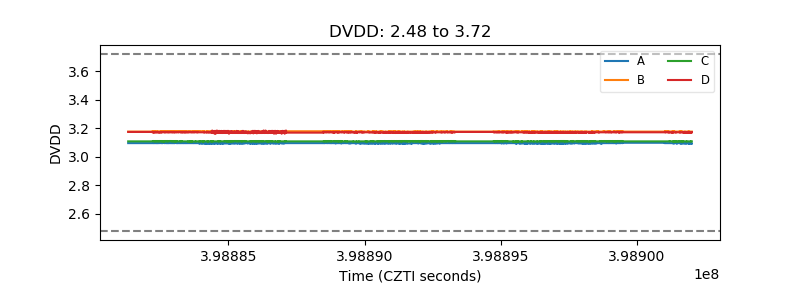 |
| Temperature 1 | 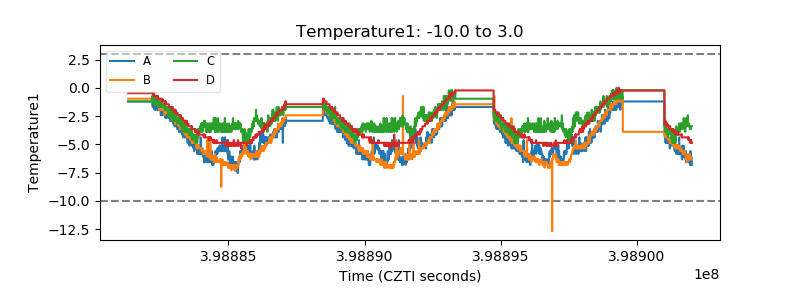 |
| Veto HV Monitor | 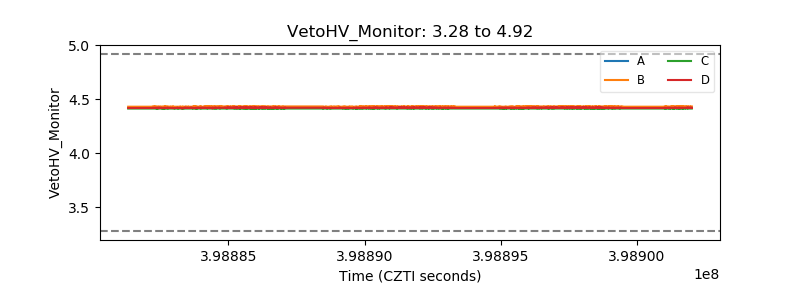 |
| Veto LLD | 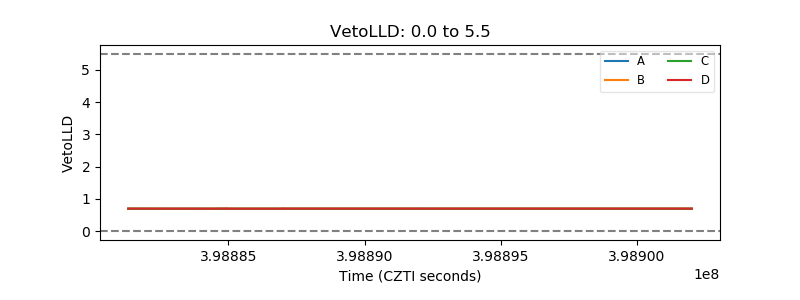 |
| Alpha Counter | 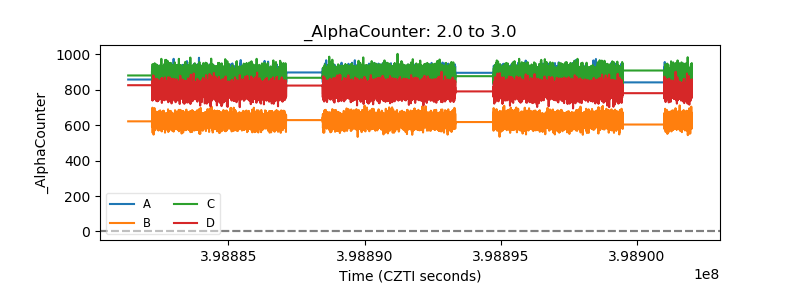 |
| _CPM_Rate | 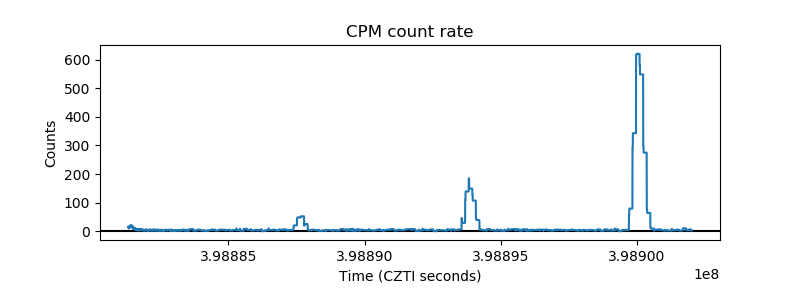 |
| CZT Counter | 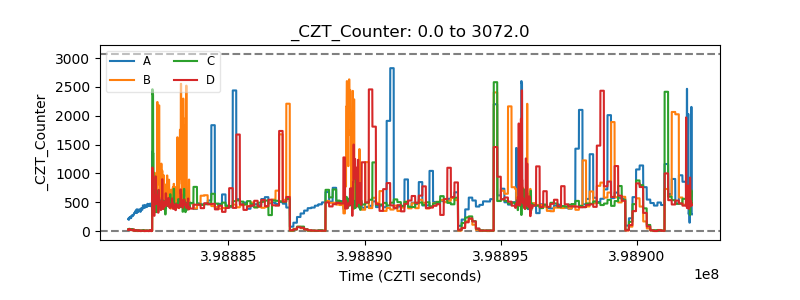 |
| +2.5 Volts monitor | 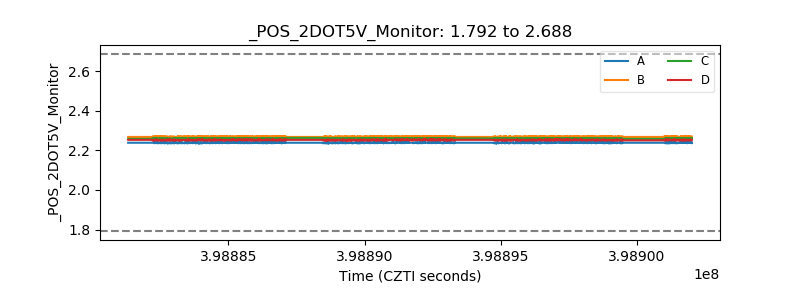 |
| +5 Volts monitor | 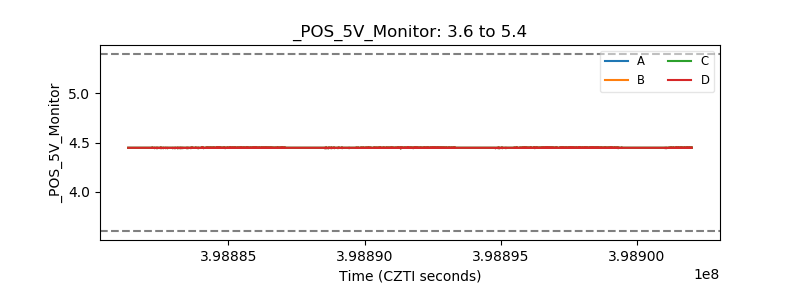 |
| _ROLL_ROT |  |
| _Roll_DEC | 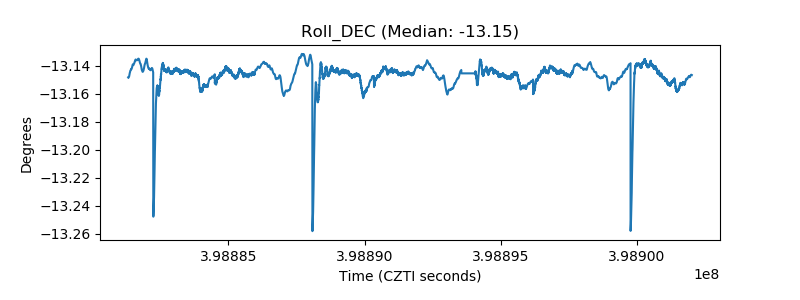 |
| _Roll_RA | 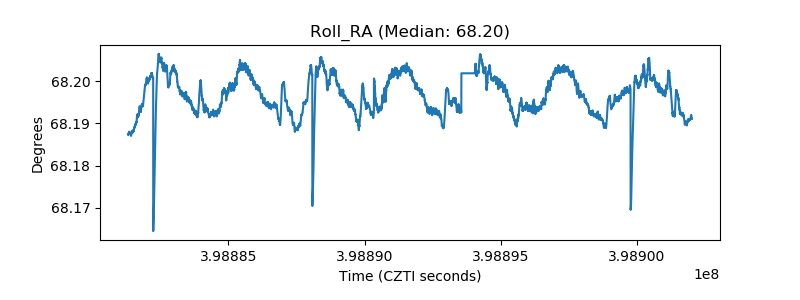 |
| Veto Counter | 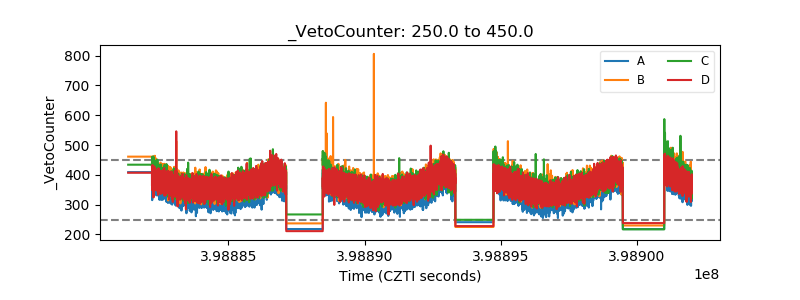 |