| Param | Original file | Final file |
|---|---|---|
| Filename | modeM0/AS1A11_030T02_9000005310_37313cztM0_level2.evt | modeM0/AS1A11_030T02_9000005310_37313cztM0_level2_quad_clean.evt |
| Size (bytes) | 489,533,760 | 83,004,480 |
| Size | 466.9 MB | 79.2 MB |
| Events in quadrant A | 3,097,507 | 538,251 |
| Events in quadrant B | 3,577,014 | 549,053 |
| Events in quadrant C | 4,263,330 | 539,427 |
| Events in quadrant D | 3,517,030 | 504,558 |
| Mode M0 | |||
|---|---|---|---|
| Quadrant | BADHDUFLAG | Total packets | Discarded packets |
| A | 0 | 12770 | 3 |
| B | 0 | 14386 | 2 |
| C | 0 | 16030 | 2 |
| D | 0 | 14224 | 2 |
| Mode SS | |||
|---|---|---|---|
| Quadrant | BADHDUFLAG | Total packets | Discarded packets |
| A | 0 | 112 | 0 |
| B | 0 | 112 | 0 |
| C | 0 | 112 | 0 |
| D | 0 | 112 | 0 |
| Mode M9 | |||
|---|---|---|---|
| Quadrant | BADHDUFLAG | Total packets | Discarded packets |
| A | 0 | 26 | 0 |
| B | 0 | 26 | 0 |
| C | 0 | 26 | 0 |
| D | 0 | 27 | 0 |
| Quadrant | Total seconds | Saturated seconds | Saturation percentage |
|---|---|---|---|
| A | 5454 | 159 | 2.915292% |
| B | 5454 | 317 | 5.812248% |
| C | 5454 | 611 | 11.202787% |
| D | 5454 | 247 | 4.528786% |
Noise dominated data is calculated using 1-second bins in cleaned event files. If a bin has >2000 counts, and if more than 50% of those come from <1% of pixels, then it is considered to be noise-dominated and hence unusable.
| Quadrant | # 1 sec bins | Bins with >0 counts | Bins with >2000 counts | High rate bins dominated by noise | Noise dominated (total time) | Noise dominated (detector-on time) | Marked lightcurve |
|---|---|---|---|---|---|---|---|
| A | 7126 | 5455 | 74 | 74 | 1.04% | 1.36% | 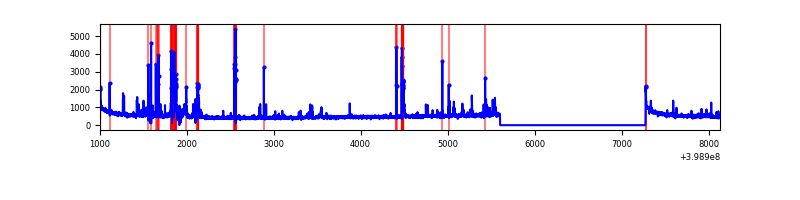 |
| B | 7126 | 5455 | 186 | 186 | 2.61% | 3.41% | 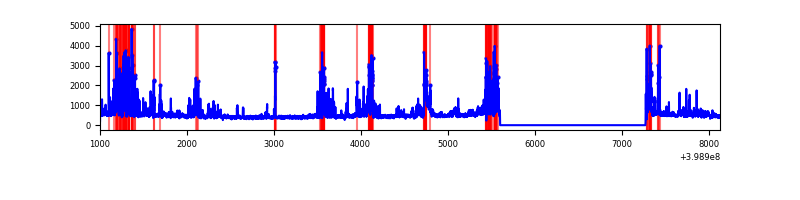 |
| C | 7126 | 5455 | 563 | 563 | 7.90% | 10.32% | 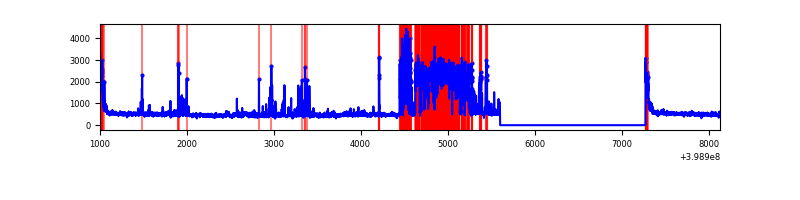 |
| D | 7126 | 5455 | 197 | 197 | 2.76% | 3.61% | 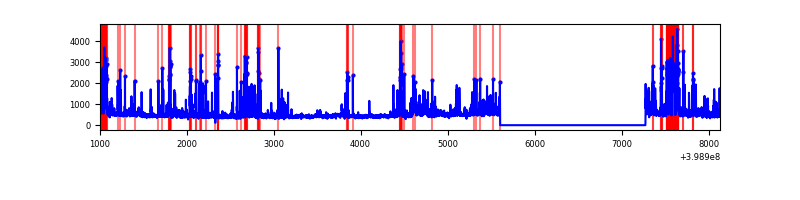 |
Top three noisy pixels from each quadrant. If the there are fewer than three noisy pixels in the level2.evt file, extra rows are filled as -1
| Pixel properties | Quadrant properties | ||||||
|---|---|---|---|---|---|---|---|
| Quadrant | DetID | PixID | Counts | Sigma | Mean | Median | Sigma |
| A | 15 | 237 | 342937 | 2749.03 | 611 | 600 | 124.5 |
| A | 10 | 83 | 267558 | 2143.72 | 611 | 600 | 124.5 |
| A | 13 | 248 | 47991 | 380.56 | 611 | 600 | 124.5 |
| B | 5 | 172 | 794890 | 6804.79 | 608 | 590 | 116.7 |
| B | 0 | 213 | 187922 | 1604.87 | 608 | 590 | 116.7 |
| B | 12 | 18 | 79789 | 678.5 | 608 | 590 | 116.7 |
| C | 1 | 23 | 1555281 | 11146.23 | 589 | 592 | 139.5 |
| C | 15 | 214 | 221951 | 1587.02 | 589 | 592 | 139.5 |
| C | 0 | 10 | 149097 | 1064.7 | 589 | 592 | 139.5 |
| D | 13 | 249 | 455945 | 3089.81 | 597 | 580 | 147.4 |
| D | 2 | 249 | 428205 | 2901.58 | 597 | 580 | 147.4 |
| D | 10 | 253 | 111921 | 755.49 | 597 | 580 | 147.4 |
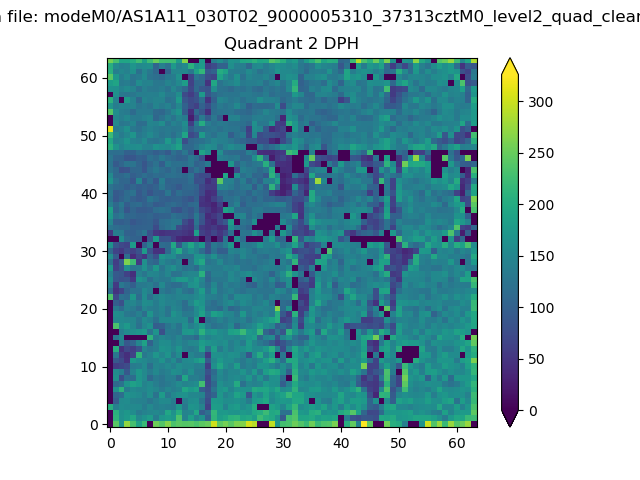
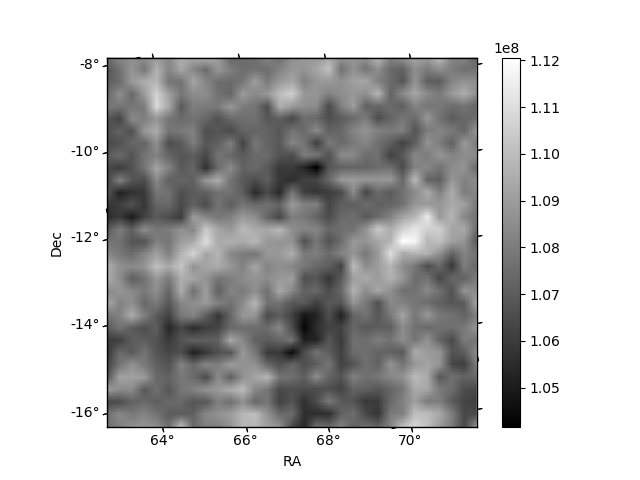
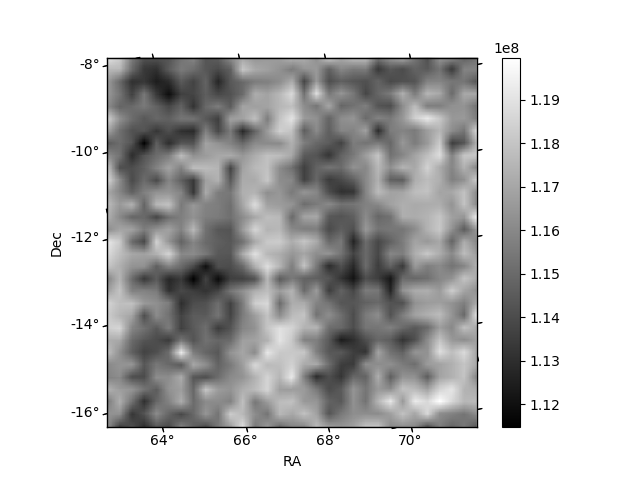
Histogram calculated using DETX and DETY for each event in the final _common_clean file
| Quadrant A | 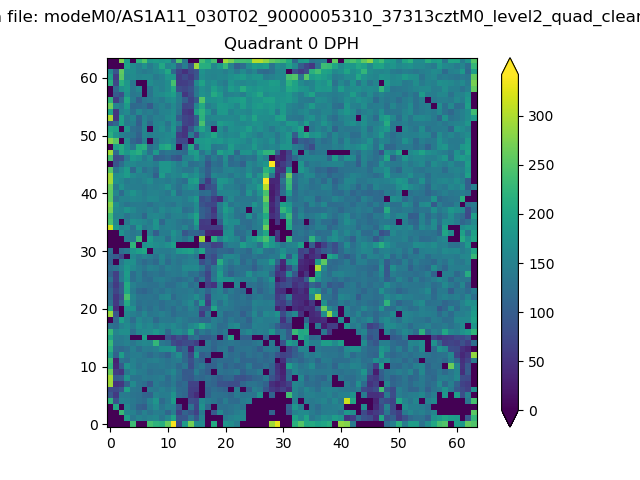 |
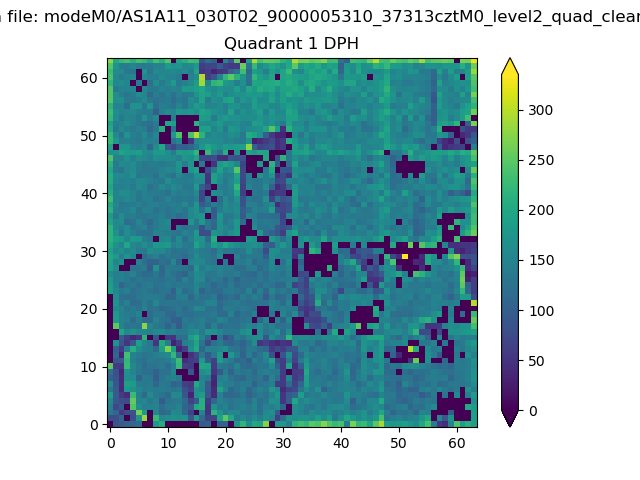 |
Quadrant B |
|---|---|---|---|
| Quadrant D | 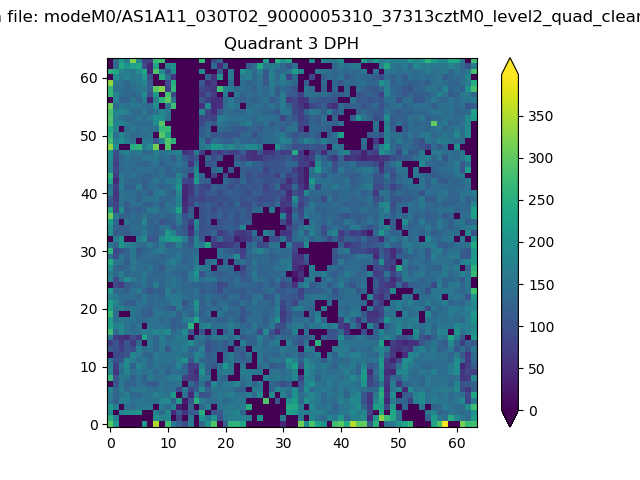 |
 |
Quadrant C |
| Plot type | Count rate plots | Images |
|---|---|---|
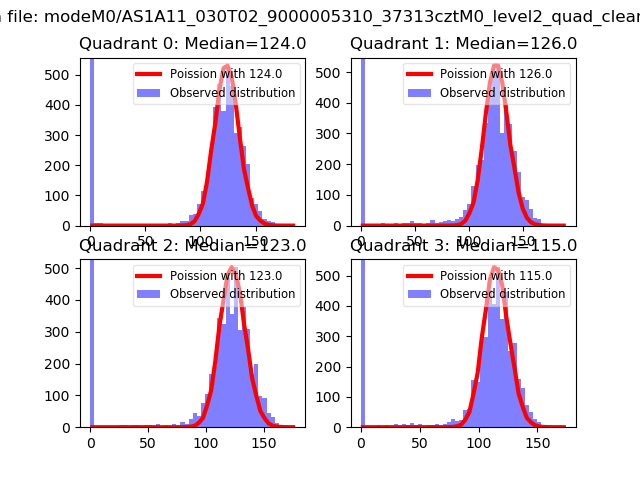
| Comparison with Poisson distribution Blue bars denote a histogram of data divided into 1 sec bins. Red curve is a Poisson curve with rate = median count rate of data. |
 |
 |
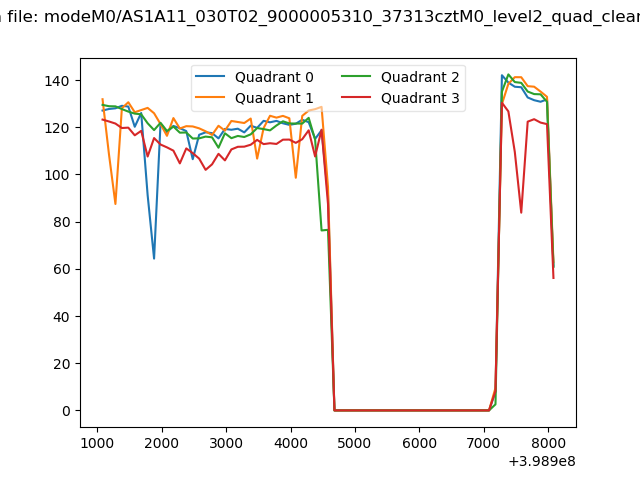
| Quadrant-wise count rates Data is divided into 100 sec bins |
 |
|
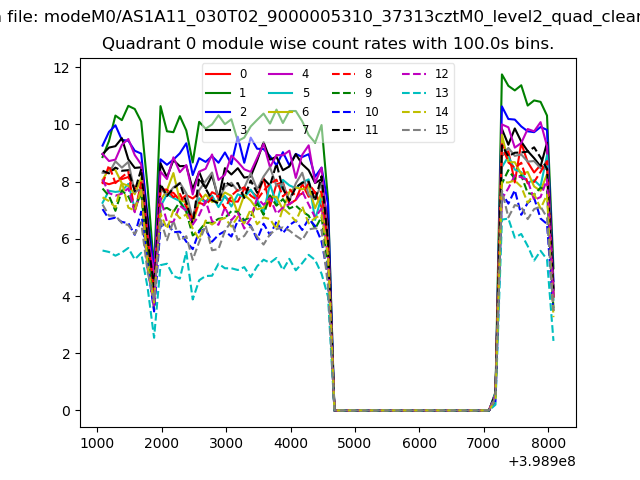
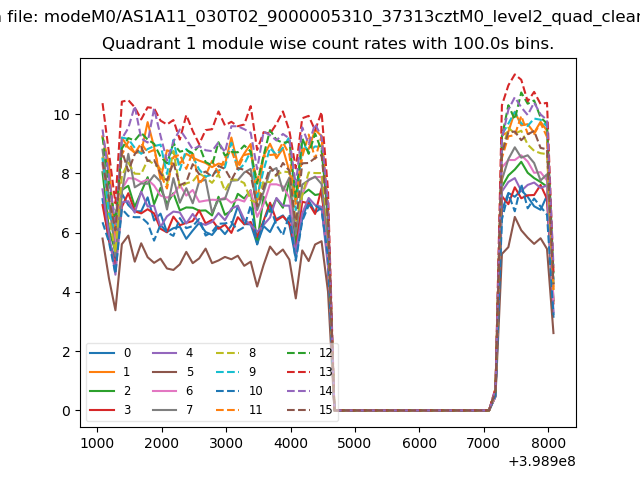
| Module-wise count rates for Quadrant A Data is divided into 100 sec bins |
 |
 |
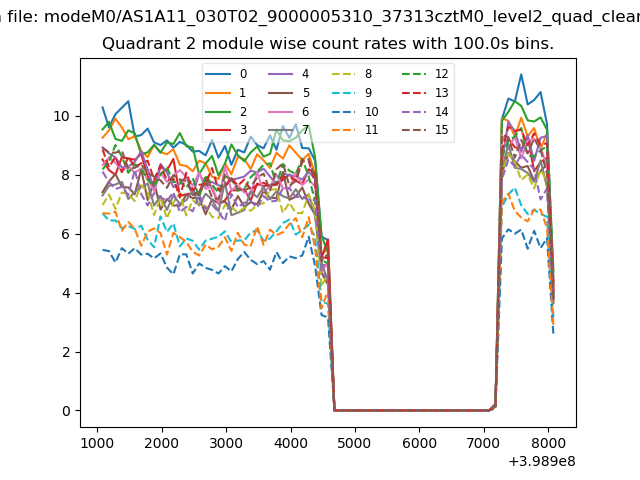
| Module-wise count rates for Quadrant B Data is divided into 100 sec bins |
 |
 |
| Module-wise count rates for Quadrant C Data is divided into 100 sec bins |
 |
 |
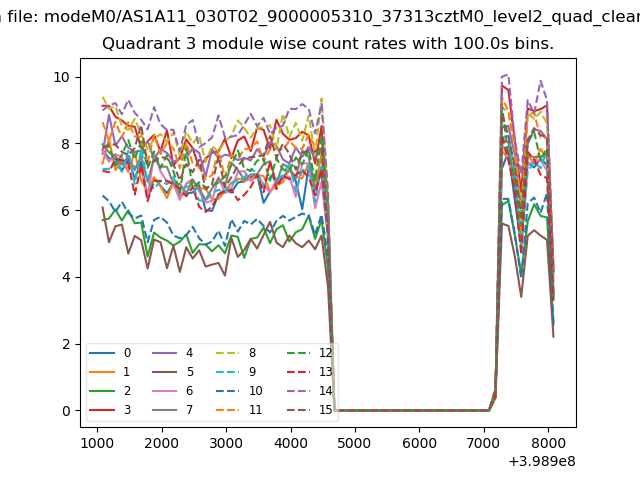
| Module-wise count rates for Quadrant D Data is divided into 100 sec bins |
 |
 |
| Parameter | Plot |
|---|---|
| CZT HV Monitor | 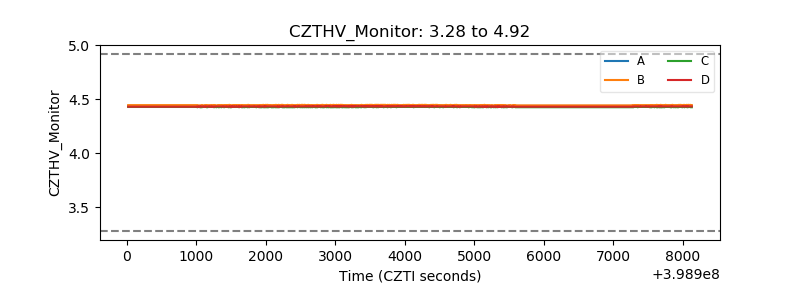 |
| D_VDD | 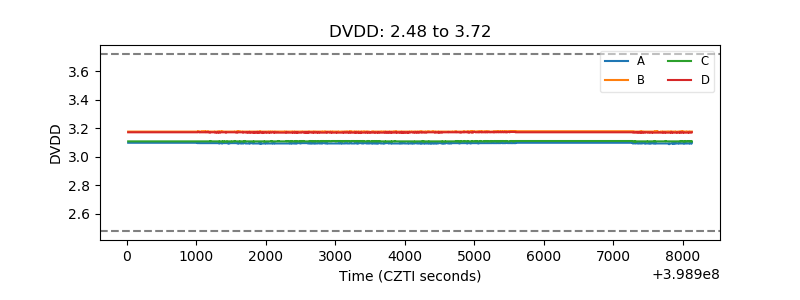 |
| Temperature 1 | 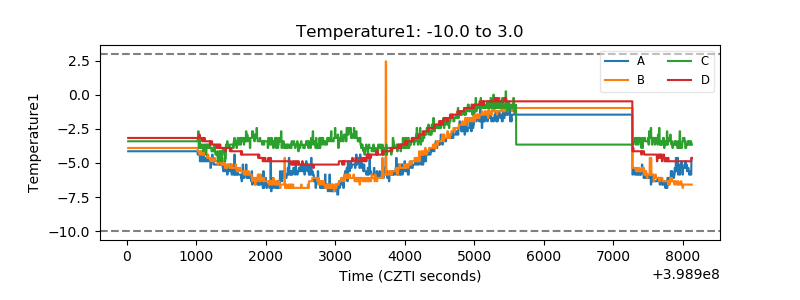 |
| Veto HV Monitor | 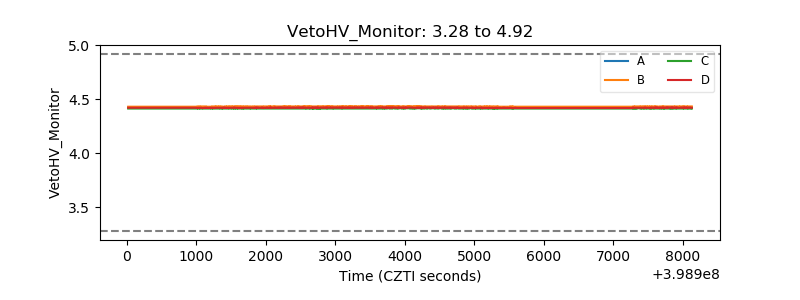 |
| Veto LLD | 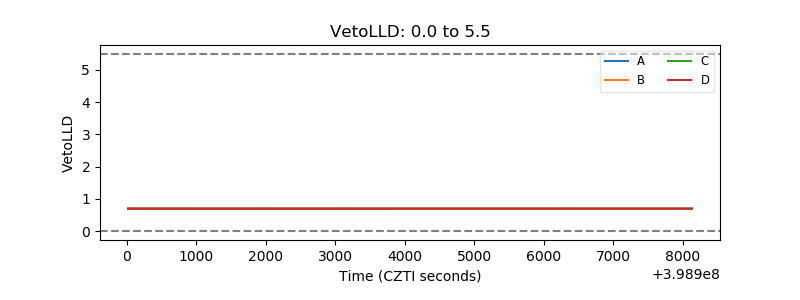 |
| Alpha Counter | 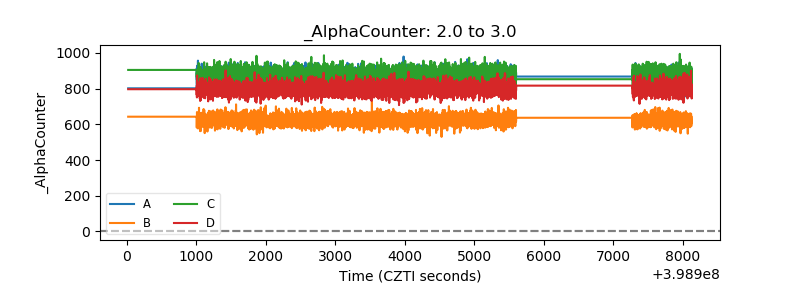 |
| _CPM_Rate | 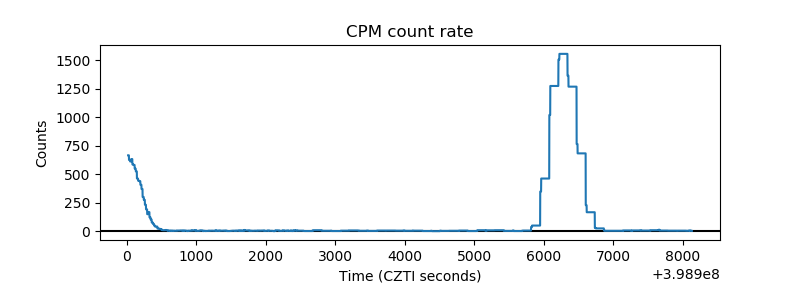 |
| CZT Counter | 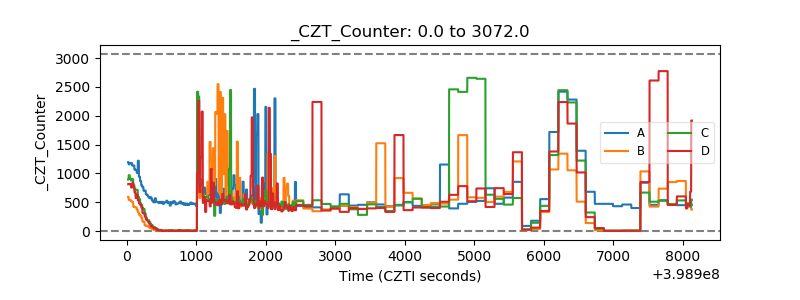 |
| +2.5 Volts monitor | 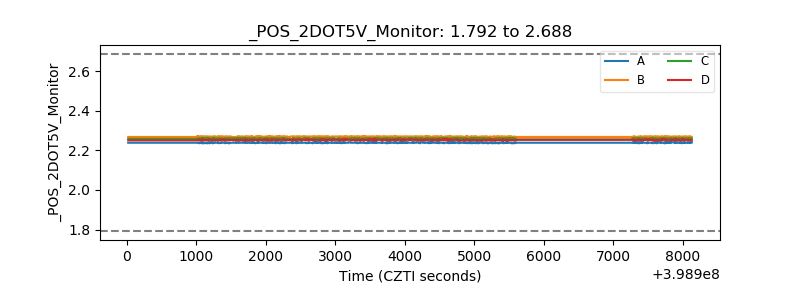 |
| +5 Volts monitor | 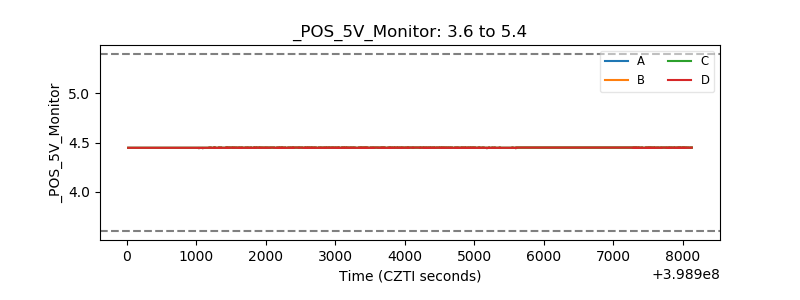 |
| _ROLL_ROT | 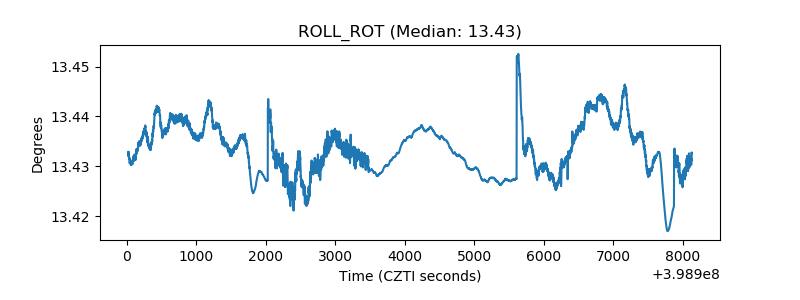 |
| _Roll_DEC |  |
| _Roll_RA | 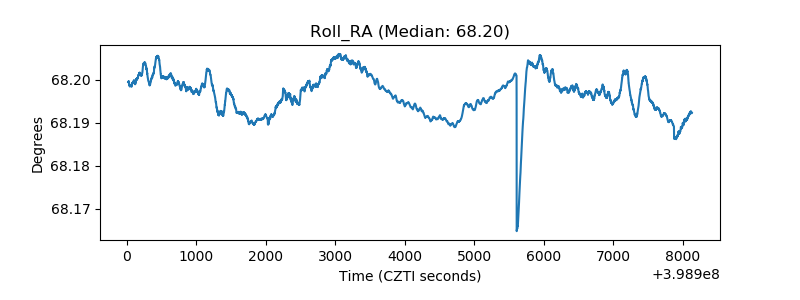 |
| Veto Counter | 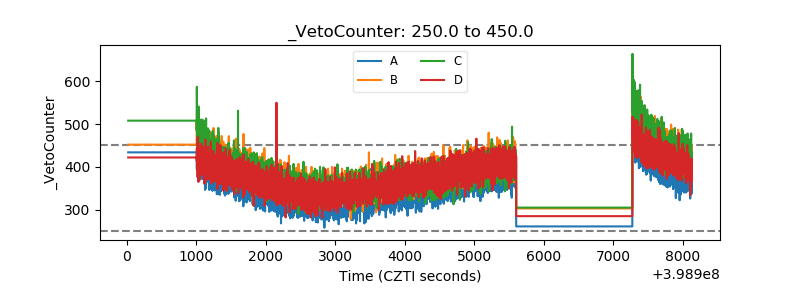 |