| Param | Original file | Final file |
|---|---|---|
| Filename | modeM0/AS1A11_030T02_9000005310_37315cztM0_level2.evt | modeM0/AS1A11_030T02_9000005310_37315cztM0_level2_quad_clean.evt |
| Size (bytes) | 439,914,240 | 81,806,400 |
| Size | 419.5 MB | 78.0 MB |
| Events in quadrant A | 2,923,752 | 533,755 |
| Events in quadrant B | 2,867,390 | 548,738 |
| Events in quadrant C | 2,886,859 | 538,290 |
| Events in quadrant D | 4,279,220 | 479,615 |
| Mode M0 | |||
|---|---|---|---|
| Quadrant | BADHDUFLAG | Total packets | Discarded packets |
| A | 0 | 12097 | 3 |
| B | 0 | 12050 | 2 |
| C | 0 | 11808 | 2 |
| D | 0 | 16398 | 2 |
| Mode SS | |||
|---|---|---|---|
| Quadrant | BADHDUFLAG | Total packets | Discarded packets |
| A | 0 | 110 | 0 |
| B | 0 | 110 | 0 |
| C | 0 | 110 | 0 |
| D | 0 | 110 | 0 |
| Mode M9 | |||
|---|---|---|---|
| Quadrant | BADHDUFLAG | Total packets | Discarded packets |
| A | 0 | 30 | 0 |
| B | 0 | 30 | 0 |
| C | 0 | 30 | 0 |
| D | 0 | 31 | 0 |
| Quadrant | Total seconds | Saturated seconds | Saturation percentage |
|---|---|---|---|
| A | 5381 | 73 | 1.356625% |
| B | 5381 | 85 | 1.579632% |
| C | 5381 | 60 | 1.115034% |
| D | 5381 | 478 | 8.883107% |
Noise dominated data is calculated using 1-second bins in cleaned event files. If a bin has >2000 counts, and if more than 50% of those come from <1% of pixels, then it is considered to be noise-dominated and hence unusable.
| Quadrant | # 1 sec bins | Bins with >0 counts | Bins with >2000 counts | High rate bins dominated by noise | Noise dominated (total time) | Noise dominated (detector-on time) | Marked lightcurve |
|---|---|---|---|---|---|---|---|
| A | 7174 | 5382 | 48 | 48 | 0.67% | 0.89% | 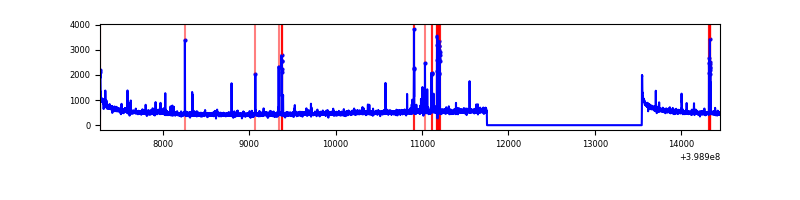 |
| B | 7174 | 5382 | 42 | 42 | 0.59% | 0.78% | 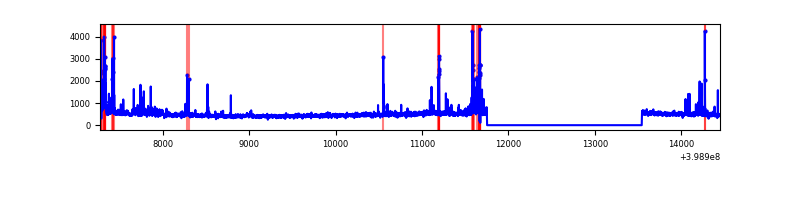 |
| C | 7174 | 5382 | 41 | 41 | 0.57% | 0.76% | 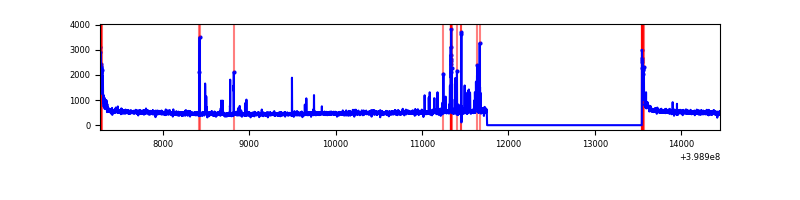 |
| D | 7174 | 5382 | 434 | 434 | 6.05% | 8.06% | 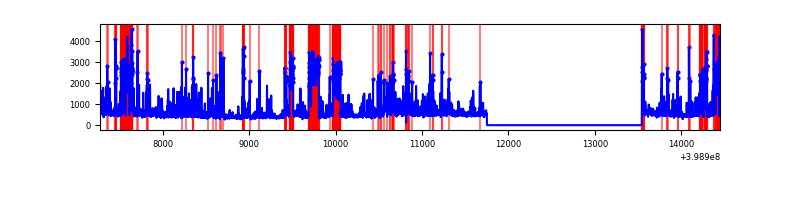 |
Top three noisy pixels from each quadrant. If the there are fewer than three noisy pixels in the level2.evt file, extra rows are filled as -1
| Pixel properties | Quadrant properties | ||||||
|---|---|---|---|---|---|---|---|
| Quadrant | DetID | PixID | Counts | Sigma | Mean | Median | Sigma |
| A | 10 | 83 | 270946 | 2167.37 | 620 | 609 | 124.7 |
| A | 15 | 237 | 102102 | 813.7 | 620 | 609 | 124.7 |
| A | 9 | 143 | 71925 | 571.76 | 620 | 609 | 124.7 |
| B | 5 | 172 | 242974 | 2038.16 | 621 | 606 | 118.9 |
| B | 0 | 213 | 48642 | 403.95 | 621 | 606 | 118.9 |
| B | 5 | 200 | 31168 | 257.01 | 621 | 606 | 118.9 |
| C | 15 | 214 | 227748 | 1573.19 | 615 | 619 | 144.4 |
| C | 0 | 10 | 116550 | 802.98 | 615 | 619 | 144.4 |
| C | 14 | 254 | 111831 | 770.3 | 615 | 619 | 144.4 |
| D | 12 | 227 | 641614 | 4479.79 | 590 | 575 | 143.1 |
| D | 2 | 249 | 550731 | 3844.67 | 590 | 575 | 143.1 |
| D | 13 | 249 | 313975 | 2190.14 | 590 | 575 | 143.1 |
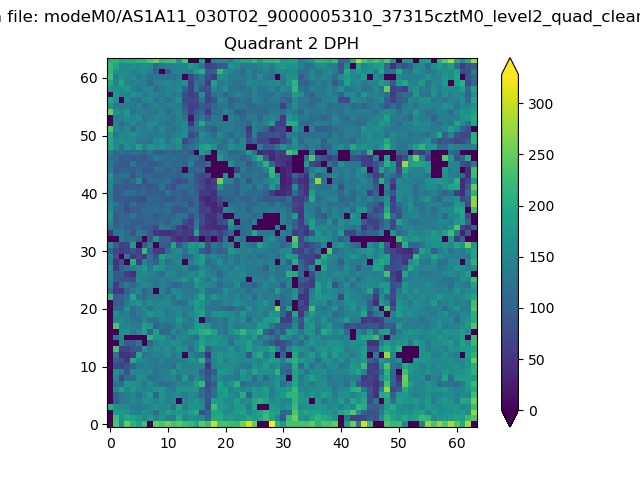
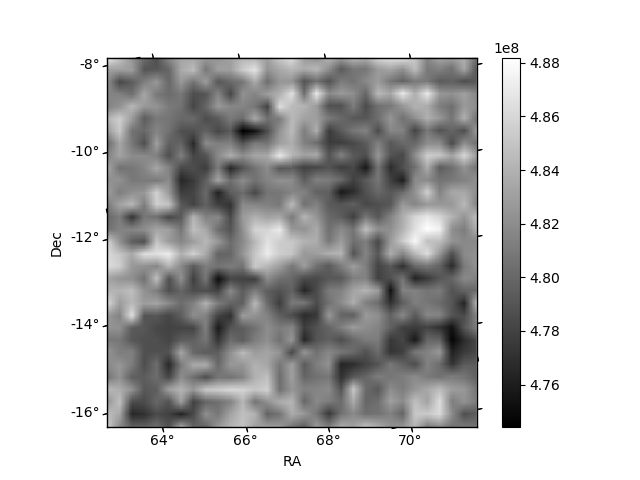
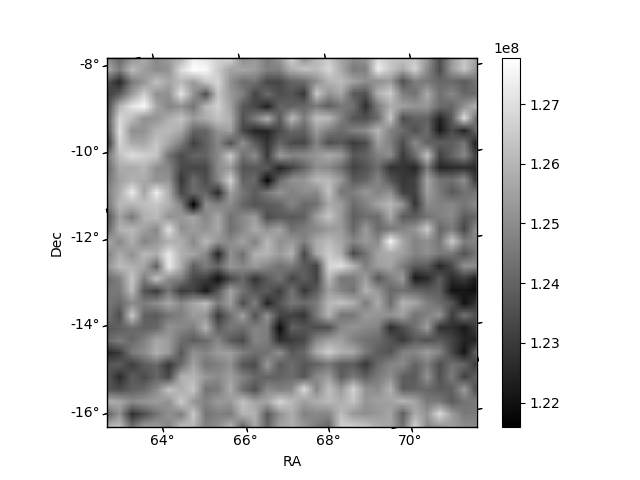
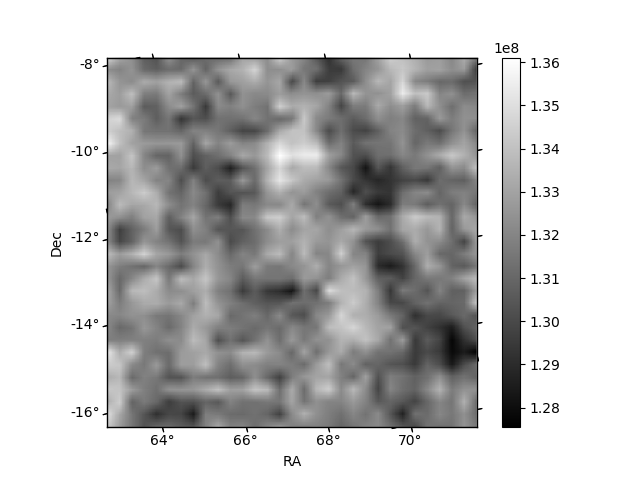
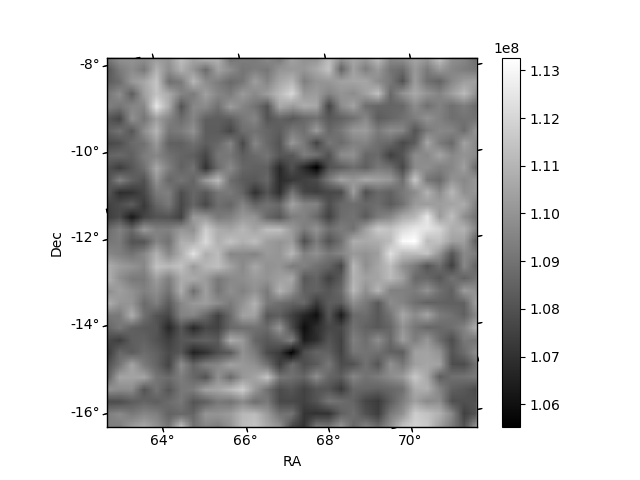
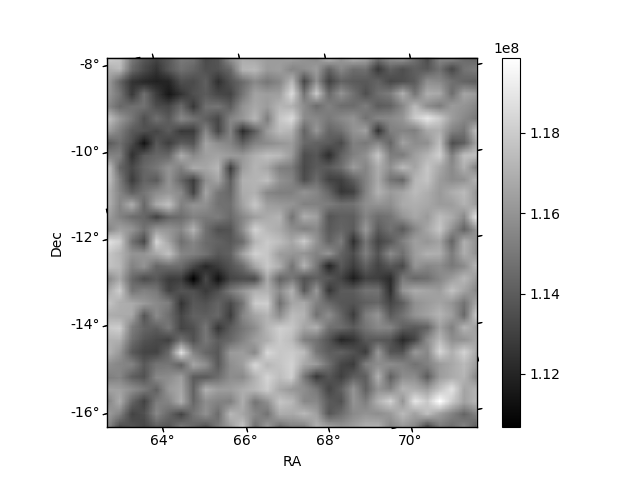
Histogram calculated using DETX and DETY for each event in the final _common_clean file
| Quadrant A | 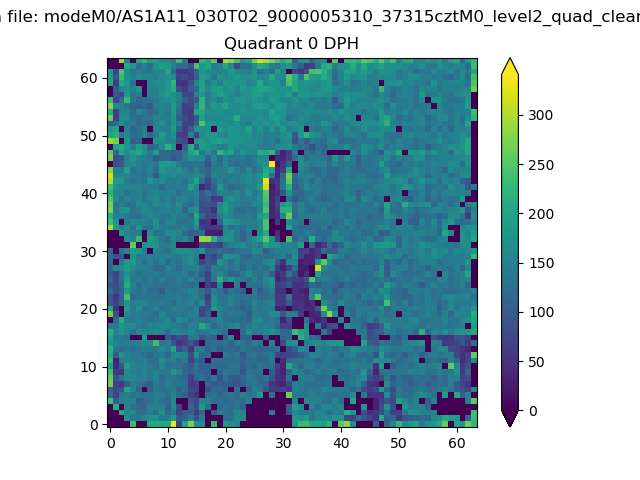 |
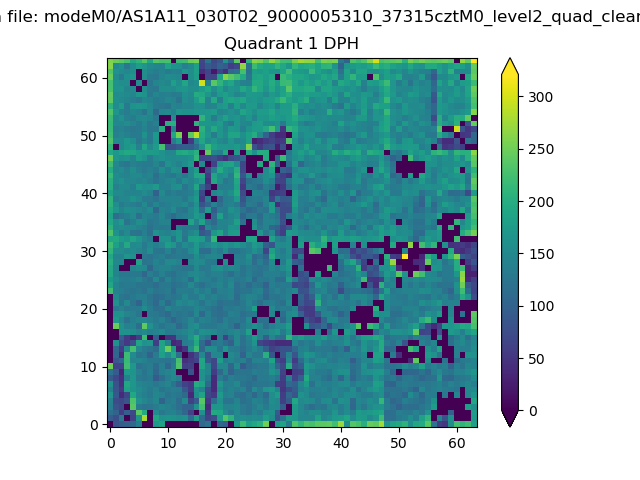 |
Quadrant B |
|---|---|---|---|
| Quadrant D | 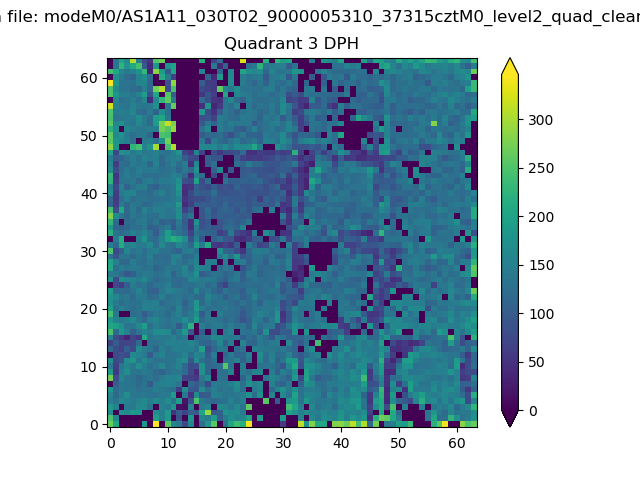 |
 |
Quadrant C |
| Plot type | Count rate plots | Images |
|---|---|---|
| Comparison with Poisson distribution Blue bars denote a histogram of data divided into 1 sec bins. Red curve is a Poisson curve with rate = median count rate of data. |
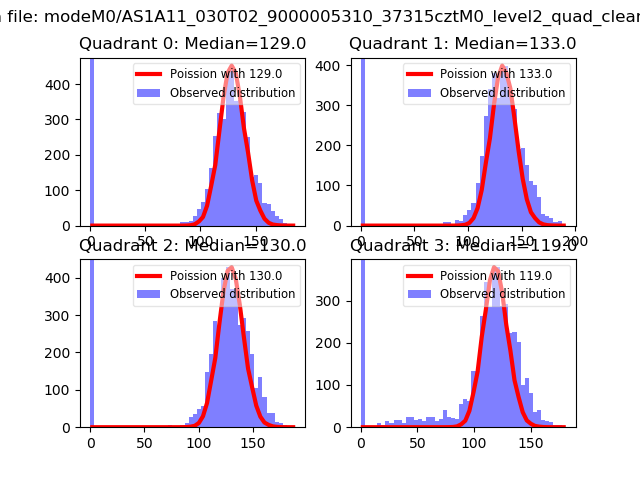 |
 |
| Quadrant-wise count rates Data is divided into 100 sec bins |
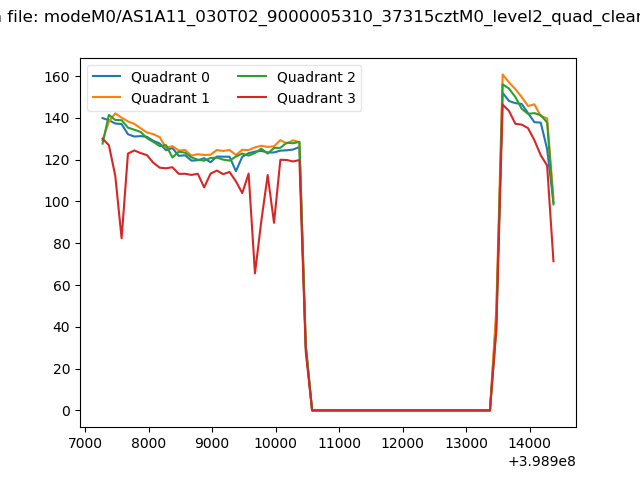 |
|
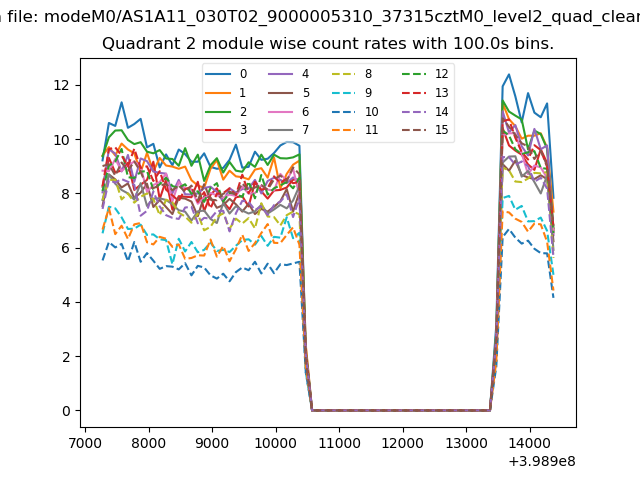
| Module-wise count rates for Quadrant A Data is divided into 100 sec bins |
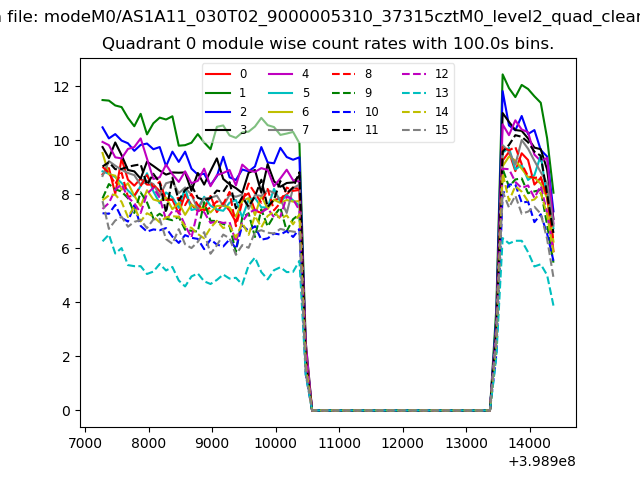 |
 |
| Module-wise count rates for Quadrant B Data is divided into 100 sec bins |
 |
 |
| Module-wise count rates for Quadrant C Data is divided into 100 sec bins |
 |
 |
| Module-wise count rates for Quadrant D Data is divided into 100 sec bins |
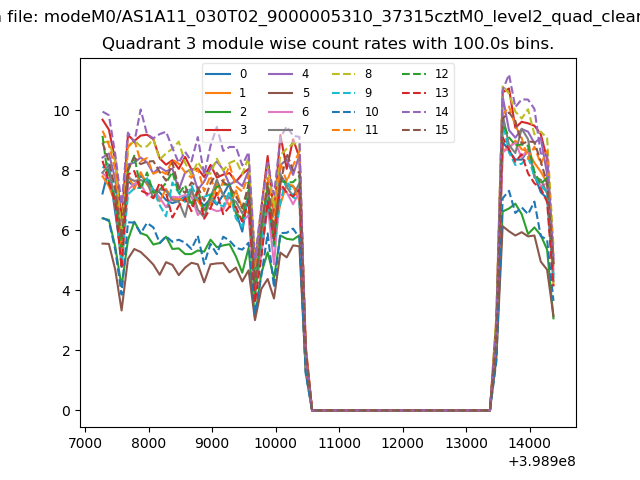 |
 |
| Parameter | Plot |
|---|---|
| CZT HV Monitor | 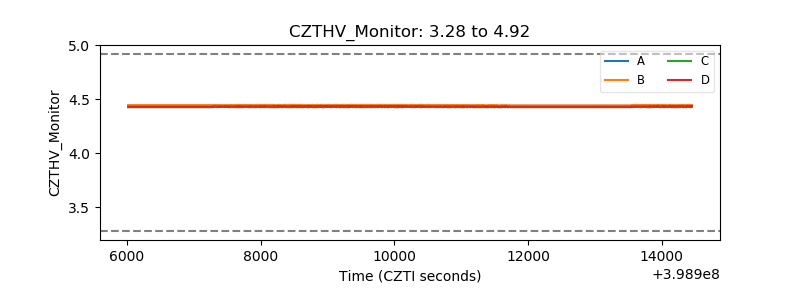 |
| D_VDD | 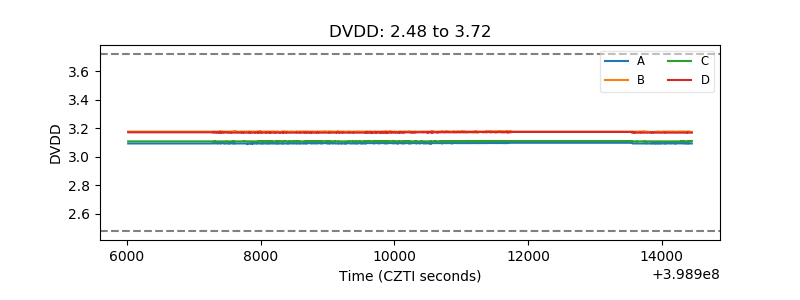 |
| Temperature 1 | 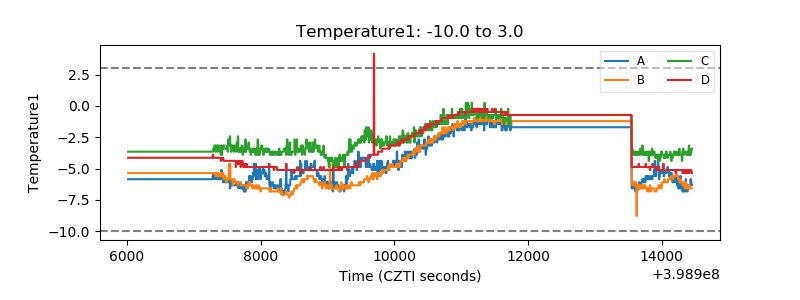 |
| Veto HV Monitor | 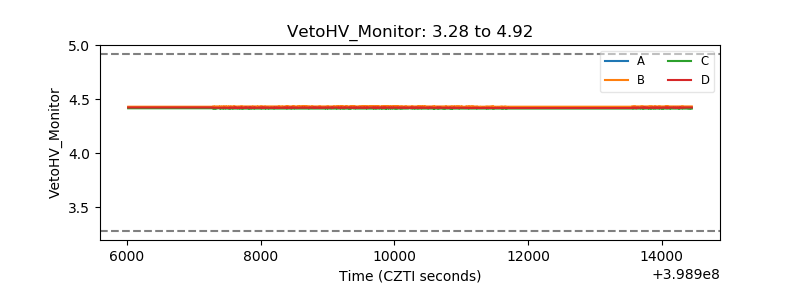 |
| Veto LLD | 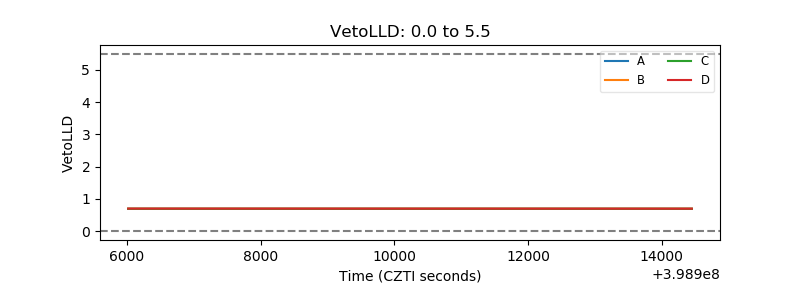 |
| Alpha Counter | 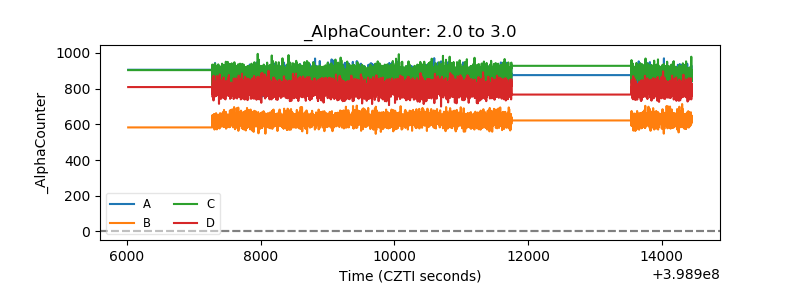 |
| _CPM_Rate | 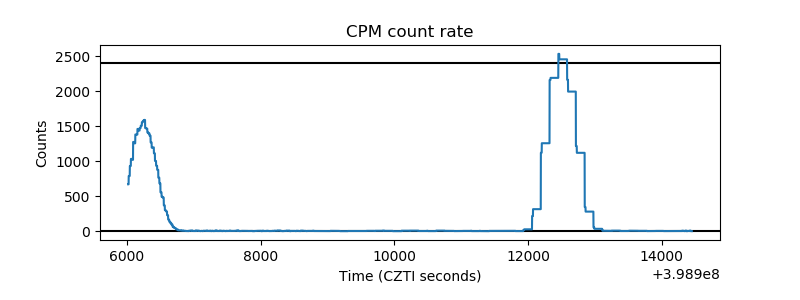 |
| CZT Counter | 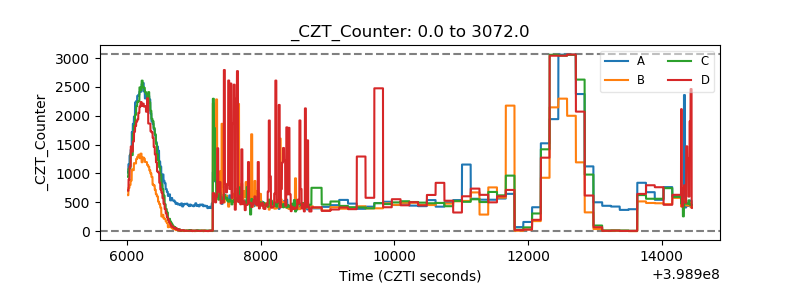 |
| +2.5 Volts monitor | 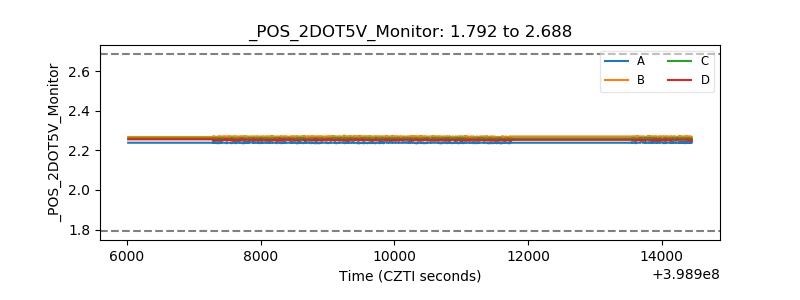 |
| +5 Volts monitor | 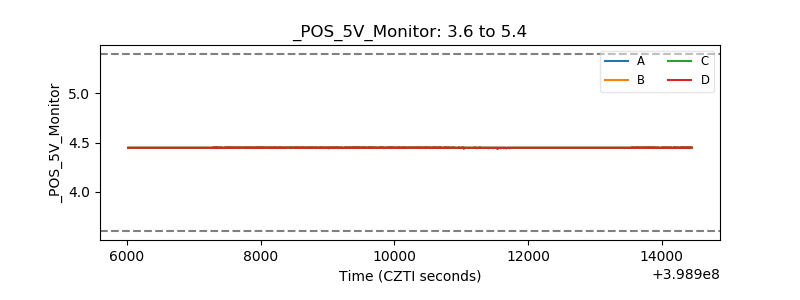 |
| _ROLL_ROT | 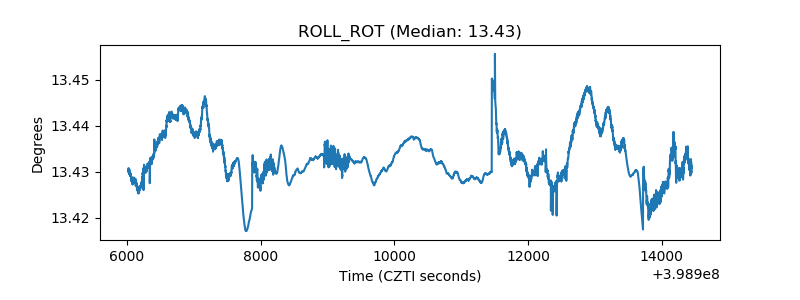 |
| _Roll_DEC |  |
| _Roll_RA | 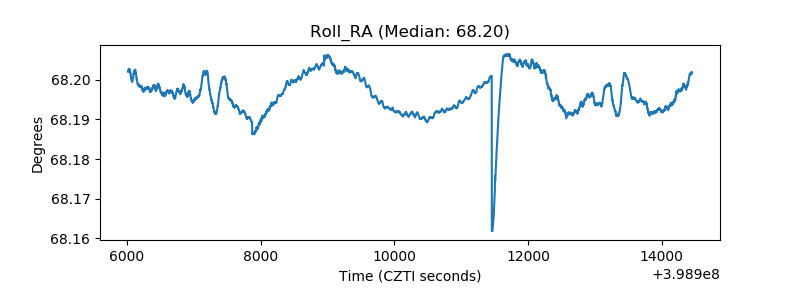 |
| Veto Counter | 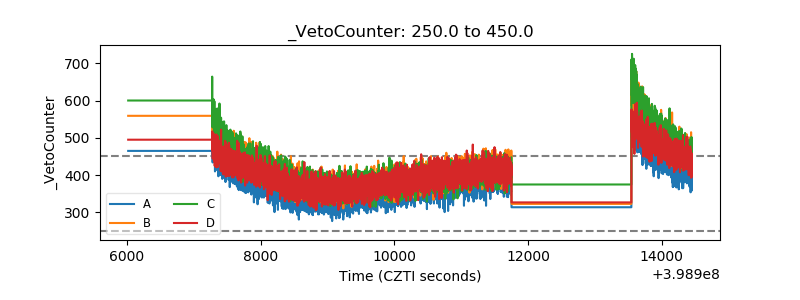 |