| Param | Original file | Final file |
|---|---|---|
| Filename | modeM0/AS1A11_030T02_9000005310_37316cztM0_level2.evt | modeM0/AS1A11_030T02_9000005310_37316cztM0_level2_quad_clean.evt |
| Size (bytes) | 388,097,280 | 75,640,320 |
| Size | 370.1 MB | 72.1 MB |
| Events in quadrant A | 2,836,710 | 483,024 |
| Events in quadrant B | 2,625,097 | 503,913 |
| Events in quadrant C | 2,687,659 | 489,979 |
| Events in quadrant D | 3,257,036 | 456,042 |
| Mode M0 | |||
|---|---|---|---|
| Quadrant | BADHDUFLAG | Total packets | Discarded packets |
| A | 0 | 11574 | 3 |
| B | 0 | 10971 | 2 |
| C | 0 | 10900 | 2 |
| D | 0 | 13088 | 2 |
| Mode SS | |||
|---|---|---|---|
| Quadrant | BADHDUFLAG | Total packets | Discarded packets |
| A | 0 | 104 | 0 |
| B | 0 | 104 | 0 |
| C | 0 | 104 | 0 |
| D | 0 | 104 | 0 |
| Mode M9 | |||
|---|---|---|---|
| Quadrant | BADHDUFLAG | Total packets | Discarded packets |
| A | 0 | 36 | 0 |
| B | 0 | 36 | 0 |
| C | 0 | 36 | 0 |
| D | 0 | 36 | 0 |
| Quadrant | Total seconds | Saturated seconds | Saturation percentage |
|---|---|---|---|
| A | 5100 | 66 | 1.294118% |
| B | 5100 | 67 | 1.313725% |
| C | 5100 | 24 | 0.470588% |
| D | 5100 | 186 | 3.647059% |
Noise dominated data is calculated using 1-second bins in cleaned event files. If a bin has >2000 counts, and if more than 50% of those come from <1% of pixels, then it is considered to be noise-dominated and hence unusable.
| Quadrant | # 1 sec bins | Bins with >0 counts | Bins with >2000 counts | High rate bins dominated by noise | Noise dominated (total time) | Noise dominated (detector-on time) | Marked lightcurve |
|---|---|---|---|---|---|---|---|
| A | 7013 | 5101 | 49 | 49 | 0.70% | 0.96% | 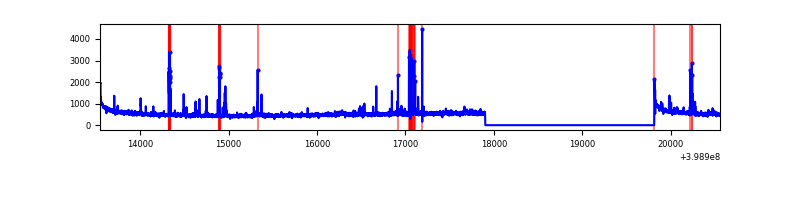 |
| B | 7013 | 5101 | 40 | 40 | 0.57% | 0.78% | 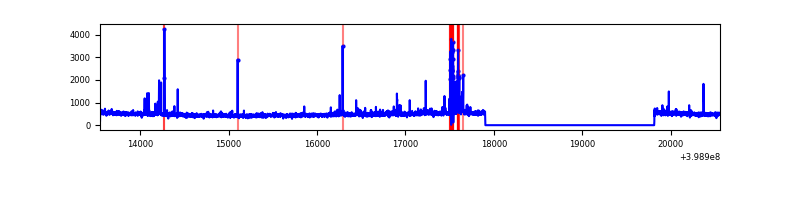 |
| C | 7013 | 5101 | 18 | 18 | 0.26% | 0.35% | 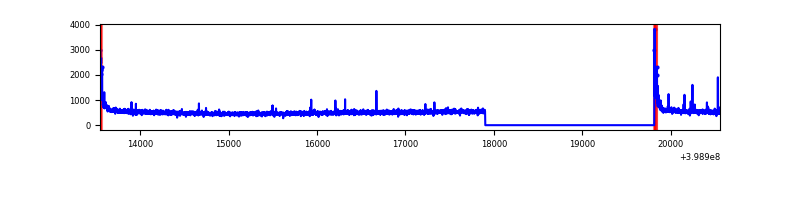 |
| D | 7013 | 5101 | 152 | 152 | 2.17% | 2.98% | 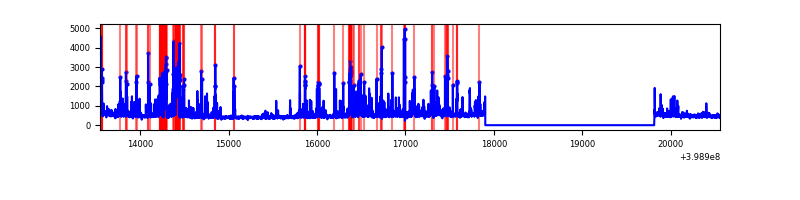 |
Top three noisy pixels from each quadrant. If the there are fewer than three noisy pixels in the level2.evt file, extra rows are filled as -1
| Pixel properties | Quadrant properties | ||||||
|---|---|---|---|---|---|---|---|
| Quadrant | DetID | PixID | Counts | Sigma | Mean | Median | Sigma |
| A | 10 | 83 | 263128 | 2173.67 | 603 | 592 | 120.8 |
| A | 15 | 237 | 125546 | 1034.56 | 603 | 592 | 120.8 |
| A | 13 | 248 | 52055 | 426.09 | 603 | 592 | 120.8 |
| B | 5 | 172 | 190725 | 1659.86 | 604 | 589 | 114.5 |
| B | 4 | 141 | 21774 | 184.94 | 604 | 589 | 114.5 |
| B | 0 | 213 | 17714 | 149.5 | 604 | 589 | 114.5 |
| C | 15 | 214 | 214923 | 1534.21 | 599 | 607 | 139.7 |
| C | 0 | 10 | 99504 | 707.97 | 599 | 607 | 139.7 |
| C | 1 | 23 | 22067 | 153.62 | 599 | 607 | 139.7 |
| D | 2 | 249 | 349867 | 2432.44 | 590 | 576 | 143.6 |
| D | 13 | 249 | 244498 | 1698.66 | 590 | 576 | 143.6 |
| D | 13 | 171 | 198638 | 1379.29 | 590 | 576 | 143.6 |
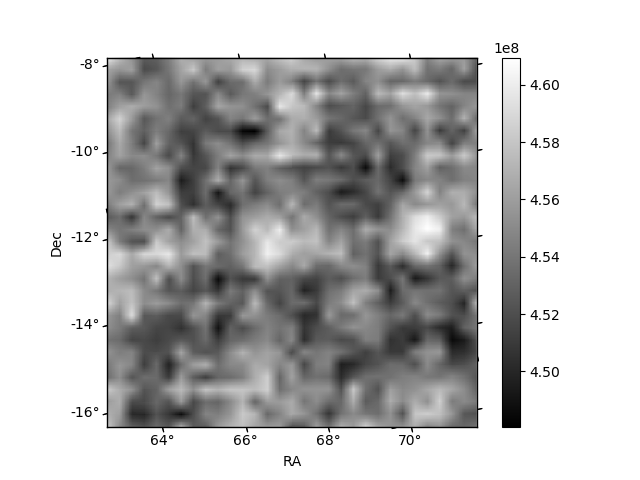
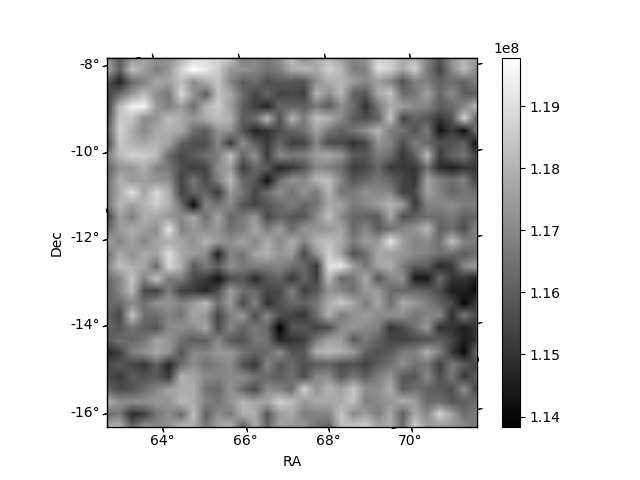
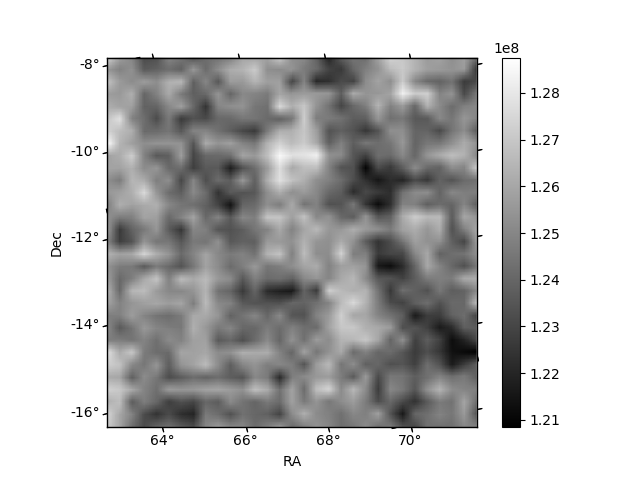
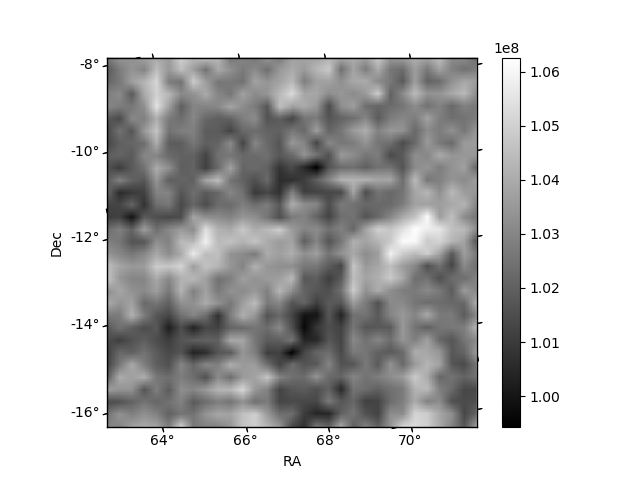
Histogram calculated using DETX and DETY for each event in the final _common_clean file
| Quadrant A | 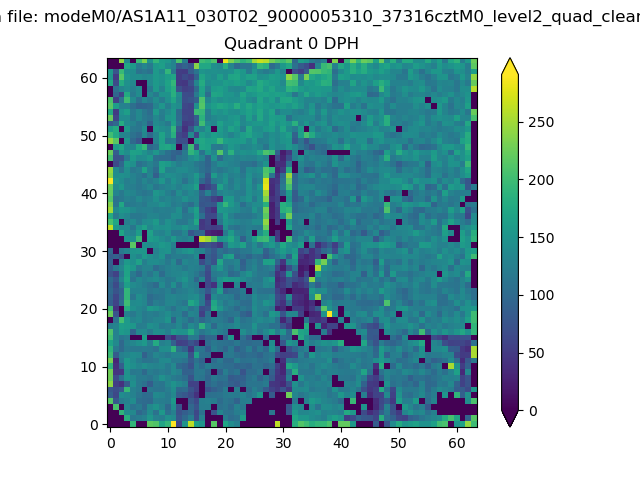 |
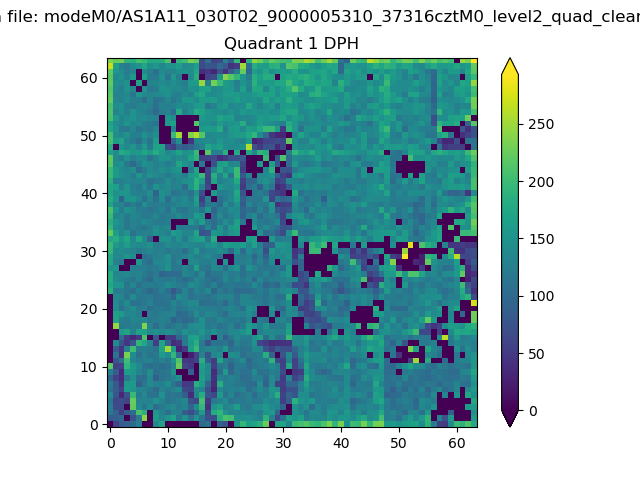 |
Quadrant B |
|---|---|---|---|
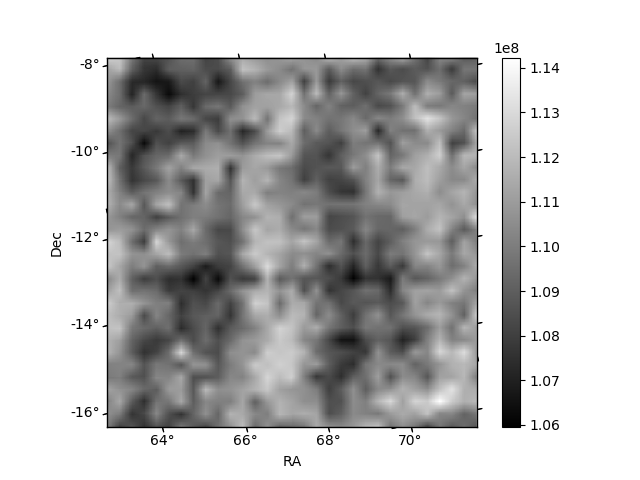
| Quadrant D | 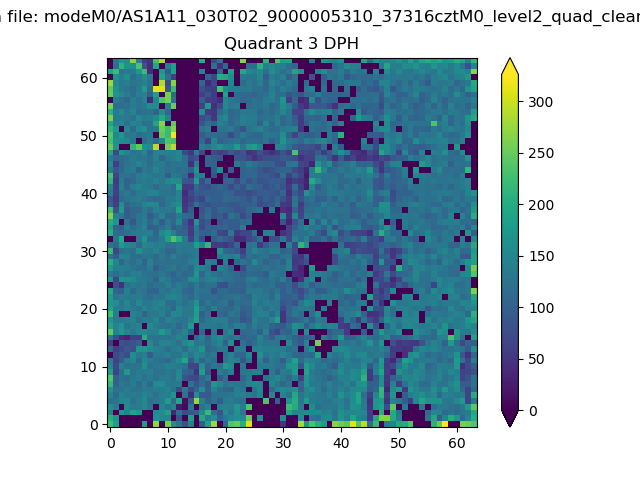 |
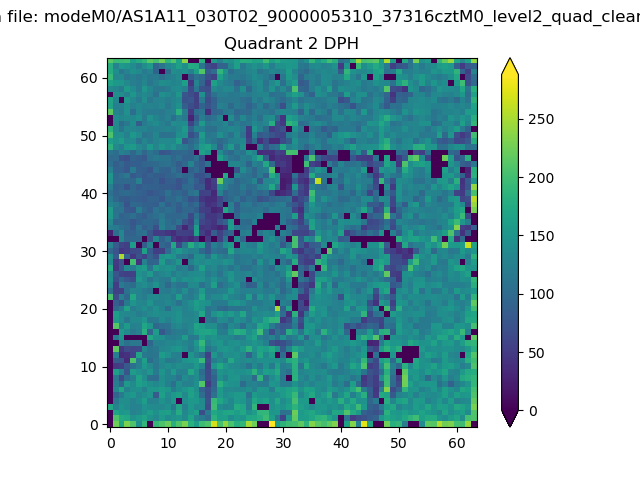 |
Quadrant C |
| Plot type | Count rate plots | Images |
|---|---|---|
| Comparison with Poisson distribution Blue bars denote a histogram of data divided into 1 sec bins. Red curve is a Poisson curve with rate = median count rate of data. |
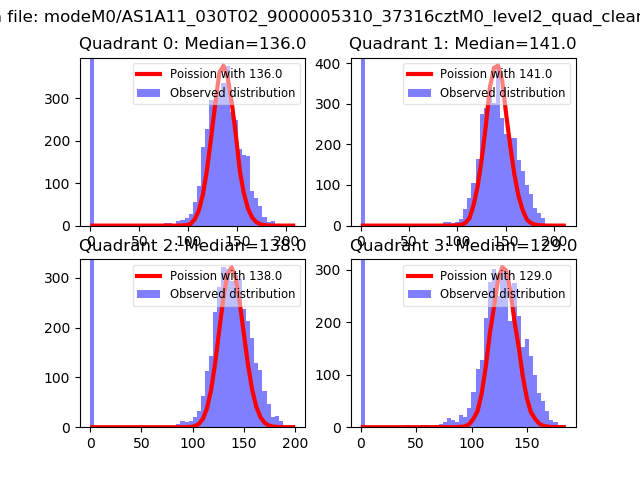 |
 |
| Quadrant-wise count rates Data is divided into 100 sec bins |
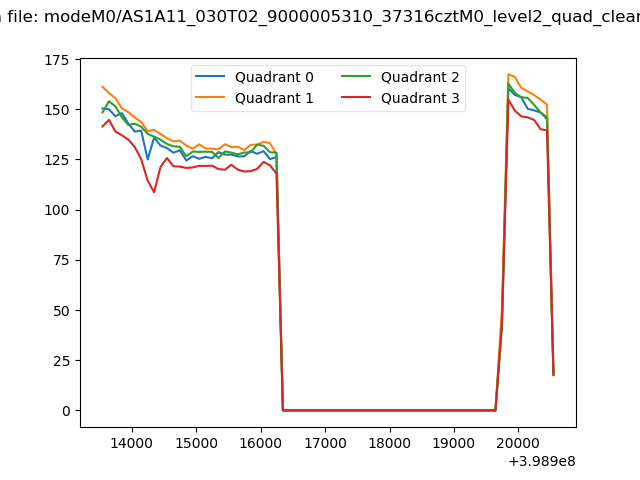 |
|
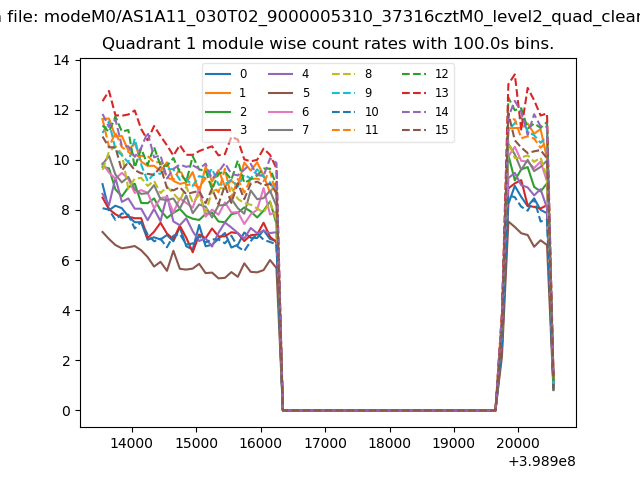
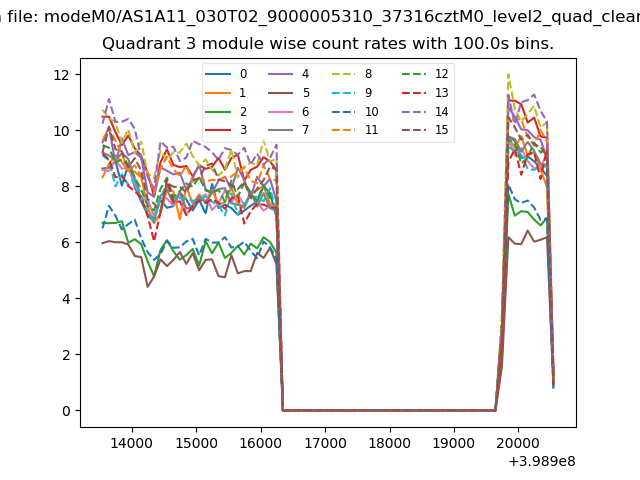
| Module-wise count rates for Quadrant A Data is divided into 100 sec bins |
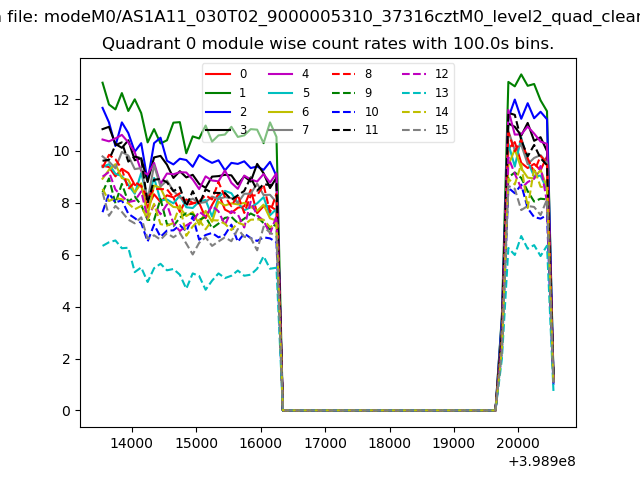 |
 |
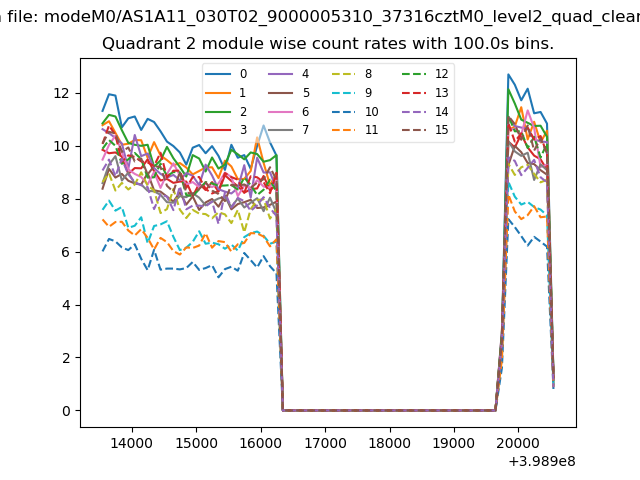
| Module-wise count rates for Quadrant B Data is divided into 100 sec bins |
 |
 |
| Module-wise count rates for Quadrant C Data is divided into 100 sec bins |
 |
 |
| Module-wise count rates for Quadrant D Data is divided into 100 sec bins |
 |
 |
| Parameter | Plot |
|---|---|
| CZT HV Monitor | 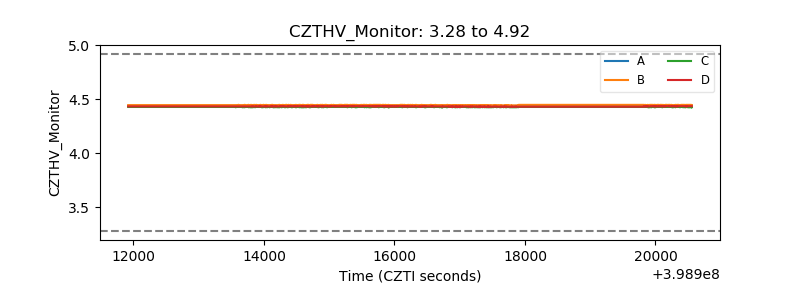 |
| D_VDD | 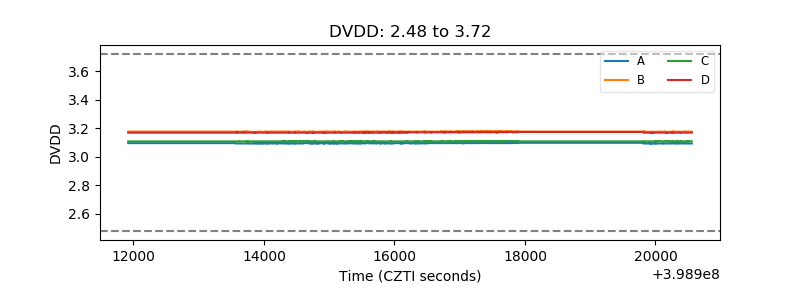 |
| Temperature 1 | 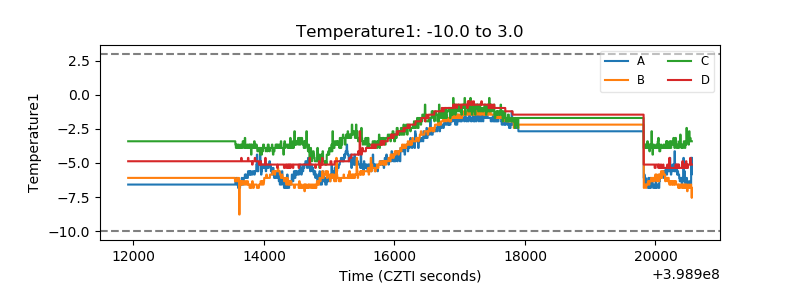 |
| Veto HV Monitor | 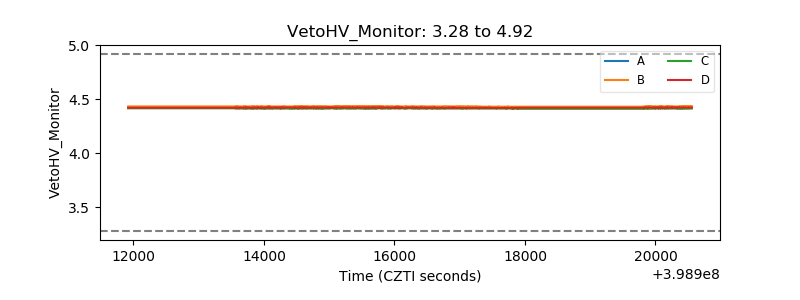 |
| Veto LLD | 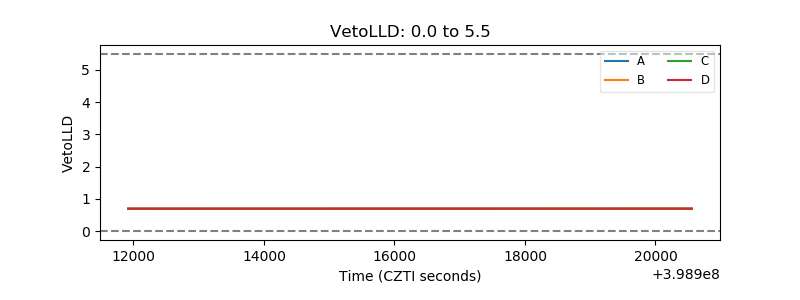 |
| Alpha Counter | 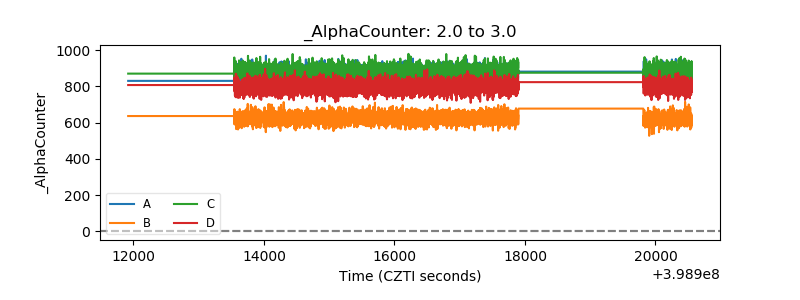 |
| _CPM_Rate | 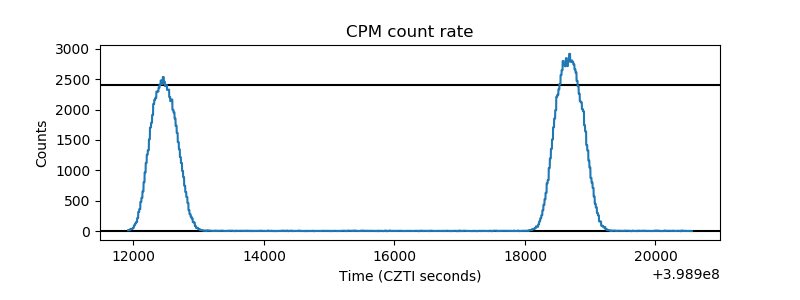 |
| CZT Counter | 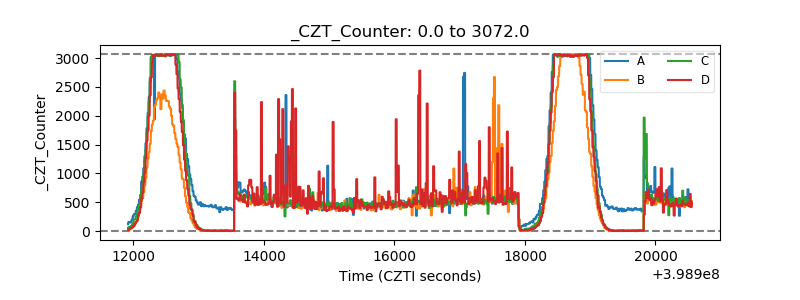 |
| +2.5 Volts monitor | 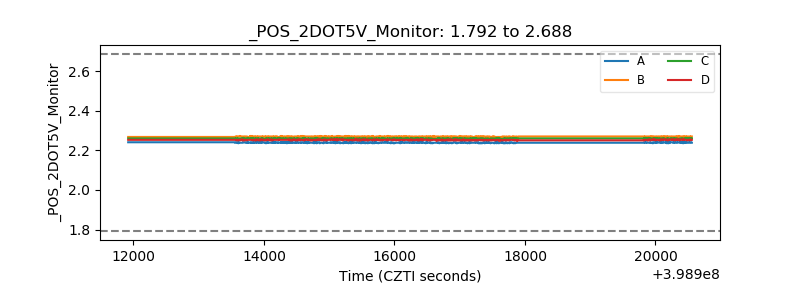 |
| +5 Volts monitor | 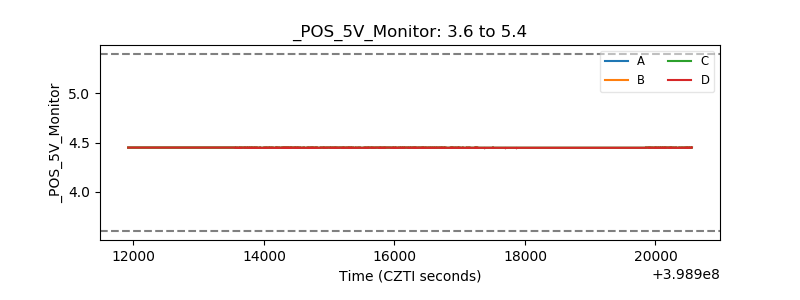 |
| _ROLL_ROT | 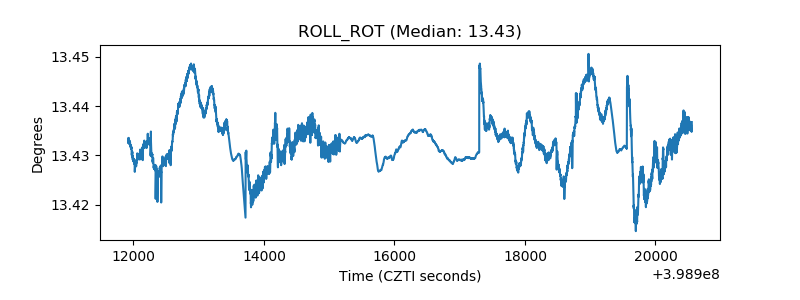 |
| _Roll_DEC |  |
| _Roll_RA | 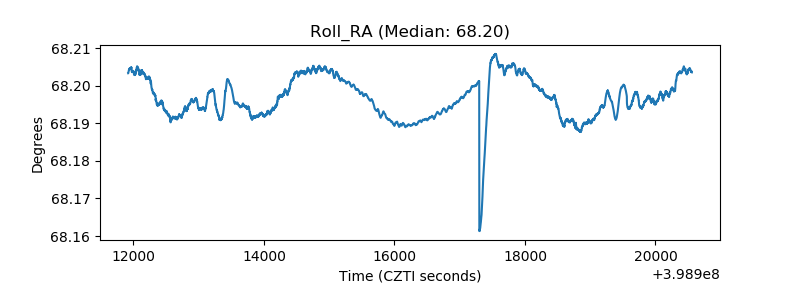 |
| Veto Counter | 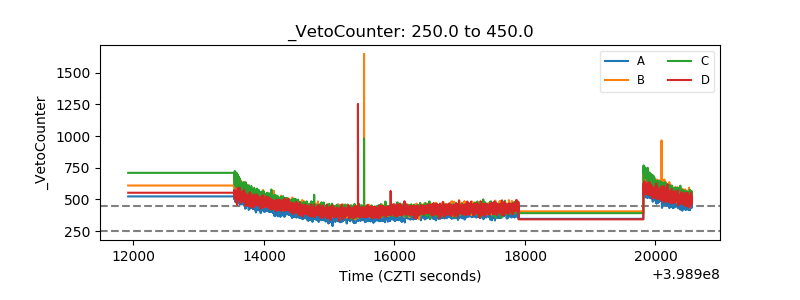 |