| Param | Original file | Final file |
|---|---|---|
| Filename | modeM0/AS1A11_030T02_9000005310_37317cztM0_level2.evt | modeM0/AS1A11_030T02_9000005310_37317cztM0_level2_quad_clean.evt |
| Size (bytes) | 430,413,120 | 79,488,000 |
| Size | 410.5 MB | 75.8 MB |
| Events in quadrant A | 3,108,251 | 503,625 |
| Events in quadrant B | 3,034,801 | 524,277 |
| Events in quadrant C | 3,328,171 | 505,488 |
| Events in quadrant D | 3,180,763 | 479,232 |
| Mode M0 | |||
|---|---|---|---|
| Quadrant | BADHDUFLAG | Total packets | Discarded packets |
| A | 0 | 12560 | 3 |
| B | 0 | 12454 | 2 |
| C | 0 | 13072 | 2 |
| D | 0 | 13083 | 2 |
| Mode SS | |||
|---|---|---|---|
| Quadrant | BADHDUFLAG | Total packets | Discarded packets |
| A | 0 | 118 | 0 |
| B | 0 | 118 | 0 |
| C | 0 | 118 | 0 |
| D | 0 | 118 | 0 |
| Mode M9 | |||
|---|---|---|---|
| Quadrant | BADHDUFLAG | Total packets | Discarded packets |
| A | 0 | 39 | 0 |
| B | 0 | 39 | 0 |
| C | 0 | 39 | 0 |
| D | 0 | 39 | 0 |
| Quadrant | Total seconds | Saturated seconds | Saturation percentage |
|---|---|---|---|
| A | 5634 | 24 | 0.425985% |
| B | 5634 | 109 | 1.934682% |
| C | 5634 | 109 | 1.934682% |
| D | 5634 | 95 | 1.686191% |
Noise dominated data is calculated using 1-second bins in cleaned event files. If a bin has >2000 counts, and if more than 50% of those come from <1% of pixels, then it is considered to be noise-dominated and hence unusable.
| Quadrant | # 1 sec bins | Bins with >0 counts | Bins with >2000 counts | High rate bins dominated by noise | Noise dominated (total time) | Noise dominated (detector-on time) | Marked lightcurve |
|---|---|---|---|---|---|---|---|
| A | 9579 | 5636 | 13 | 13 | 0.14% | 0.23% | 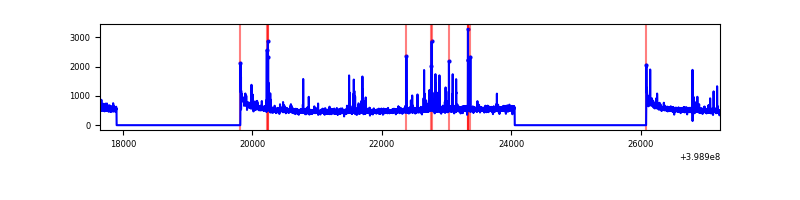 |
| B | 9579 | 5636 | 54 | 54 | 0.56% | 0.96% | 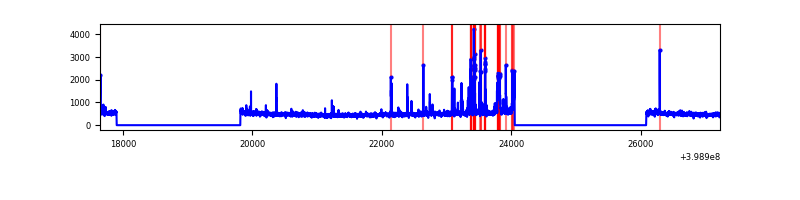 |
| C | 9579 | 5636 | 90 | 90 | 0.94% | 1.60% | 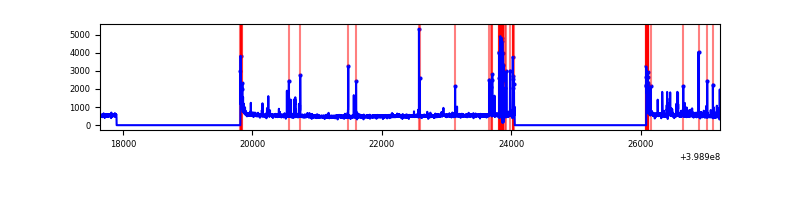 |
| D | 9579 | 5636 | 63 | 63 | 0.66% | 1.12% | 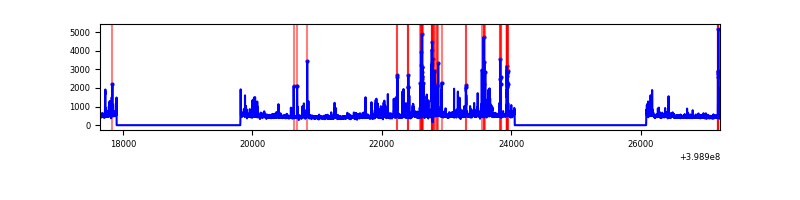 |
Top three noisy pixels from each quadrant. If the there are fewer than three noisy pixels in the level2.evt file, extra rows are filled as -1
| Pixel properties | Quadrant properties | ||||||
|---|---|---|---|---|---|---|---|
| Quadrant | DetID | PixID | Counts | Sigma | Mean | Median | Sigma |
| A | 10 | 83 | 279452 | 2042.7 | 689 | 678 | 136.5 |
| A | 13 | 248 | 63941 | 463.56 | 689 | 678 | 136.5 |
| A | 9 | 143 | 45242 | 326.54 | 689 | 678 | 136.5 |
| B | 5 | 172 | 245430 | 1895.69 | 684 | 668 | 129.1 |
| B | 5 | 200 | 20519 | 153.75 | 684 | 668 | 129.1 |
| B | 0 | 190 | 20310 | 152.13 | 684 | 668 | 129.1 |
| C | 1 | 23 | 291421 | 1856.24 | 672 | 678 | 156.6 |
| C | 15 | 214 | 236804 | 1507.54 | 672 | 678 | 156.6 |
| C | 0 | 10 | 116487 | 739.38 | 672 | 678 | 156.6 |
| D | 13 | 249 | 197609 | 1204.4 | 675 | 660 | 163.5 |
| D | 2 | 249 | 122928 | 747.7 | 675 | 660 | 163.5 |
| D | 12 | 128 | 44347 | 267.16 | 675 | 660 | 163.5 |
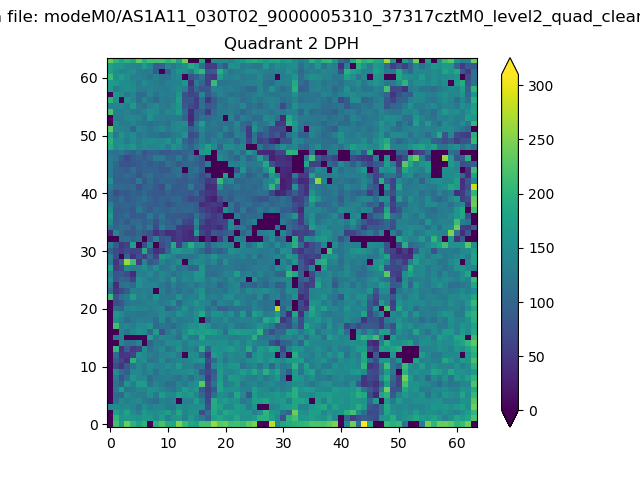
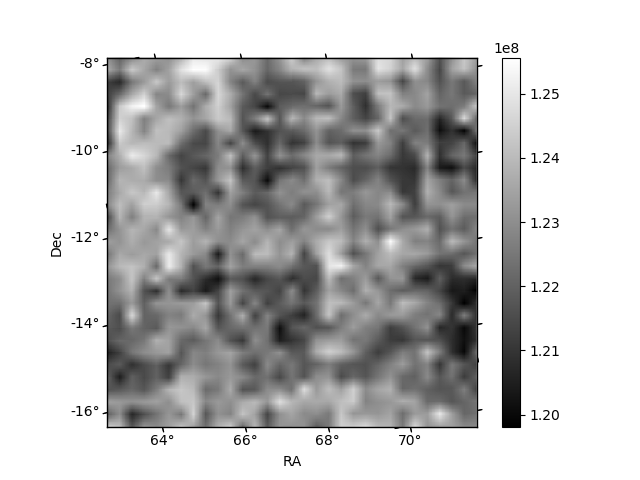
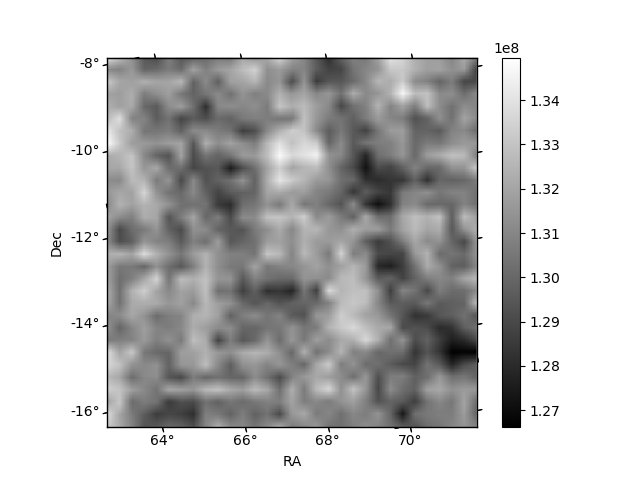
Histogram calculated using DETX and DETY for each event in the final _common_clean file
| Quadrant A | 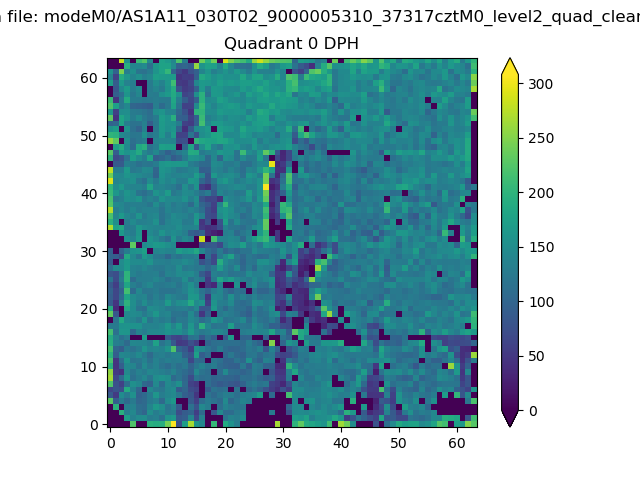 |
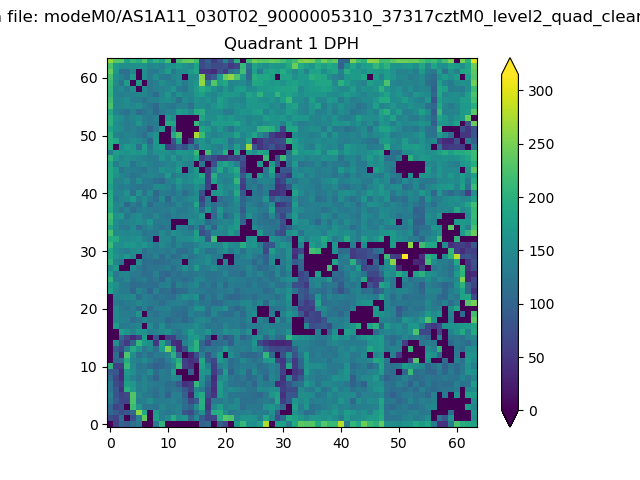 |
Quadrant B |
|---|---|---|---|
| Quadrant D | 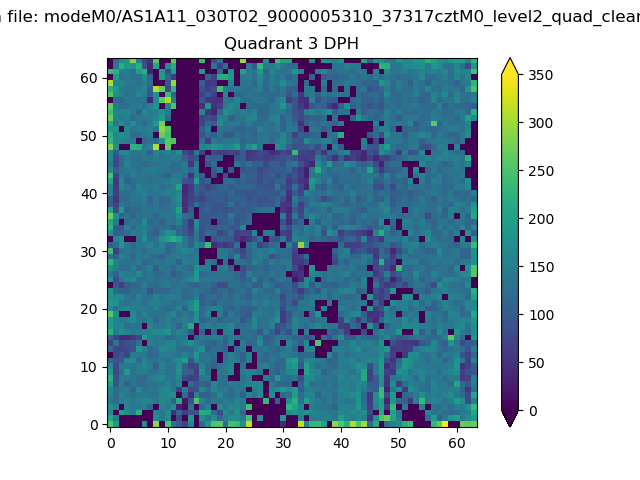 |
 |
Quadrant C |
| Plot type | Count rate plots | Images |
|---|---|---|
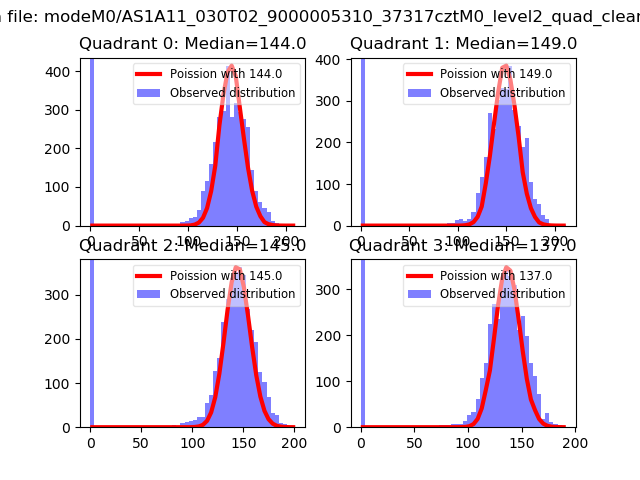
| Comparison with Poisson distribution Blue bars denote a histogram of data divided into 1 sec bins. Red curve is a Poisson curve with rate = median count rate of data. |
 |
 |
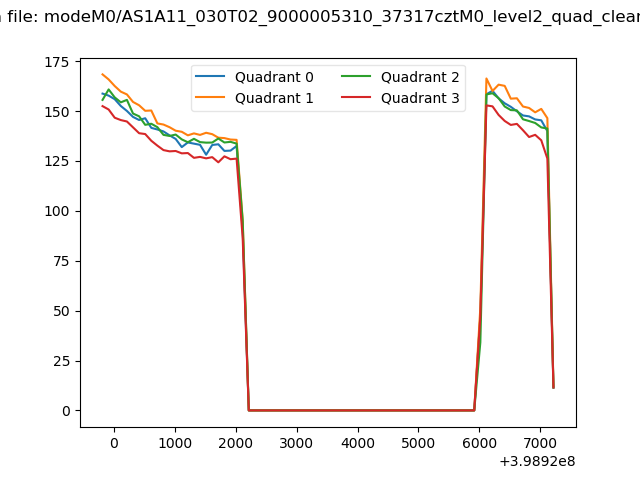
| Quadrant-wise count rates Data is divided into 100 sec bins |
 |
|
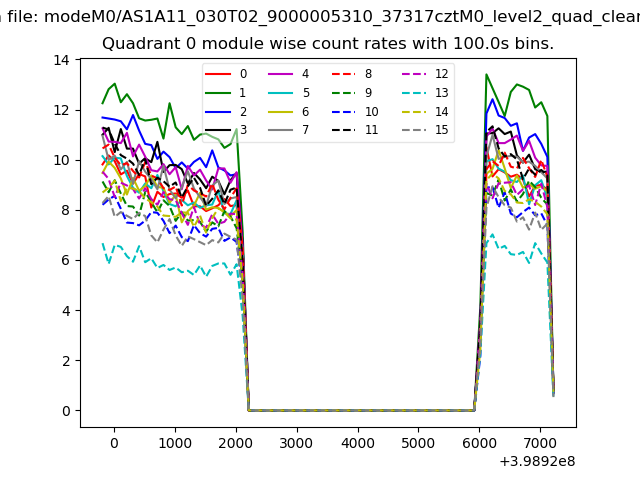
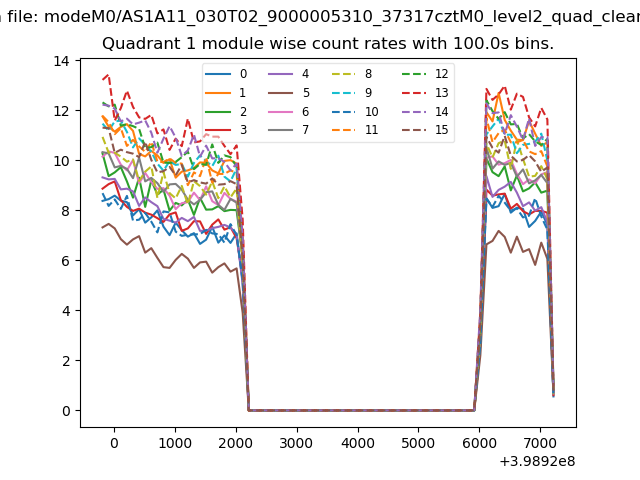
| Module-wise count rates for Quadrant A Data is divided into 100 sec bins |
 |
 |
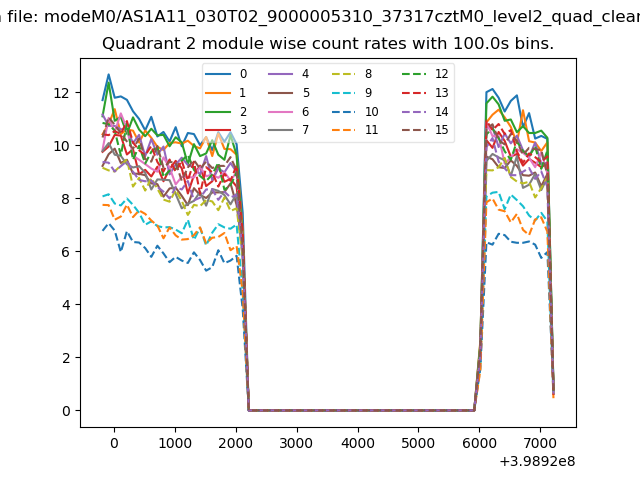
| Module-wise count rates for Quadrant B Data is divided into 100 sec bins |
 |
 |
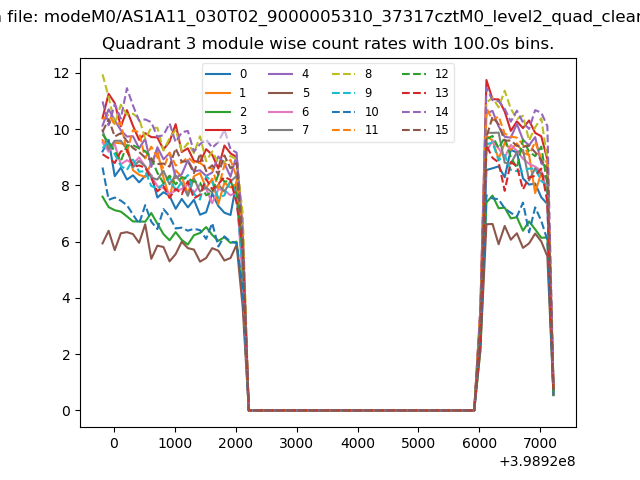
| Module-wise count rates for Quadrant C Data is divided into 100 sec bins |
 |
 |
| Module-wise count rates for Quadrant D Data is divided into 100 sec bins |
 |
 |
| Parameter | Plot |
|---|---|
| CZT HV Monitor | 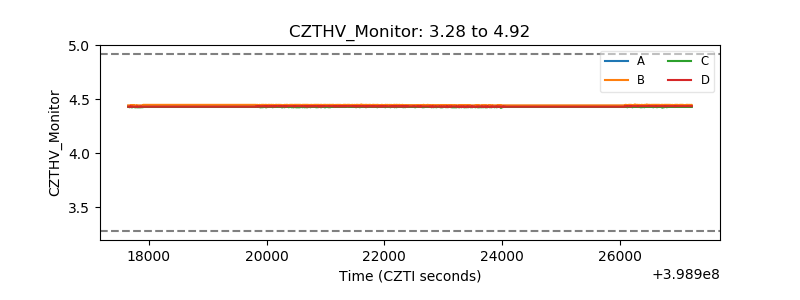 |
| D_VDD | 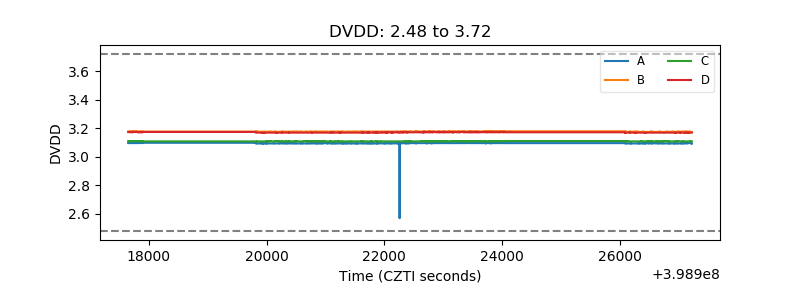 |
| Temperature 1 | 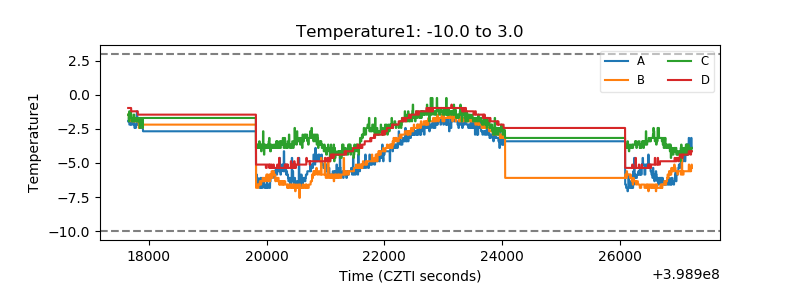 |
| Veto HV Monitor | 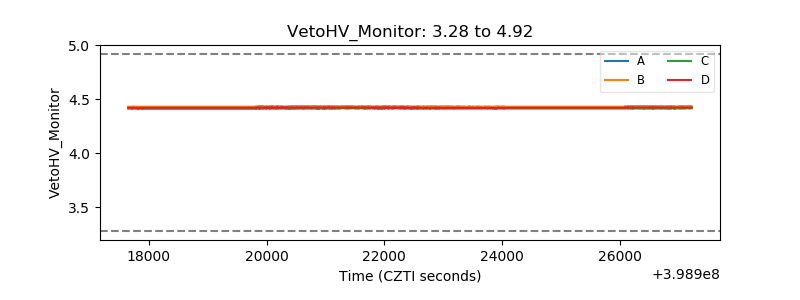 |
| Veto LLD | 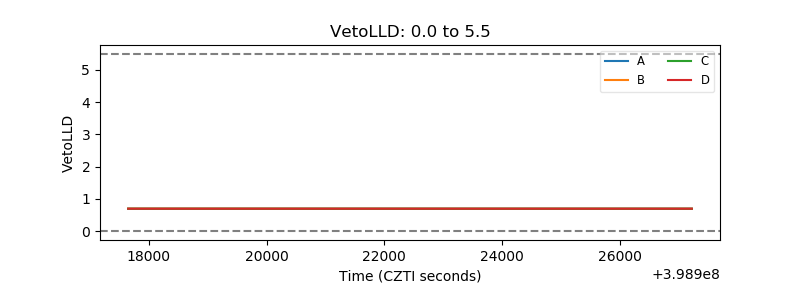 |
| Alpha Counter | 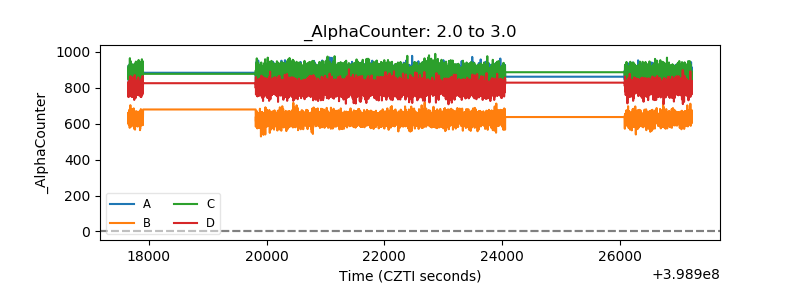 |
| _CPM_Rate | 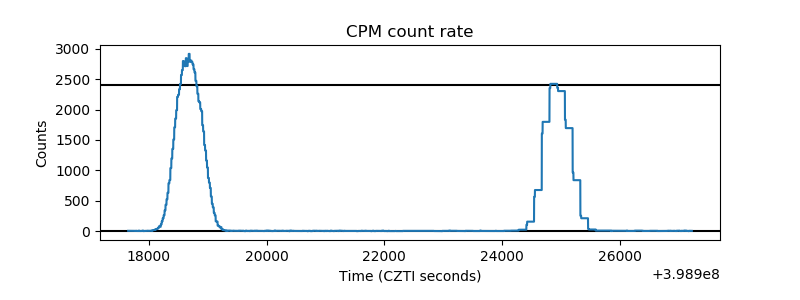 |
| CZT Counter | 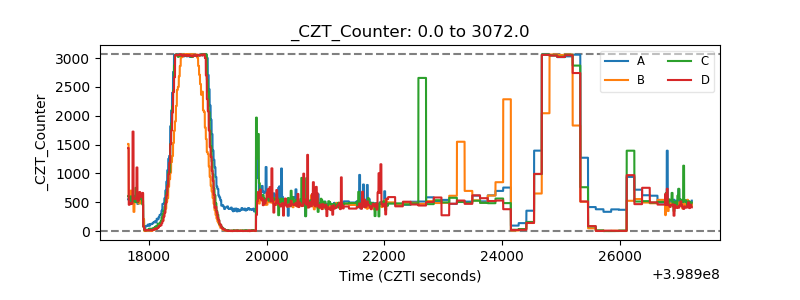 |
| +2.5 Volts monitor | 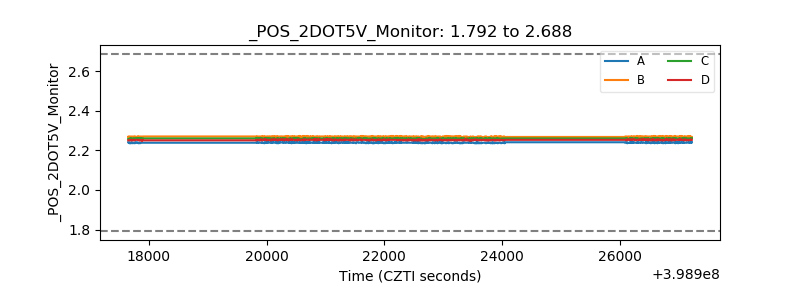 |
| +5 Volts monitor | 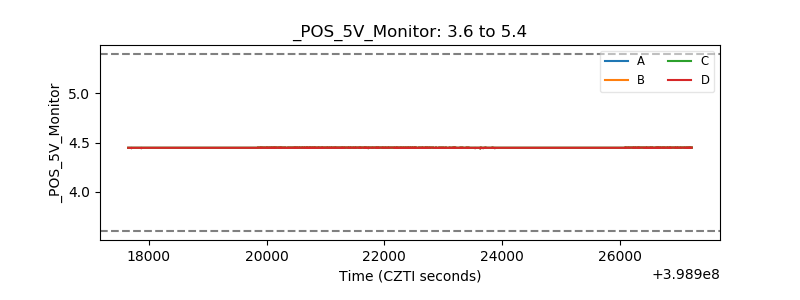 |
| _ROLL_ROT | 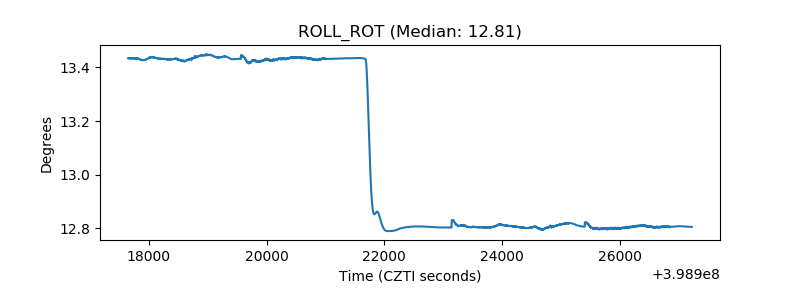 |
| _Roll_DEC | 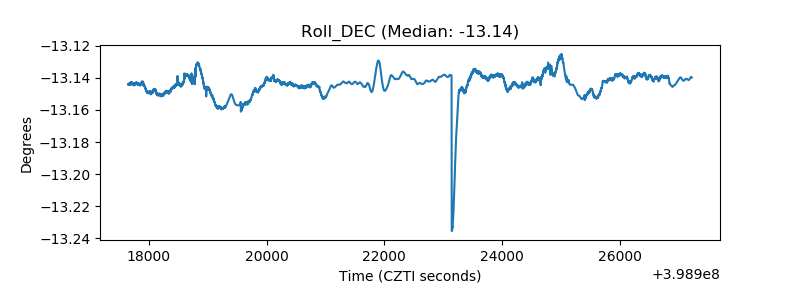 |
| _Roll_RA | 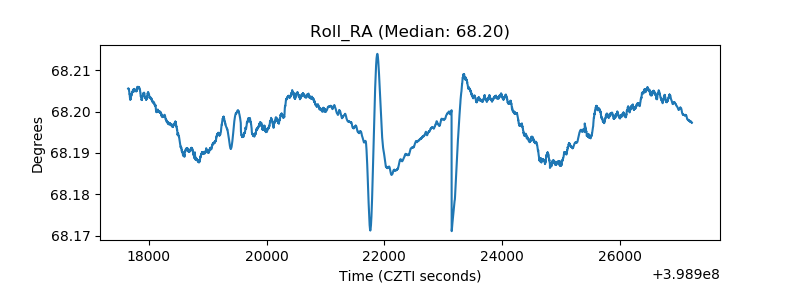 |
| Veto Counter | 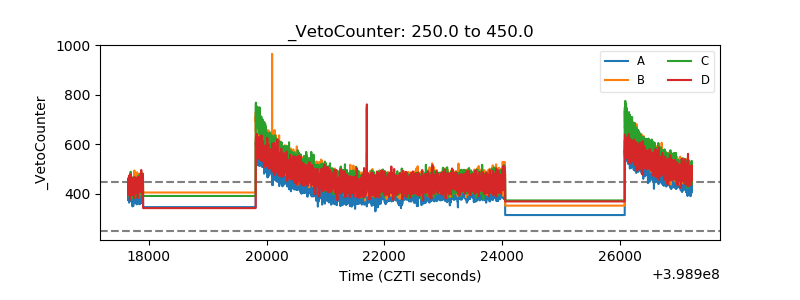 |