| Param | Original file | Final file |
|---|---|---|
| Filename | modeM0/AS1A11_030T02_9000005310_37318cztM0_level2.evt | modeM0/AS1A11_030T02_9000005310_37318cztM0_level2_quad_clean.evt |
| Size (bytes) | 456,197,760 | 71,337,600 |
| Size | 435.1 MB | 68.0 MB |
| Events in quadrant A | 2,901,996 | 452,731 |
| Events in quadrant B | 3,192,337 | 466,748 |
| Events in quadrant C | 4,595,647 | 439,241 |
| Events in quadrant D | 2,763,855 | 427,923 |
| Mode M0 | |||
|---|---|---|---|
| Quadrant | BADHDUFLAG | Total packets | Discarded packets |
| A | 0 | 11651 | 3 |
| B | 0 | 12693 | 2 |
| C | 0 | 16944 | 2 |
| D | 0 | 11577 | 2 |
| Mode SS | |||
|---|---|---|---|
| Quadrant | BADHDUFLAG | Total packets | Discarded packets |
| A | 0 | 110 | 0 |
| B | 0 | 110 | 0 |
| C | 0 | 110 | 0 |
| D | 0 | 110 | 0 |
| Mode M9 | |||
|---|---|---|---|
| Quadrant | BADHDUFLAG | Total packets | Discarded packets |
| A | 0 | 31 | 0 |
| B | 0 | 31 | 0 |
| C | 0 | 31 | 0 |
| D | 0 | 32 | 0 |
| Quadrant | Total seconds | Saturated seconds | Saturation percentage |
|---|---|---|---|
| A | 5327 | 12 | 0.225268% |
| B | 5327 | 213 | 3.998498% |
| C | 5327 | 527 | 9.892998% |
| D | 5327 | 63 | 1.182654% |
Noise dominated data is calculated using 1-second bins in cleaned event files. If a bin has >2000 counts, and if more than 50% of those come from <1% of pixels, then it is considered to be noise-dominated and hence unusable.
| Quadrant | # 1 sec bins | Bins with >0 counts | Bins with >2000 counts | High rate bins dominated by noise | Noise dominated (total time) | Noise dominated (detector-on time) | Marked lightcurve |
|---|---|---|---|---|---|---|---|
| A | 7450 | 5328 | 5 | 5 | 0.07% | 0.09% | 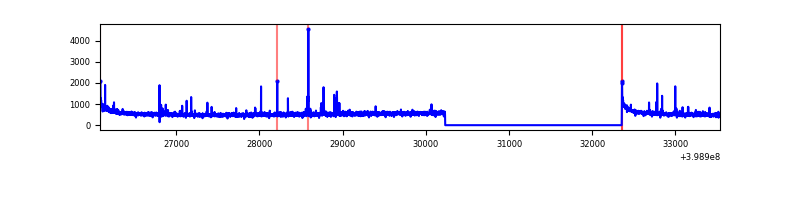 |
| B | 7450 | 5328 | 148 | 148 | 1.99% | 2.78% | 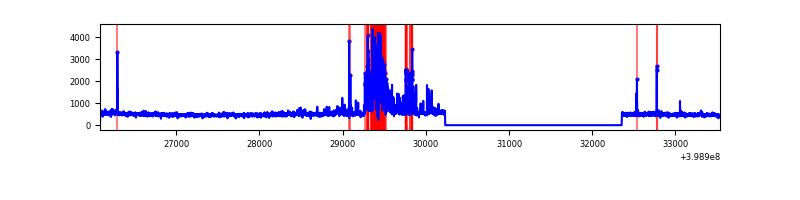 |
| C | 7450 | 5328 | 458 | 458 | 6.15% | 8.60% | 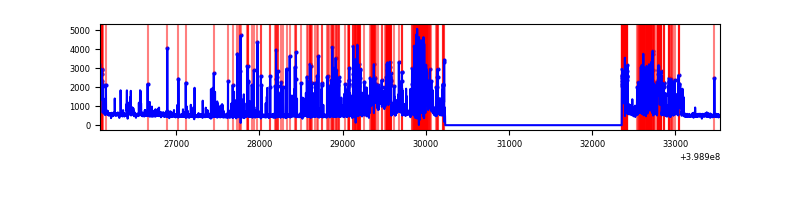 |
| D | 7450 | 5328 | 29 | 29 | 0.39% | 0.54% | 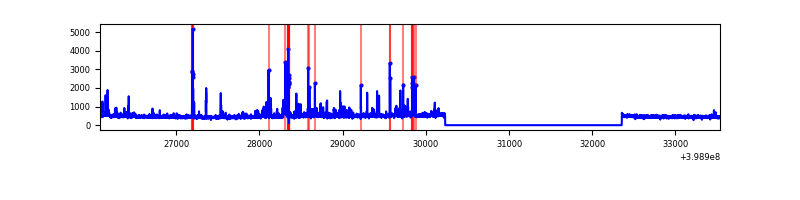 |
Top three noisy pixels from each quadrant. If the there are fewer than three noisy pixels in the level2.evt file, extra rows are filled as -1
| Pixel properties | Quadrant properties | ||||||
|---|---|---|---|---|---|---|---|
| Quadrant | DetID | PixID | Counts | Sigma | Mean | Median | Sigma |
| A | 10 | 83 | 276668 | 2110.37 | 657 | 646 | 130.8 |
| A | 13 | 248 | 22917 | 170.28 | 657 | 646 | 130.8 |
| A | 9 | 143 | 19414 | 143.49 | 657 | 646 | 130.8 |
| B | 5 | 172 | 536203 | 4409.83 | 638 | 623 | 121.5 |
| B | 0 | 190 | 66668 | 543.8 | 638 | 623 | 121.5 |
| B | 12 | 18 | 56755 | 462.18 | 638 | 623 | 121.5 |
| C | 1 | 23 | 1787597 | 12634.72 | 611 | 616 | 141.4 |
| C | 15 | 214 | 220177 | 1552.39 | 611 | 616 | 141.4 |
| C | 0 | 10 | 138217 | 972.9 | 611 | 616 | 141.4 |
| D | 13 | 249 | 133353 | 856.71 | 639 | 625 | 154.9 |
| D | 2 | 249 | 76024 | 486.67 | 639 | 625 | 154.9 |
| D | 2 | 253 | 28498 | 179.91 | 639 | 625 | 154.9 |
Histogram calculated using DETX and DETY for each event in the final _common_clean file
| Quadrant A | 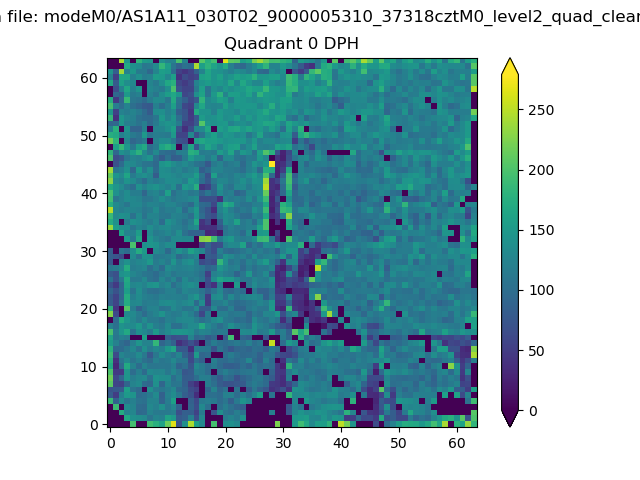 |
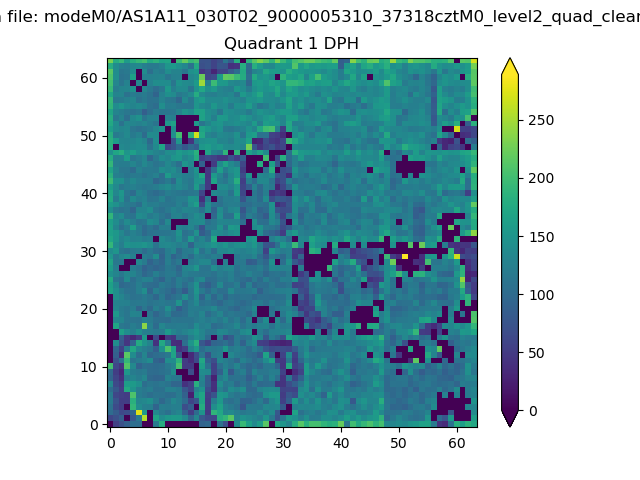 |
Quadrant B |
|---|---|---|---|
| Quadrant D | 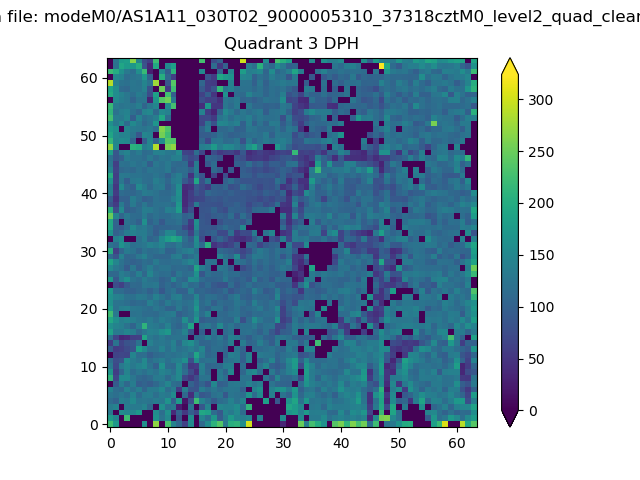 |
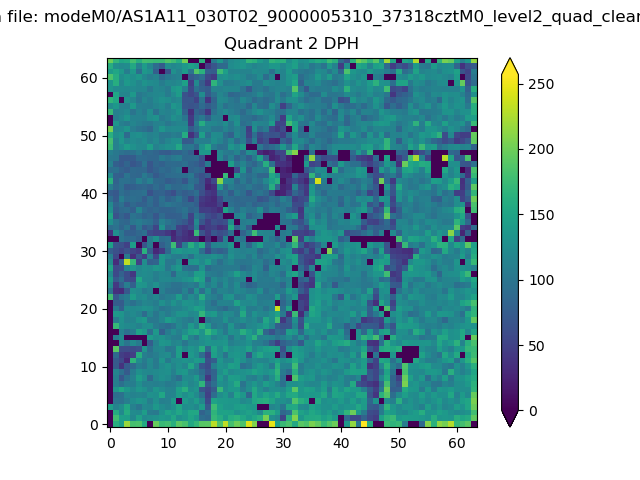 |
Quadrant C |
| Plot type | Count rate plots | Images |
|---|---|---|
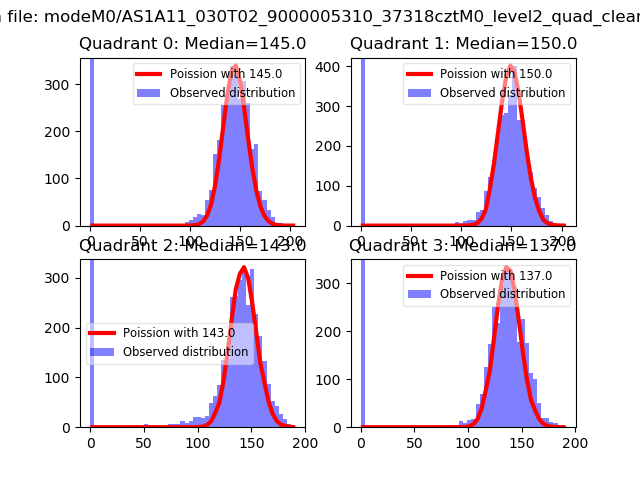
| Comparison with Poisson distribution Blue bars denote a histogram of data divided into 1 sec bins. Red curve is a Poisson curve with rate = median count rate of data. |
 |
 |
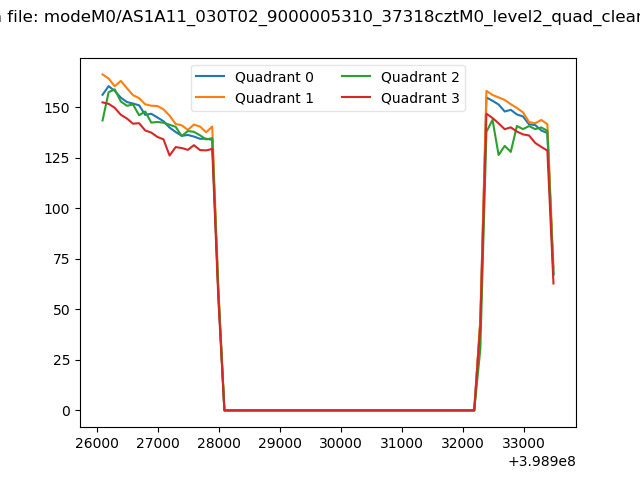
| Quadrant-wise count rates Data is divided into 100 sec bins |
 |
|
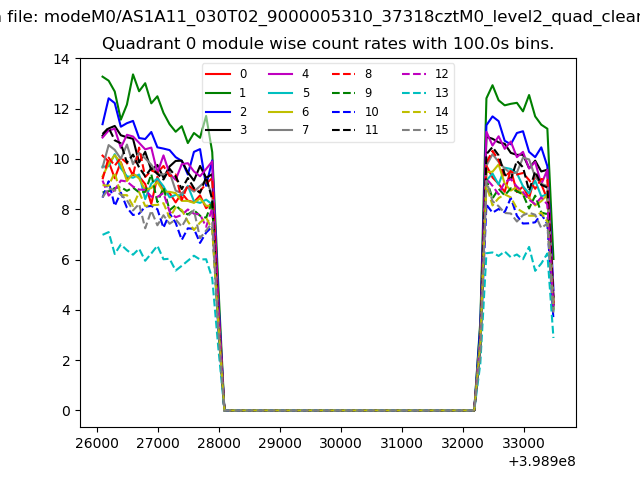
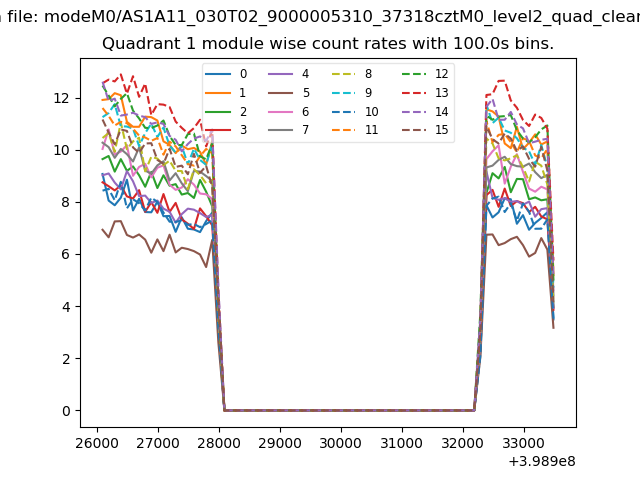
| Module-wise count rates for Quadrant A Data is divided into 100 sec bins |
 |
 |
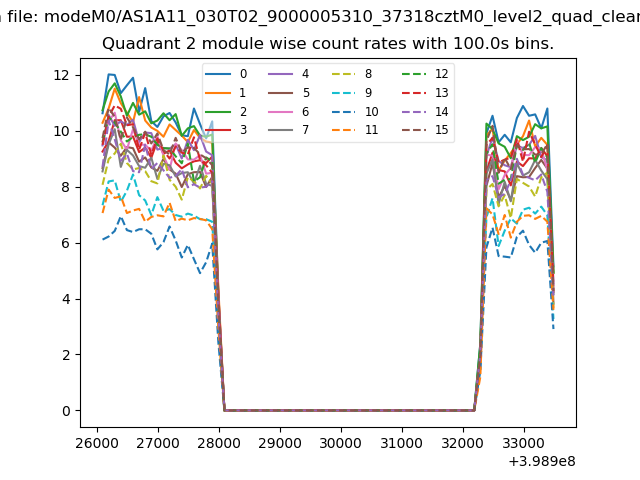
| Module-wise count rates for Quadrant B Data is divided into 100 sec bins |
 |
 |
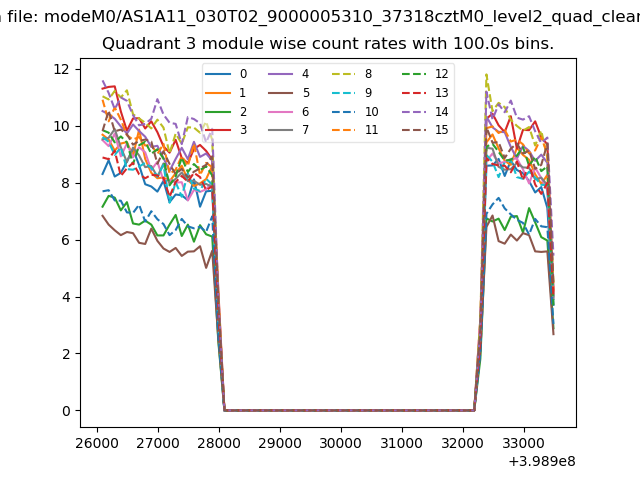
| Module-wise count rates for Quadrant C Data is divided into 100 sec bins |
 |
 |
| Module-wise count rates for Quadrant D Data is divided into 100 sec bins |
 |
 |
| Parameter | Plot |
|---|---|
| CZT HV Monitor | 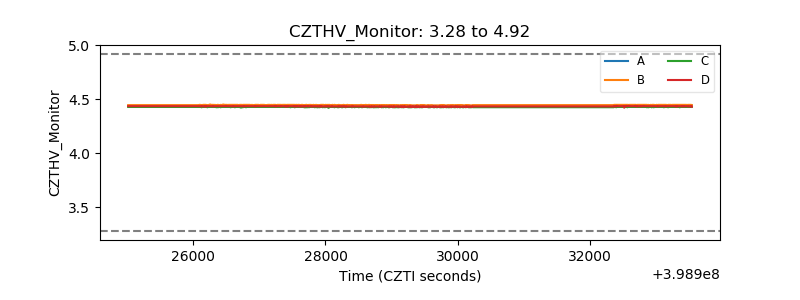 |
| D_VDD | 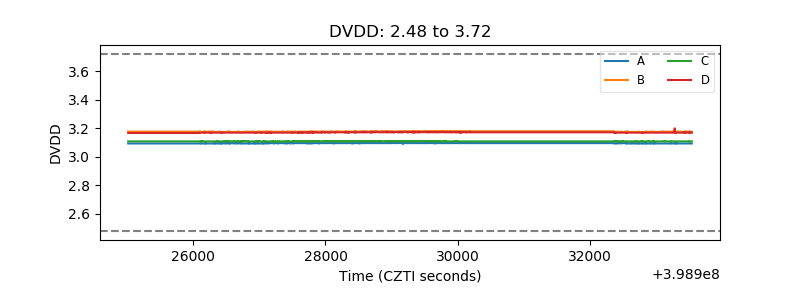 |
| Temperature 1 | 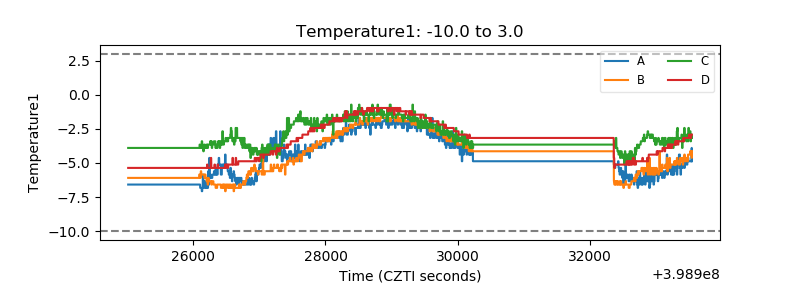 |
| Veto HV Monitor |  |
| Veto LLD | 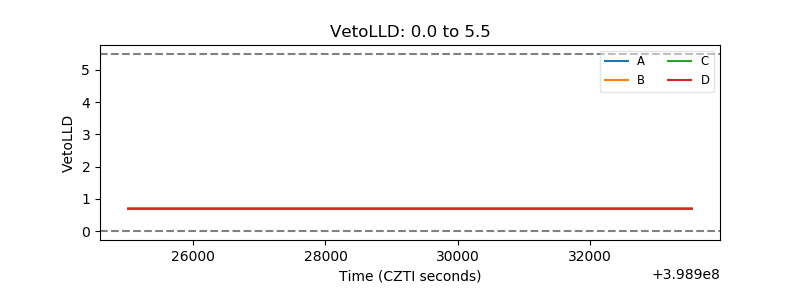 |
| Alpha Counter | 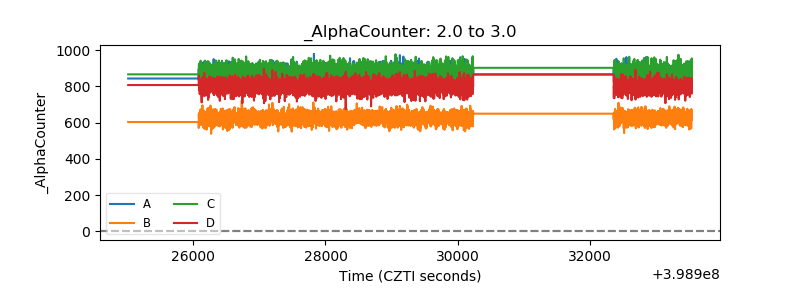 |
| _CPM_Rate | 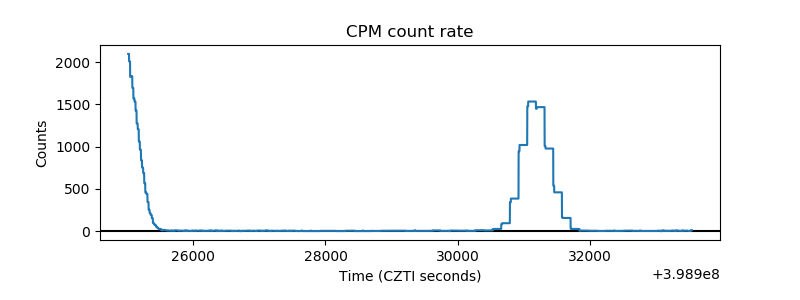 |
| CZT Counter | 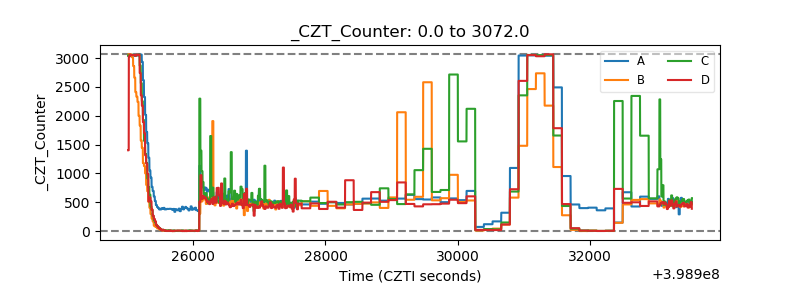 |
| +2.5 Volts monitor | 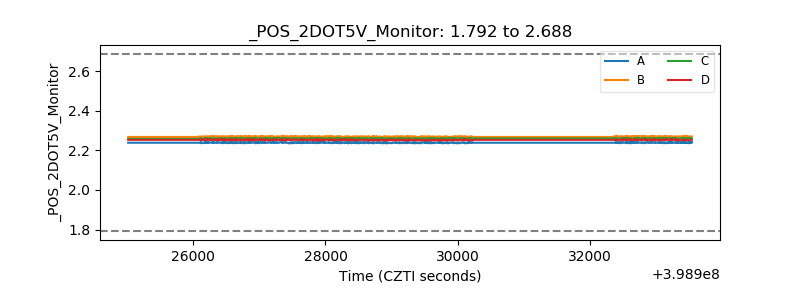 |
| +5 Volts monitor | 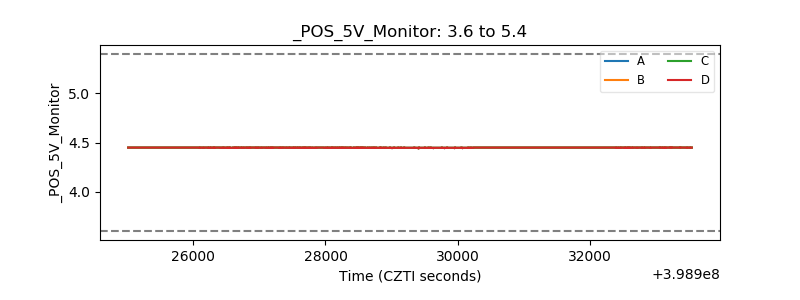 |
| _ROLL_ROT | 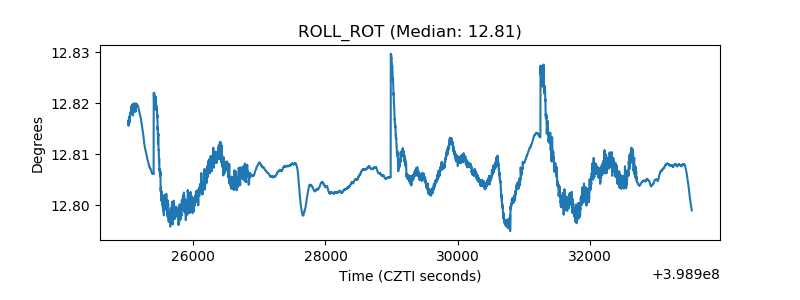 |
| _Roll_DEC | 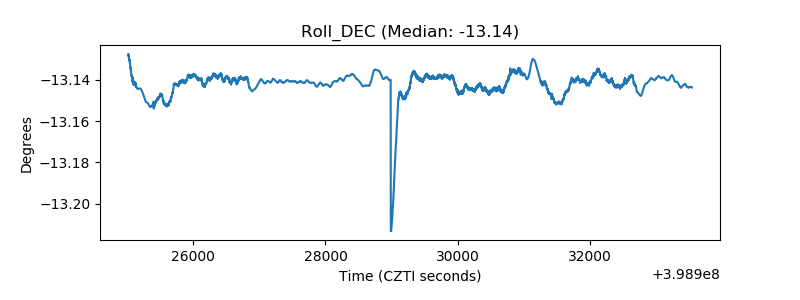 |
| _Roll_RA | 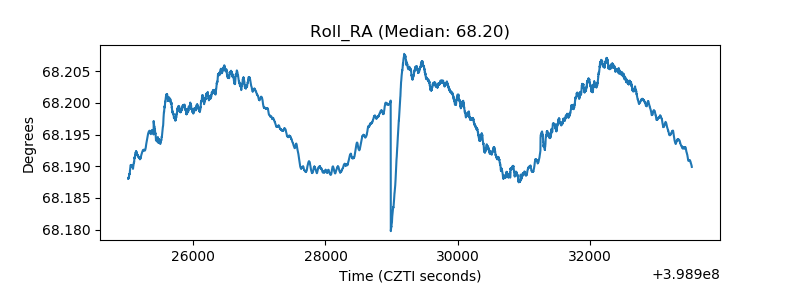 |
| Veto Counter | 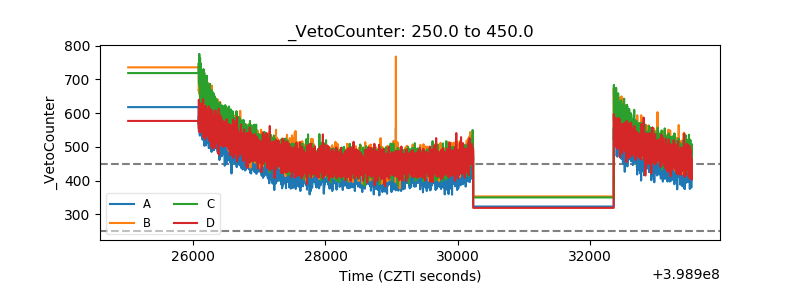 |