| Param | Original file | Final file |
|---|---|---|
| Filename | modeM0/AS1A11_030T02_9000005310_37319cztM0_level2.evt | modeM0/AS1A11_030T02_9000005310_37319cztM0_level2_quad_clean.evt |
| Size (bytes) | 420,563,520 | 62,631,360 |
| Size | 401.1 MB | 59.7 MB |
| Events in quadrant A | 3,033,658 | 388,297 |
| Events in quadrant B | 2,778,154 | 398,338 |
| Events in quadrant C | 3,675,507 | 376,608 |
| Events in quadrant D | 2,894,744 | 367,220 |
| Mode M0 | |||
|---|---|---|---|
| Quadrant | BADHDUFLAG | Total packets | Discarded packets |
| A | 0 | 12081 | 2 |
| B | 0 | 11395 | 1 |
| C | 0 | 14086 | 1 |
| D | 0 | 11978 | 1 |
| Mode SS | |||
|---|---|---|---|
| Quadrant | BADHDUFLAG | Total packets | Discarded packets |
| A | 0 | 106 | 0 |
| B | 0 | 106 | 0 |
| C | 0 | 106 | 0 |
| D | 0 | 106 | 0 |
| Mode M9 | |||
|---|---|---|---|
| Quadrant | BADHDUFLAG | Total packets | Discarded packets |
| A | 0 | 22 | 0 |
| B | 0 | 22 | 0 |
| C | 0 | 22 | 0 |
| D | 0 | 22 | 0 |
| Quadrant | Total seconds | Saturated seconds | Saturation percentage |
|---|---|---|---|
| A | 5223 | 79 | 1.512541% |
| B | 5223 | 24 | 0.459506% |
| C | 5223 | 178 | 3.408003% |
| D | 5223 | 66 | 1.263642% |
Noise dominated data is calculated using 1-second bins in cleaned event files. If a bin has >2000 counts, and if more than 50% of those come from <1% of pixels, then it is considered to be noise-dominated and hence unusable.
| Quadrant | # 1 sec bins | Bins with >0 counts | Bins with >2000 counts | High rate bins dominated by noise | Noise dominated (total time) | Noise dominated (detector-on time) | Marked lightcurve |
|---|---|---|---|---|---|---|---|
| A | 7375 | 5224 | 51 | 51 | 0.69% | 0.98% | 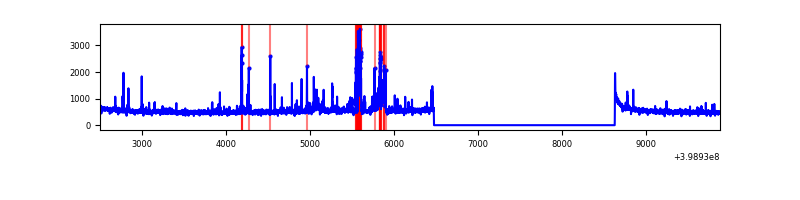 |
| B | 7375 | 5224 | 12 | 12 | 0.16% | 0.23% | 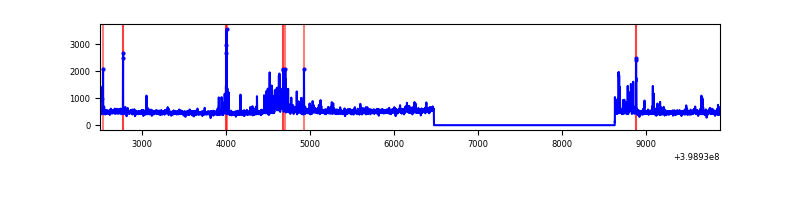 |
| C | 7375 | 5224 | 171 | 171 | 2.32% | 3.27% | 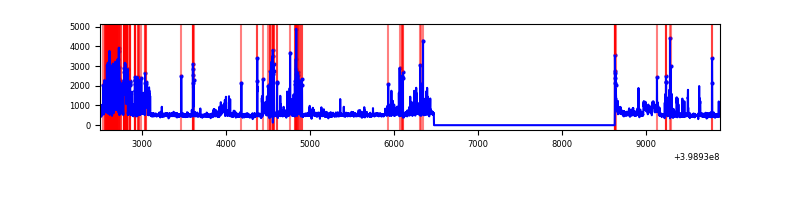 |
| D | 7375 | 5224 | 54 | 54 | 0.73% | 1.03% | 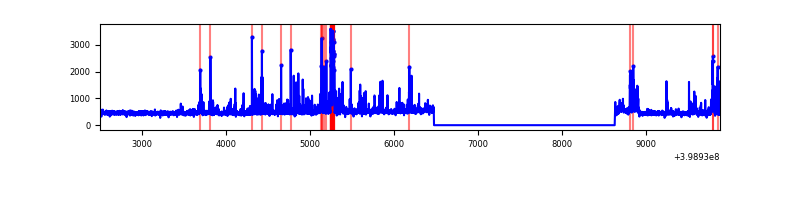 |
Top three noisy pixels from each quadrant. If the there are fewer than three noisy pixels in the level2.evt file, extra rows are filled as -1
| Pixel properties | Quadrant properties | ||||||
|---|---|---|---|---|---|---|---|
| Quadrant | DetID | PixID | Counts | Sigma | Mean | Median | Sigma |
| A | 15 | 237 | 231228 | 1819.9 | 632 | 621 | 126.7 |
| A | 10 | 83 | 226093 | 1779.38 | 632 | 621 | 126.7 |
| A | 13 | 248 | 43809 | 340.83 | 632 | 621 | 126.7 |
| B | 5 | 172 | 111268 | 924.22 | 626 | 610 | 119.7 |
| B | 12 | 18 | 108531 | 901.36 | 626 | 610 | 119.7 |
| B | 0 | 190 | 70656 | 585.03 | 626 | 610 | 119.7 |
| C | 1 | 23 | 1036008 | 7412.45 | 605 | 612 | 139.7 |
| C | 15 | 214 | 218011 | 1556.37 | 605 | 612 | 139.7 |
| C | 0 | 10 | 40427 | 285.04 | 605 | 612 | 139.7 |
| D | 10 | 253 | 110702 | 729.36 | 616 | 599 | 151.0 |
| D | 4 | 239 | 108726 | 716.27 | 616 | 599 | 151.0 |
| D | 2 | 249 | 104905 | 690.96 | 616 | 599 | 151.0 |
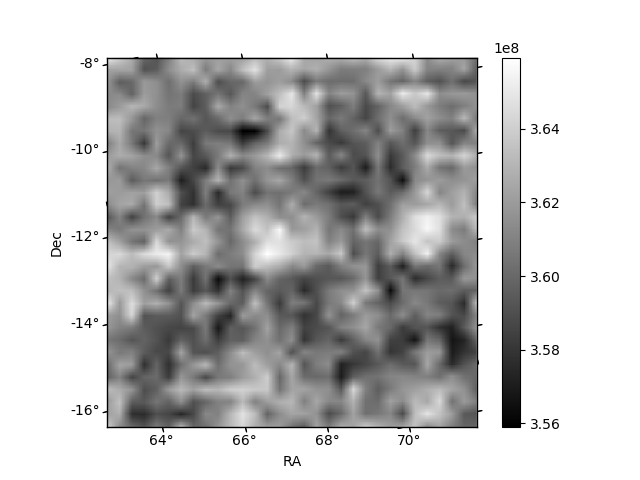
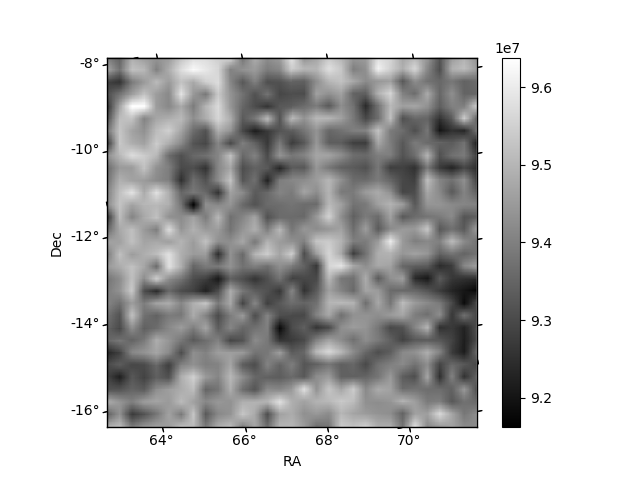
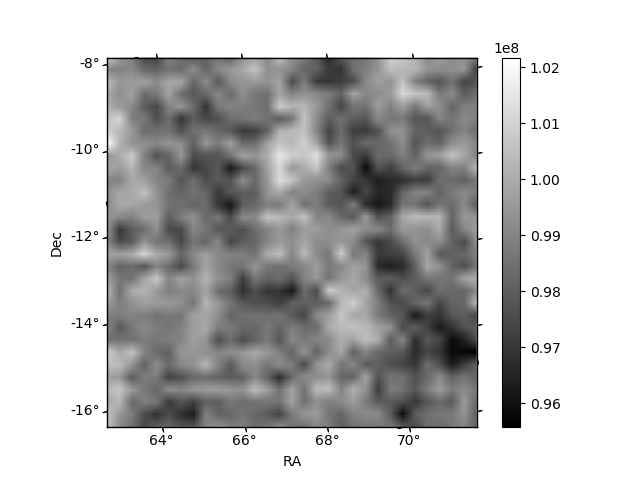
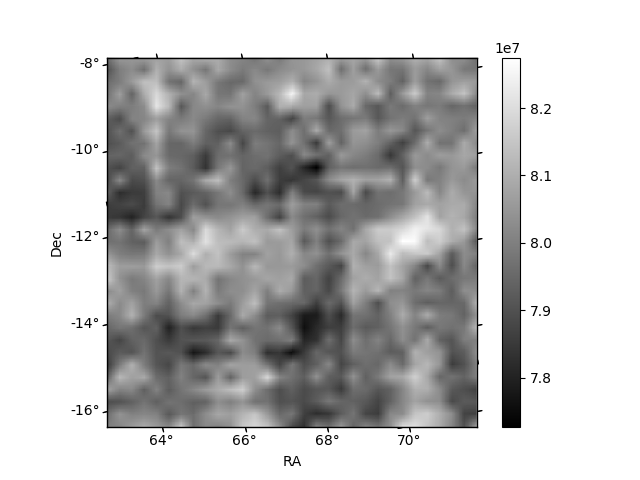
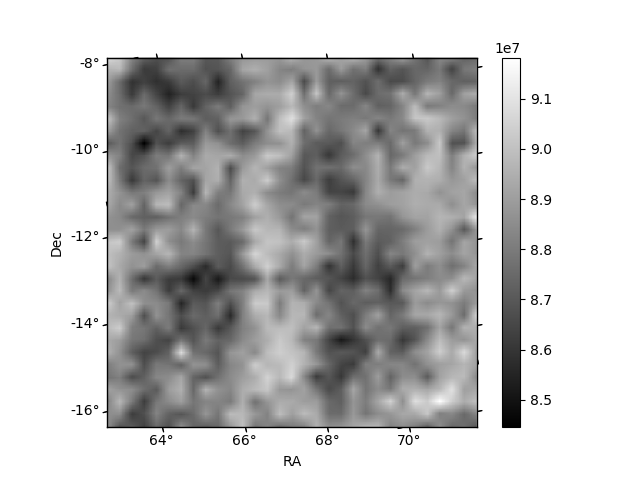
Histogram calculated using DETX and DETY for each event in the final _common_clean file
| Quadrant A | 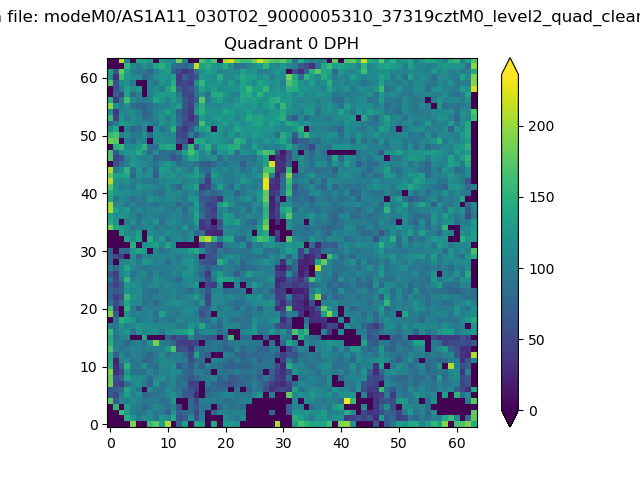 |
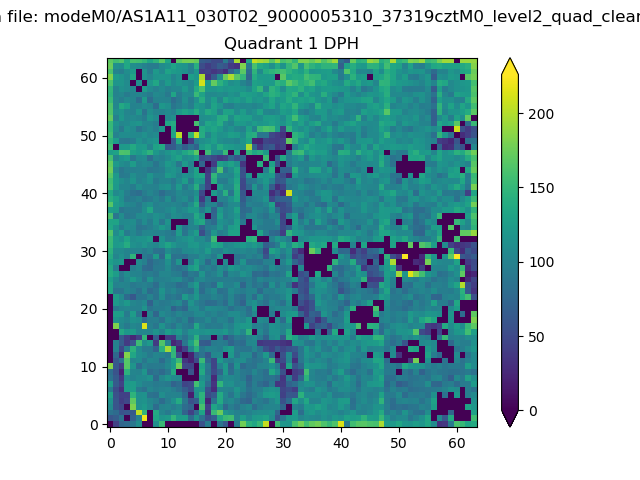 |
Quadrant B |
|---|---|---|---|
| Quadrant D | 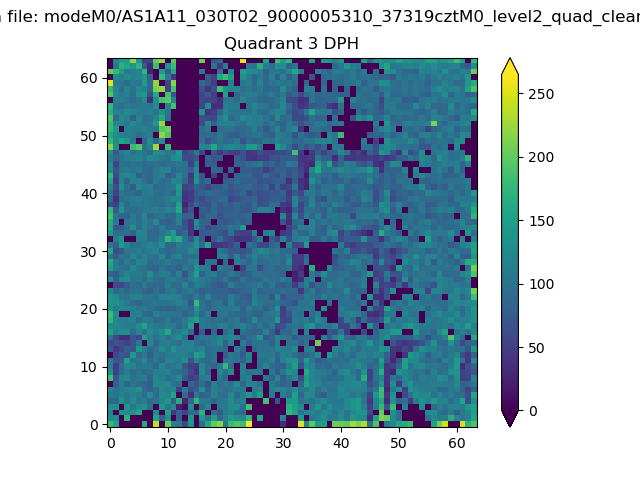 |
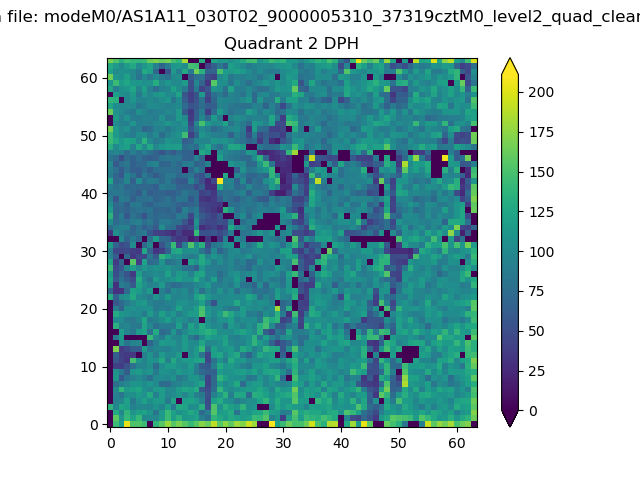 |
Quadrant C |
| Plot type | Count rate plots | Images |
|---|---|---|
| Comparison with Poisson distribution Blue bars denote a histogram of data divided into 1 sec bins. Red curve is a Poisson curve with rate = median count rate of data. |
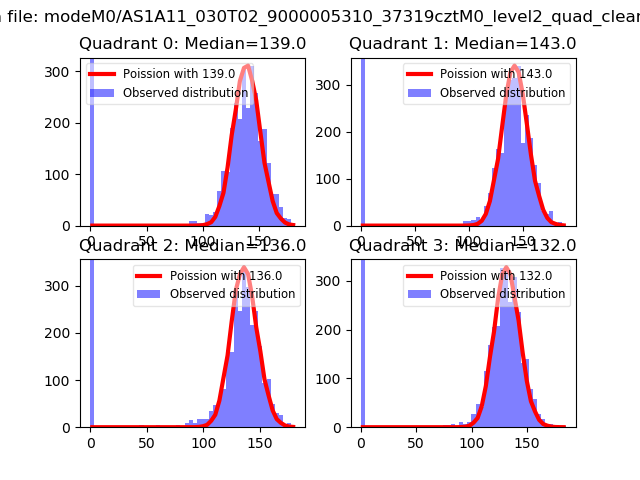 |
 |
| Quadrant-wise count rates Data is divided into 100 sec bins |
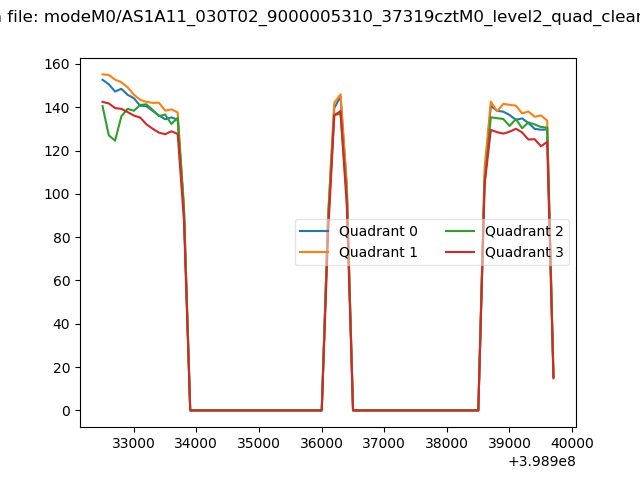 |
|
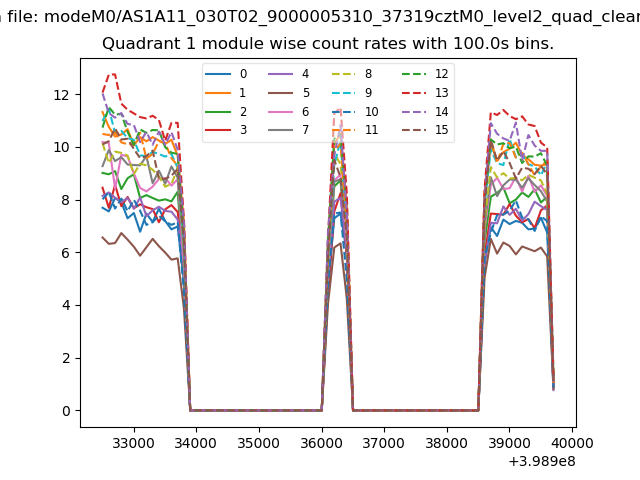
| Module-wise count rates for Quadrant A Data is divided into 100 sec bins |
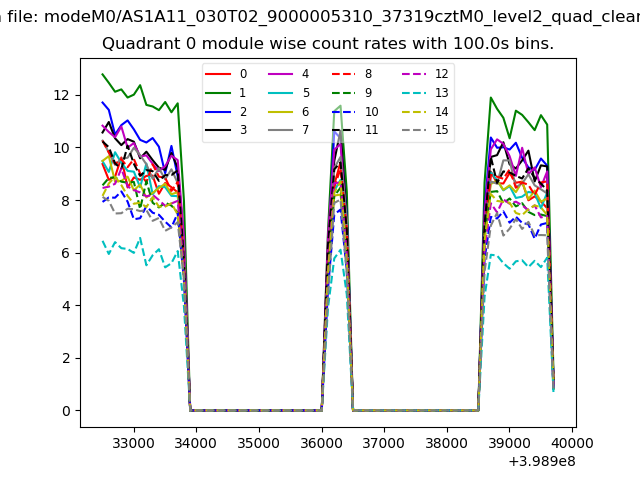 |
 |
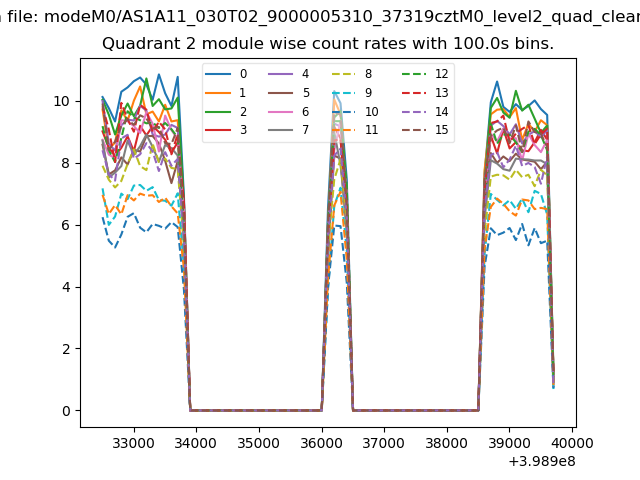
| Module-wise count rates for Quadrant B Data is divided into 100 sec bins |
 |
 |
| Module-wise count rates for Quadrant C Data is divided into 100 sec bins |
 |
 |
| Module-wise count rates for Quadrant D Data is divided into 100 sec bins |
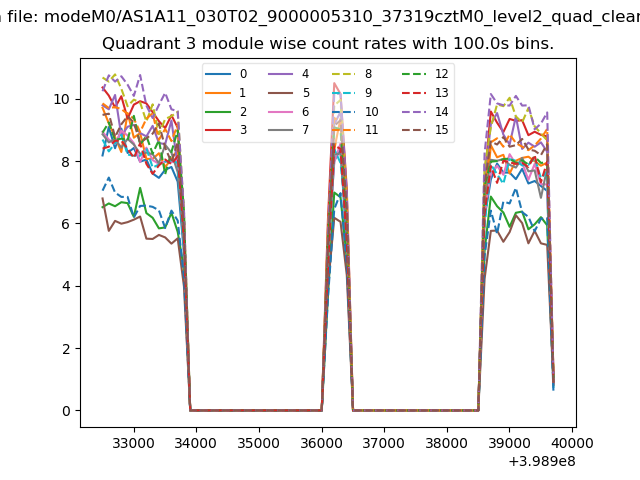 |
 |
| Parameter | Plot |
|---|---|
| CZT HV Monitor | 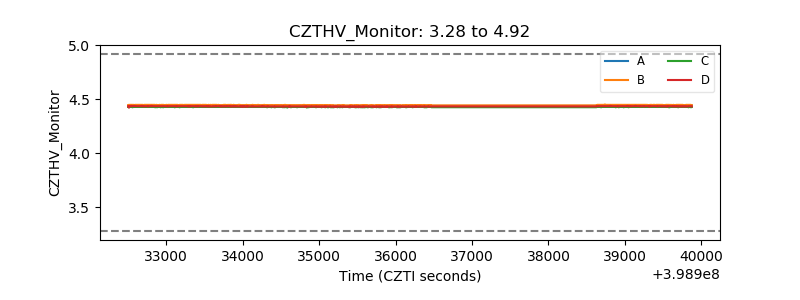 |
| D_VDD | 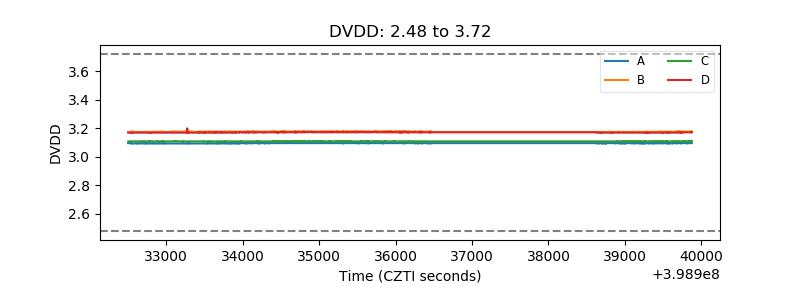 |
| Temperature 1 | 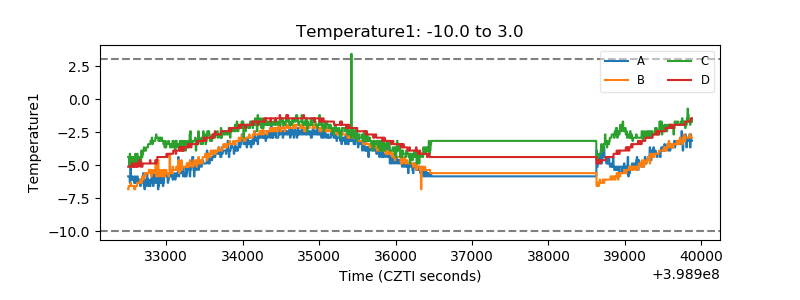 |
| Veto HV Monitor | 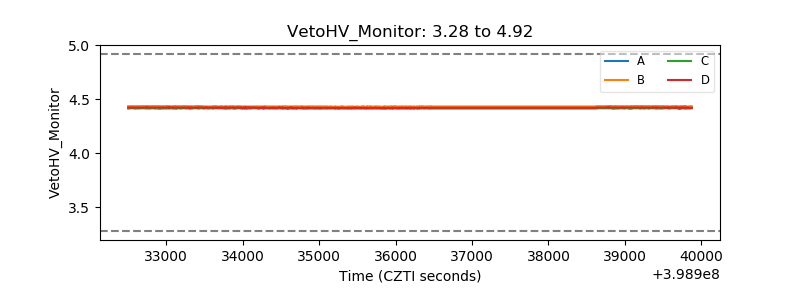 |
| Veto LLD | 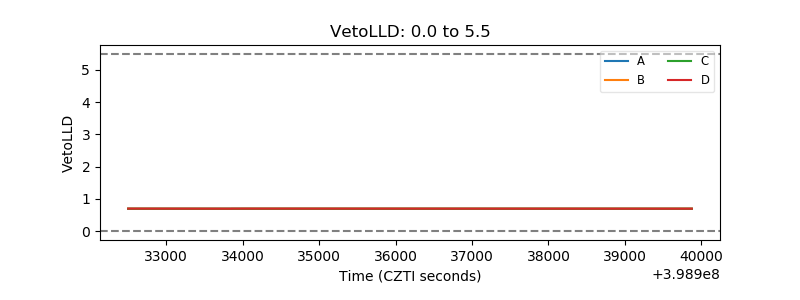 |
| Alpha Counter | 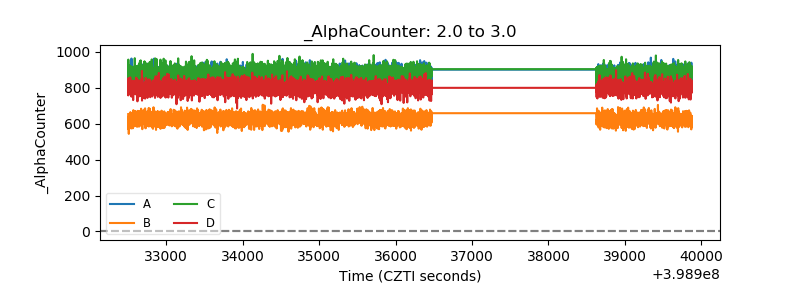 |
| _CPM_Rate | 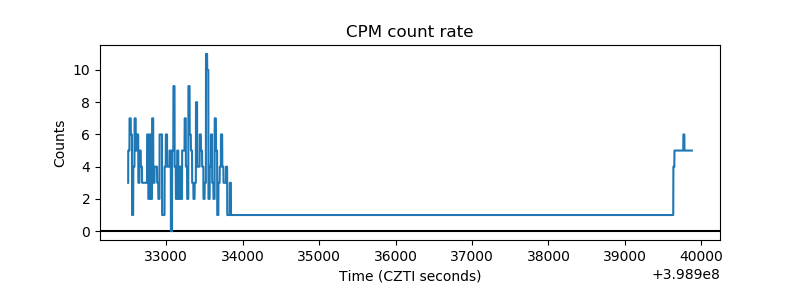 |
| CZT Counter | 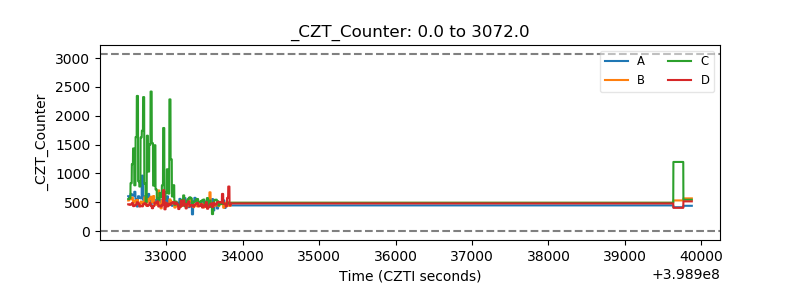 |
| +2.5 Volts monitor | 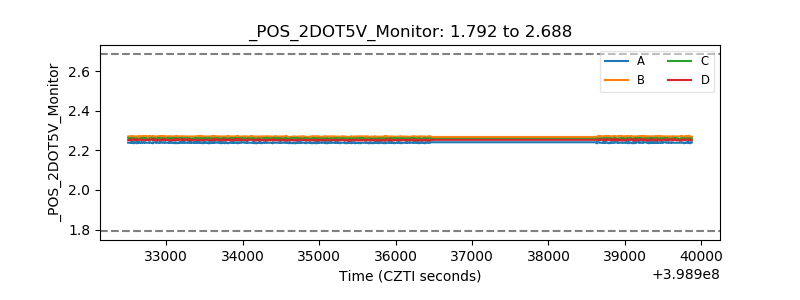 |
| +5 Volts monitor | 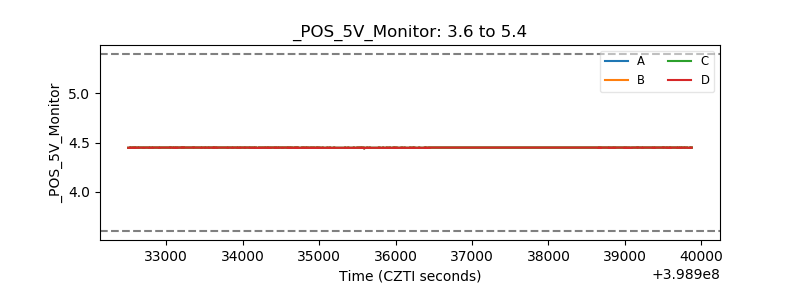 |
| _ROLL_ROT | 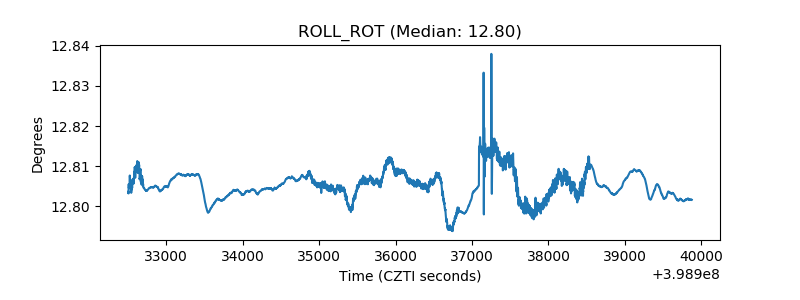 |
| _Roll_DEC |  |
| _Roll_RA | 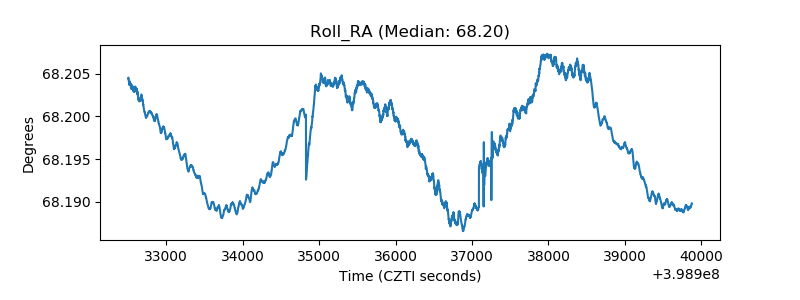 |
| Veto Counter | 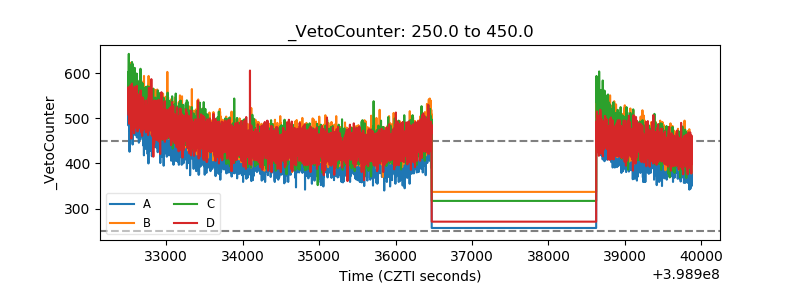 |