| Param | Original file | Final file |
|---|---|---|
| Filename | modeM0/AS1A11_030T02_9000005310_37321cztM0_level2.evt | modeM0/AS1A11_030T02_9000005310_37321cztM0_level2_quad_clean.evt |
| Size (bytes) | 422,709,120 | 53,804,160 |
| Size | 403.1 MB | 51.3 MB |
| Events in quadrant A | 2,997,112 | 318,660 |
| Events in quadrant B | 2,912,093 | 319,903 |
| Events in quadrant C | 3,573,197 | 309,016 |
| Events in quadrant D | 2,949,651 | 300,332 |
| Mode M0 | |||
|---|---|---|---|
| Quadrant | BADHDUFLAG | Total packets | Discarded packets |
| A | 0 | 12104 | 3 |
| B | 0 | 12015 | 2 |
| C | 0 | 13762 | 2 |
| D | 0 | 12373 | 2 |
| Mode SS | |||
|---|---|---|---|
| Quadrant | BADHDUFLAG | Total packets | Discarded packets |
| A | 0 | 110 | 0 |
| B | 0 | 110 | 0 |
| C | 0 | 110 | 0 |
| D | 0 | 110 | 0 |
| Mode M9 | |||
|---|---|---|---|
| Quadrant | BADHDUFLAG | Total packets | Discarded packets |
| A | 0 | 18 | 0 |
| B | 0 | 18 | 0 |
| C | 0 | 18 | 0 |
| D | 0 | 18 | 0 |
| Quadrant | Total seconds | Saturated seconds | Saturation percentage |
|---|---|---|---|
| A | 5444 | 41 | 0.753123% |
| B | 5444 | 107 | 1.965467% |
| C | 5444 | 250 | 4.592212% |
| D | 5444 | 60 | 1.102131% |
Noise dominated data is calculated using 1-second bins in cleaned event files. If a bin has >2000 counts, and if more than 50% of those come from <1% of pixels, then it is considered to be noise-dominated and hence unusable.
| Quadrant | # 1 sec bins | Bins with >0 counts | Bins with >2000 counts | High rate bins dominated by noise | Noise dominated (total time) | Noise dominated (detector-on time) | Marked lightcurve |
|---|---|---|---|---|---|---|---|
| A | 7238 | 5445 | 22 | 22 | 0.30% | 0.40% | 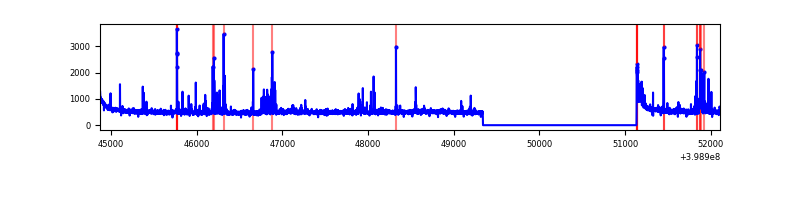 |
| B | 7238 | 5445 | 59 | 59 | 0.82% | 1.08% | 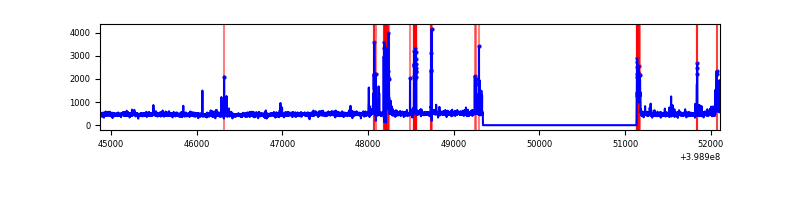 |
| C | 7238 | 5445 | 228 | 228 | 3.15% | 4.19% | 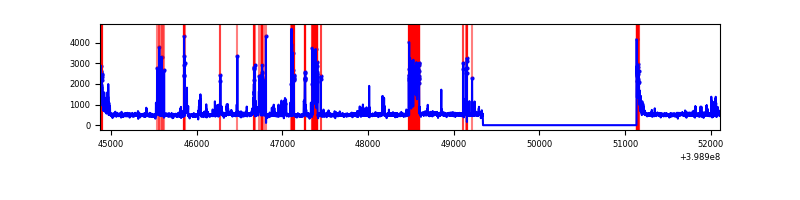 |
| D | 7238 | 5445 | 48 | 48 | 0.66% | 0.88% | 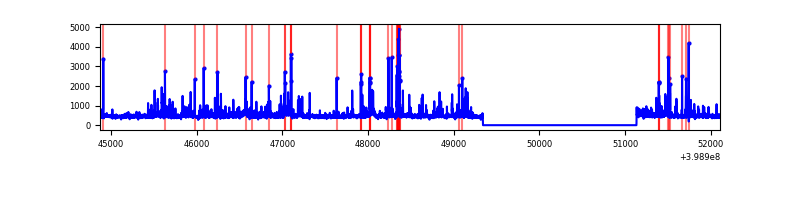 |
Top three noisy pixels from each quadrant. If the there are fewer than three noisy pixels in the level2.evt file, extra rows are filled as -1
| Pixel properties | Quadrant properties | ||||||
|---|---|---|---|---|---|---|---|
| Quadrant | DetID | PixID | Counts | Sigma | Mean | Median | Sigma |
| A | 10 | 83 | 280812 | 2199.43 | 632 | 621 | 127.4 |
| A | 13 | 248 | 113887 | 889.11 | 632 | 621 | 127.4 |
| A | 9 | 143 | 72570 | 564.78 | 632 | 621 | 127.4 |
| B | 0 | 190 | 170869 | 1418.42 | 621 | 605 | 120.0 |
| B | 12 | 18 | 102504 | 848.89 | 621 | 605 | 120.0 |
| B | 5 | 172 | 74200 | 613.1 | 621 | 605 | 120.0 |
| C | 1 | 23 | 768217 | 5462.0 | 602 | 606 | 140.5 |
| C | 15 | 214 | 229132 | 1626.09 | 602 | 606 | 140.5 |
| C | 0 | 10 | 157387 | 1115.59 | 602 | 606 | 140.5 |
| D | 2 | 249 | 316533 | 2087.32 | 614 | 596 | 151.4 |
| D | 13 | 249 | 111799 | 734.69 | 614 | 596 | 151.4 |
| D | 2 | 153 | 39722 | 258.49 | 614 | 596 | 151.4 |
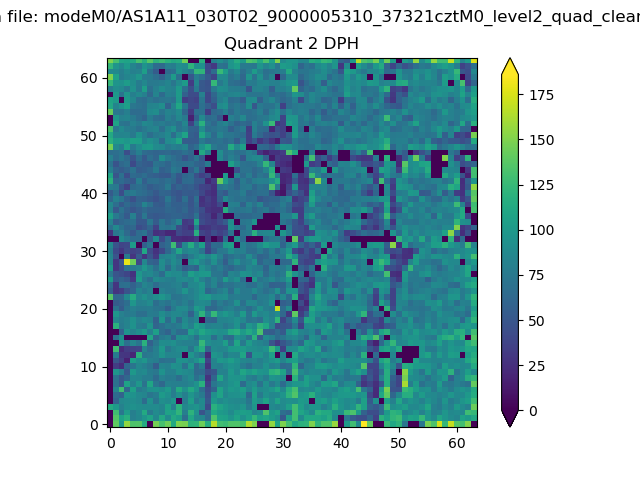
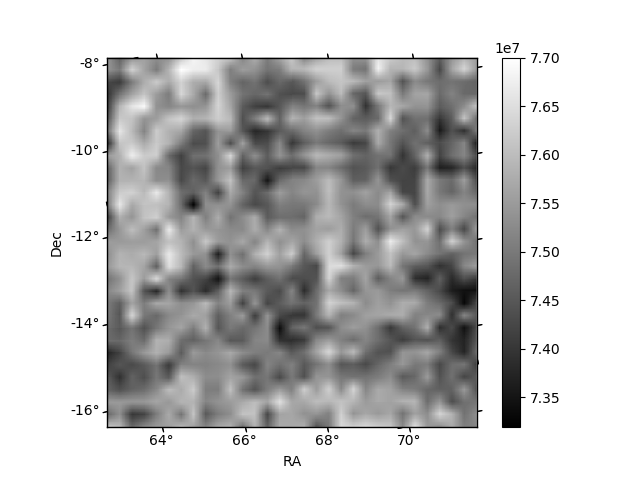
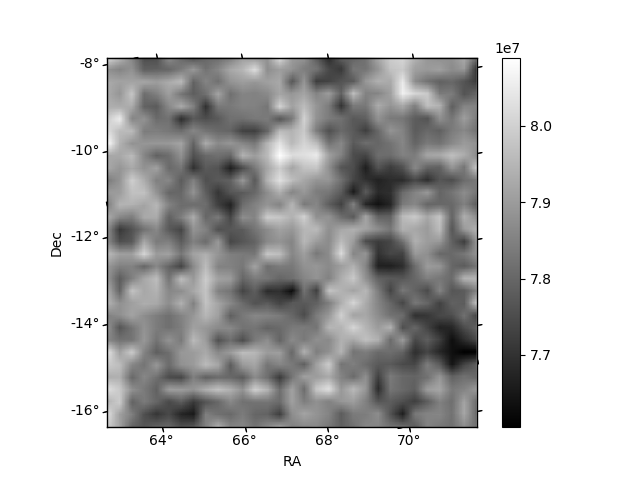
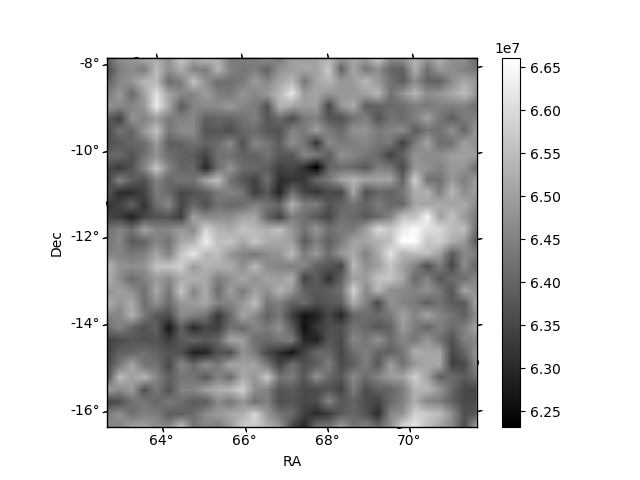
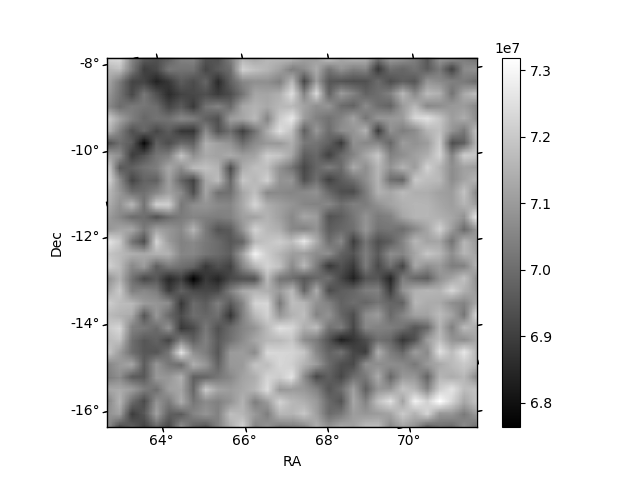
Histogram calculated using DETX and DETY for each event in the final _common_clean file
| Quadrant A | 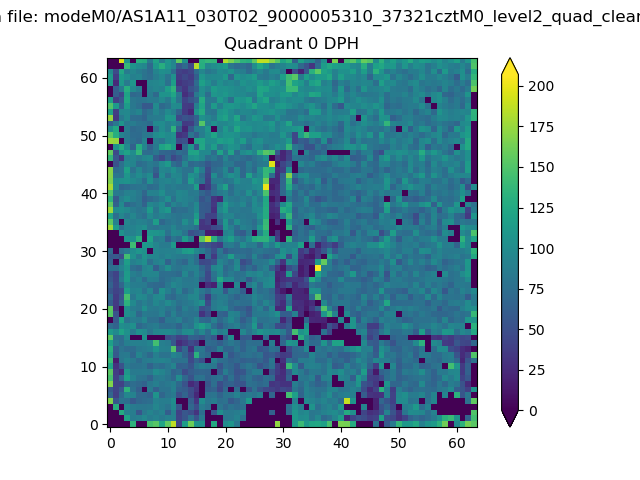 |
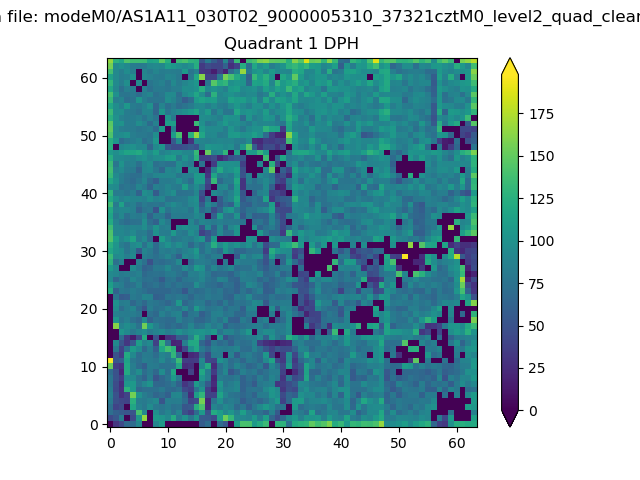 |
Quadrant B |
|---|---|---|---|
| Quadrant D | 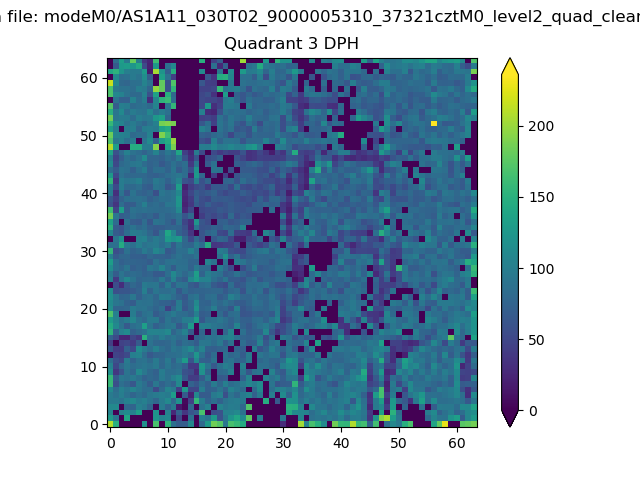 |
 |
Quadrant C |
| Plot type | Count rate plots | Images |
|---|---|---|
| Comparison with Poisson distribution Blue bars denote a histogram of data divided into 1 sec bins. Red curve is a Poisson curve with rate = median count rate of data. |
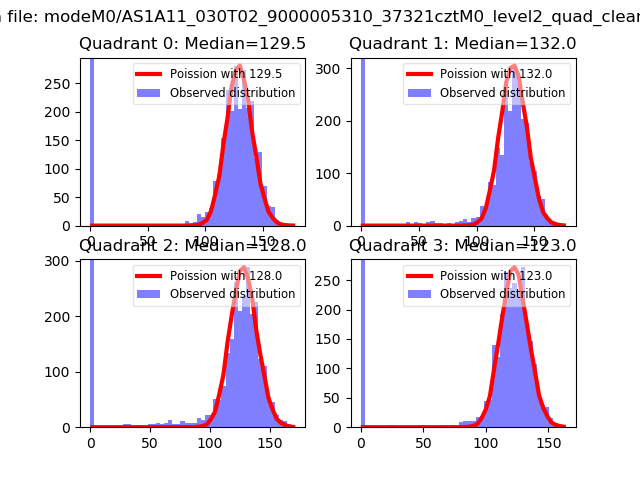 |
 |
| Quadrant-wise count rates Data is divided into 100 sec bins |
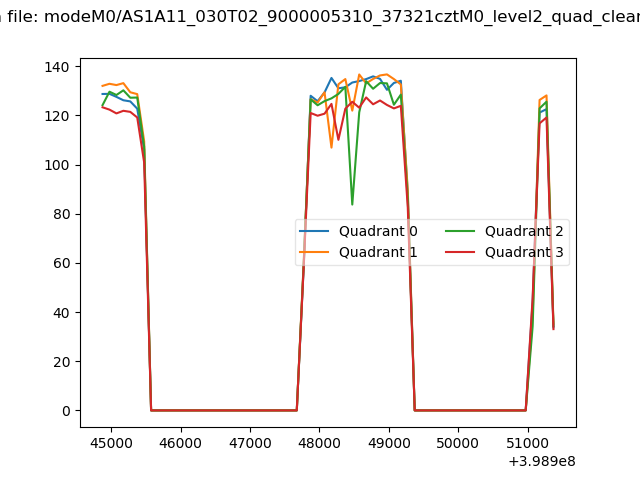 |
|
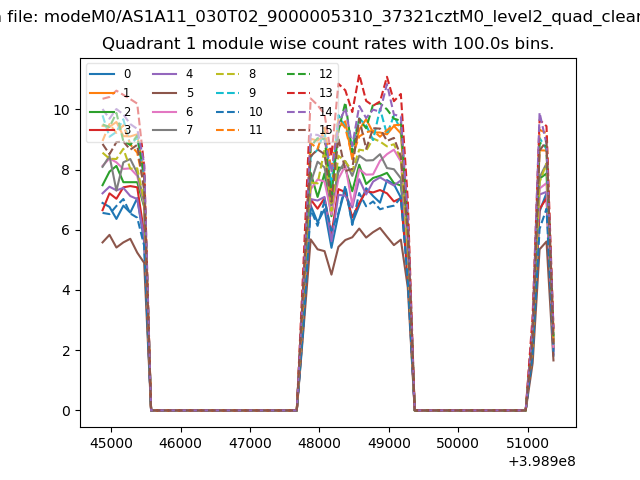
| Module-wise count rates for Quadrant A Data is divided into 100 sec bins |
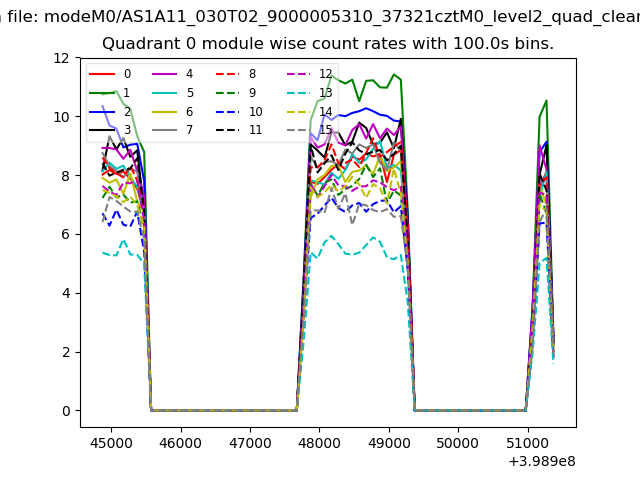 |
 |
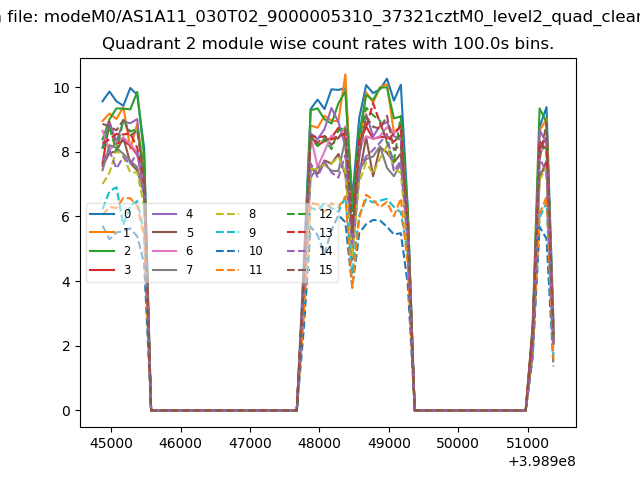
| Module-wise count rates for Quadrant B Data is divided into 100 sec bins |
 |
 |
| Module-wise count rates for Quadrant C Data is divided into 100 sec bins |
 |
 |
| Module-wise count rates for Quadrant D Data is divided into 100 sec bins |
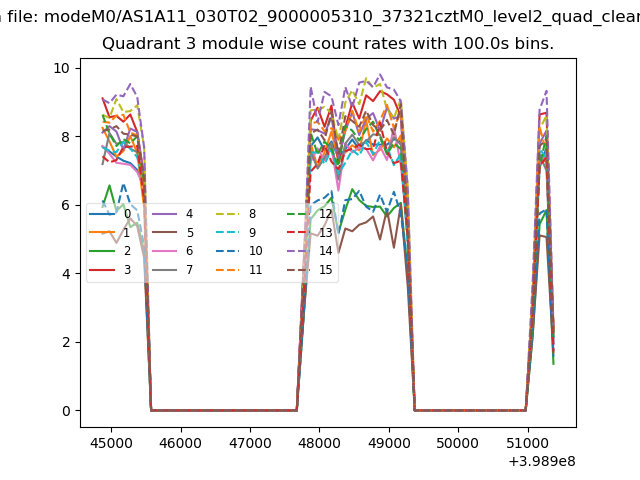 |
 |
| Parameter | Plot |
|---|---|
| CZT HV Monitor |  |
| D_VDD | 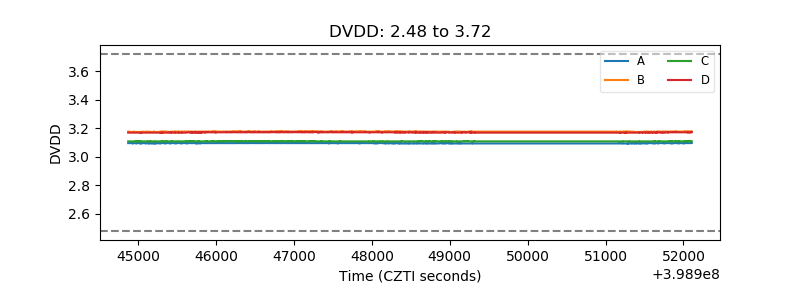 |
| Temperature 1 | 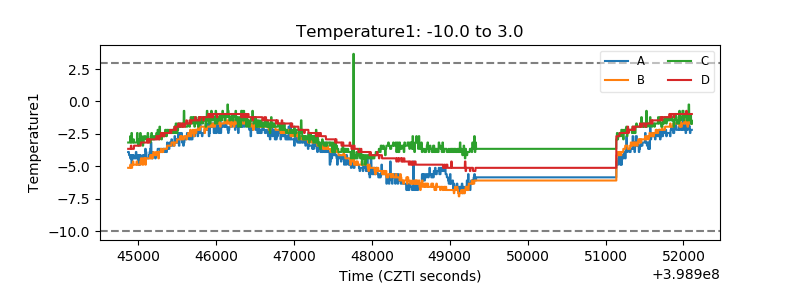 |
| Veto HV Monitor | 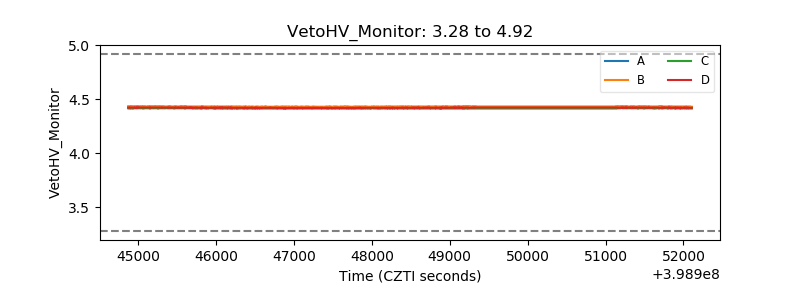 |
| Veto LLD | 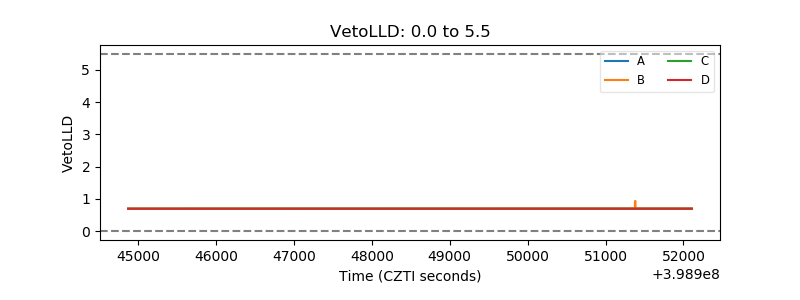 |
| Alpha Counter | 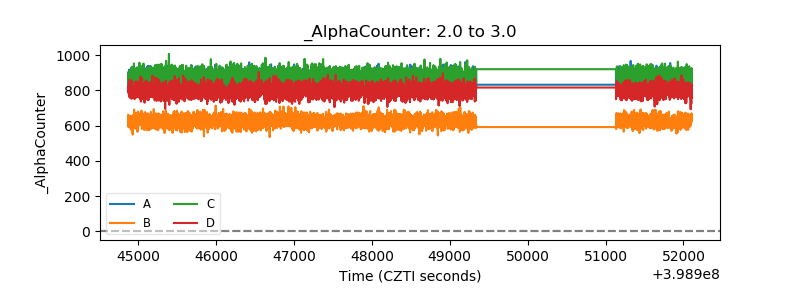 |
| _CPM_Rate | 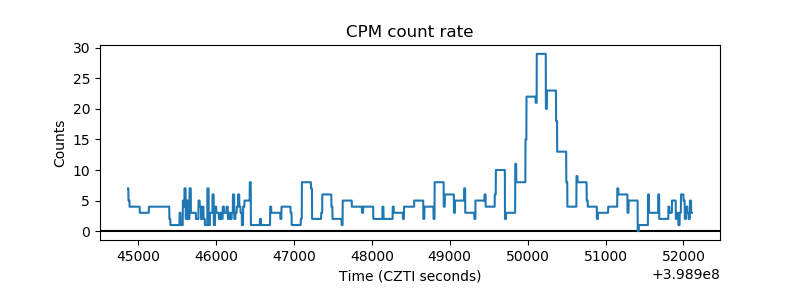 |
| CZT Counter | 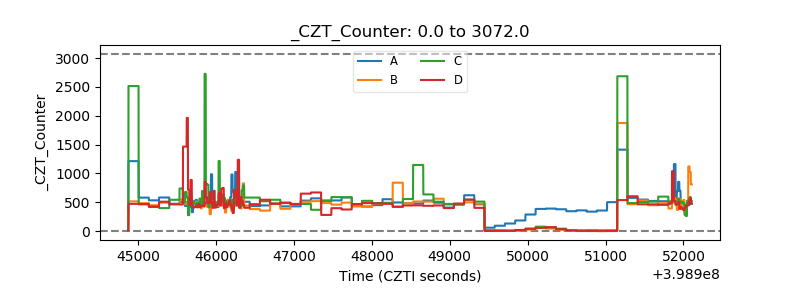 |
| +2.5 Volts monitor | 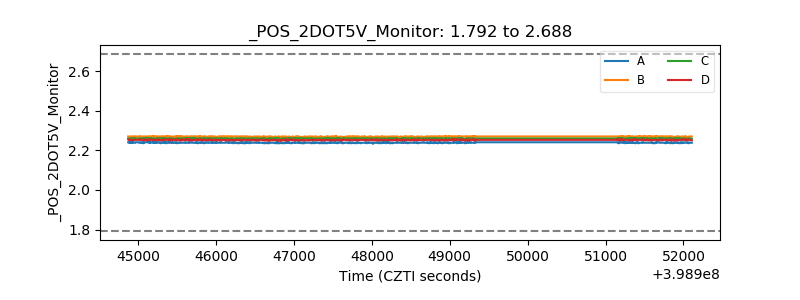 |
| +5 Volts monitor | 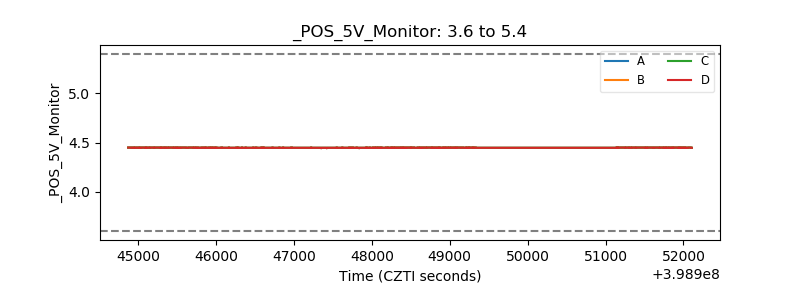 |
| _ROLL_ROT | 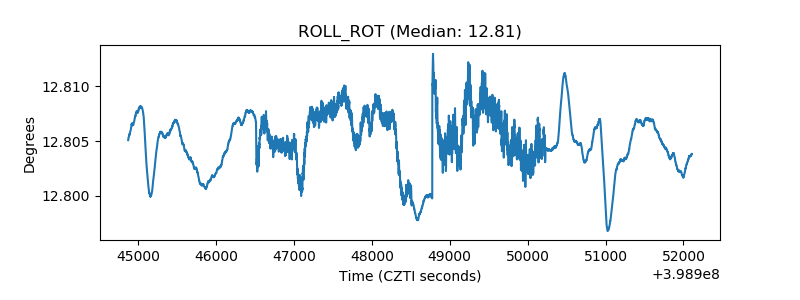 |
| _Roll_DEC | 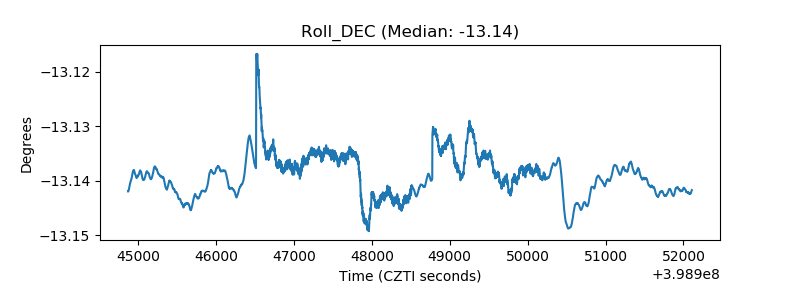 |
| _Roll_RA | 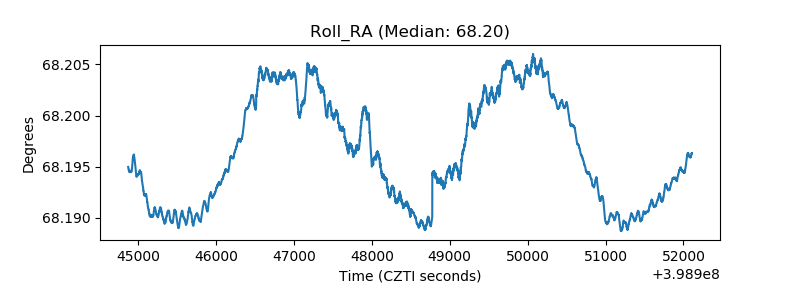 |
| Veto Counter | 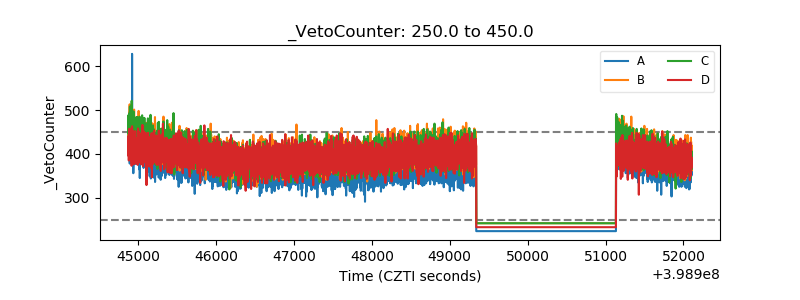 |